
Migration remittances and development indicators The economic pillar

- Slides: 14
Migration, remittances, and development indicators: The economic pillar Ben Slay Team leader, regional poverty reduction practice UNDP—Europe and Central Asia Almaty, 1 November 2013
Three inter-woven themes • Economics of migration and remittances • Policy areas or particular relevance: – Labour markets – Macroeconomics – External sector (balance of payments) – Development • Measurement/indicator issues – Suggested indicator framework
The labour market and (external) migration • Pluses: – Employment – Human capital acquisition • Minuses: – Brain drain – Informality: • Host countries—many migrants work in informal sector • Countries of origin—migrants don’t contribute to state pension funds – Social impacts: • Host countries—risk of exploitation, social tensions • Countries of origin—split-up families, hardships for children
Macroeconomic, balance-of-payments dimensions—Pluses • Global economy: Migration from lower to higher productivity countries increases global GDP • Host countries—migration reduces: – Wage-push inflationary pressures – Sectoral, regional labour market shortages • Countries of origin—remittances support: – Domestic financial systems: • Foreign exchange inflows (stable exchange rates) • Working capital for small businesses – Domestic demand: • Consumption • Investment (housing construction)
Macroeconomic, balance-of-payments dimensions—Minuses • Countries of origin: – Dutch disease? • Remittance inflows may boost real exchange rate and reduce the competitiveness of labour-intensive exports • Value added captured by host country instead – Excessive consumption? – Sustainability? • External shocks (2008 -2009) • Migration cycle • Host countries: – Lower wages?
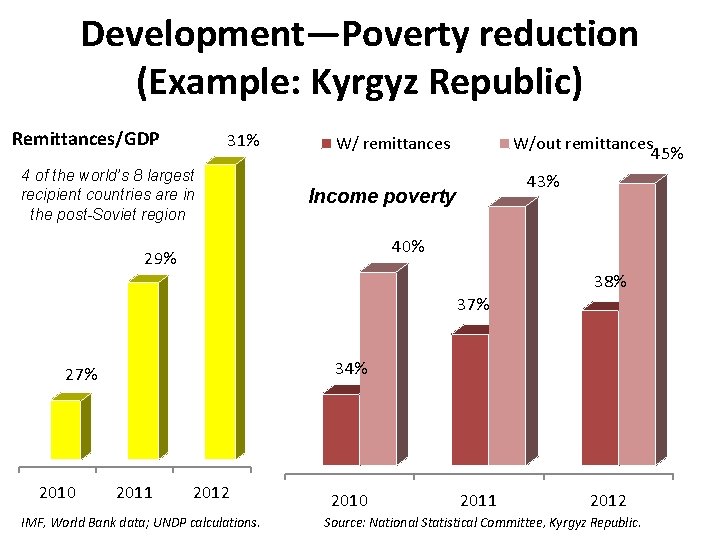
Development—Poverty reduction (Example: Kyrgyz Republic) Remittances/GDP 31% 4 of the world’s 8 largest recipient countries are in the post-Soviet region W/ remittances W/out remittances 45% 43% Income poverty 40% 29% 38% 37% 34% 27% 2010 2011 2012 IMF, World Bank data; UNDP calculations. 2010 2011 2012 Source: National Statistical Committee, Kyrgyz Republic.
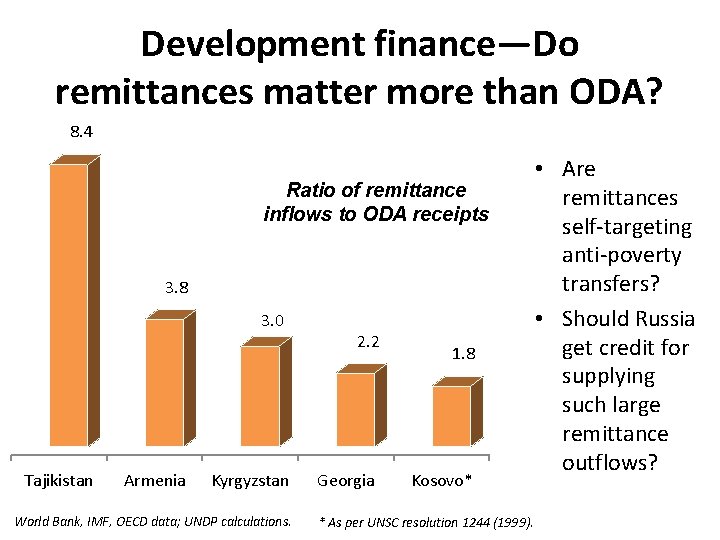
Development finance—Do remittances matter more than ODA? 8. 4 Ratio of remittance inflows to ODA receipts 3. 8 3. 0 Tajikistan Armenia Kyrgyzstan World Bank, IMF, OECD data; UNDP calculations. 2. 2 Georgia 1. 8 Kosovo* * As per UNSC resolution 1244 (1999). • Are remittances self-targeting anti-poverty transfers? • Should Russia get credit for supplying such large remittance outflows?
Measurement issues: Labour markets • Key institutions: – Statistical offices – Ministries of labour/social protection – Migration/border services • Survey data: – Labour force surveys – Household budget surveys – Company data (on recruitments, redundancies) • Registration data (from migration/border services) • Migration data can be “backed out” from data on: – Remittance inflows – Average wages in key sectors
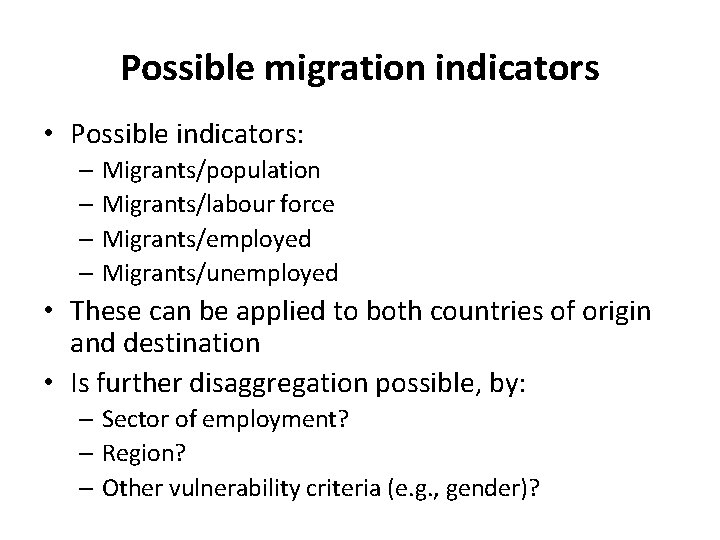
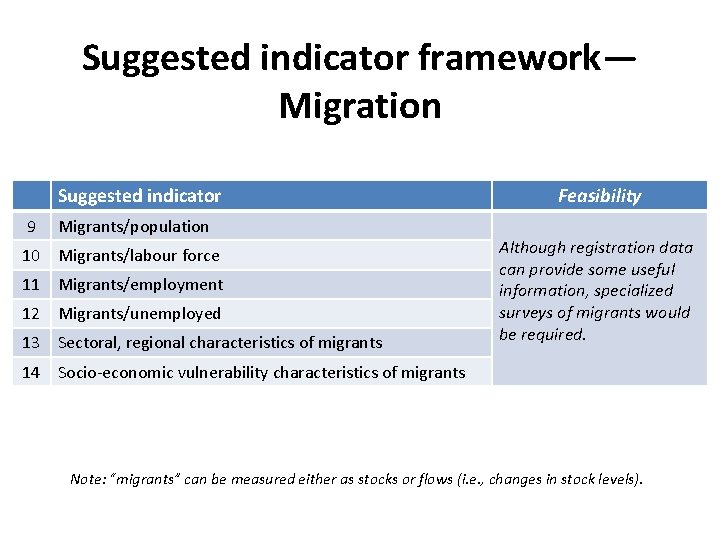
Possible migration indicators • Possible indicators: – Migrants/population – Migrants/labour force – Migrants/employed – Migrants/unemployed • These can be applied to both countries of origin and destination • Is further disaggregation possible, by: – Sector of employment? – Region? – Other vulnerability criteria (e. g. , gender)?
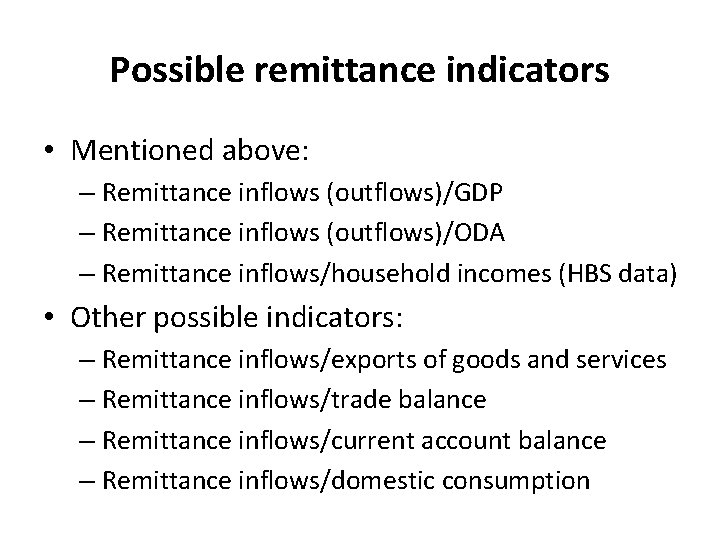
Possible remittance indicators • Mentioned above: – Remittance inflows (outflows)/GDP – Remittance inflows (outflows)/ODA – Remittance inflows/household incomes (HBS data) • Other possible indicators: – Remittance inflows/exports of goods and services – Remittance inflows/trade balance – Remittance inflows/current account balance – Remittance inflows/domestic consumption
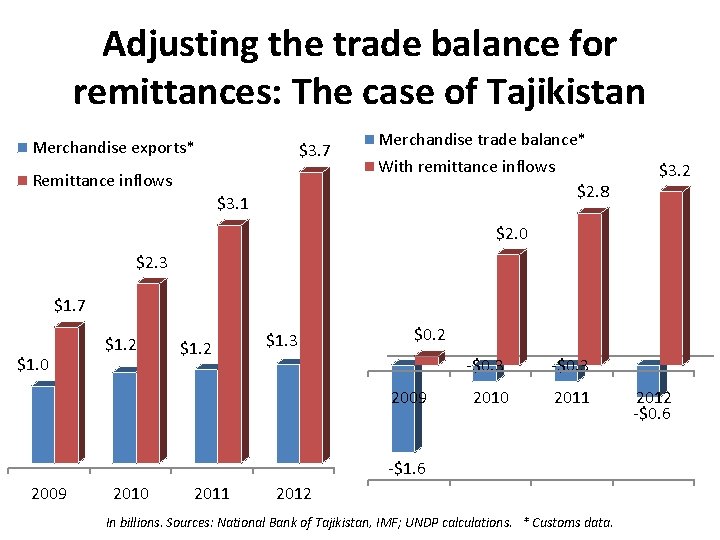
Adjusting the trade balance for remittances: The case of Tajikistan Merchandise exports* $3. 7 Remittance inflows $3. 1 Merchandise trade balance* With remittance inflows $2. 8 $3. 2 $2. 0 $2. 3 $1. 7 $1. 0 $1. 2 $1. 3 $0. 2 -$0. 3 2009 2010 -$0. 3 2011 -$1. 6 2009 2010 2011 2012 In billions. Sources: National Bank of Tajikistan, IMF; UNDP calculations. * Customs data. 2012 -$0. 6
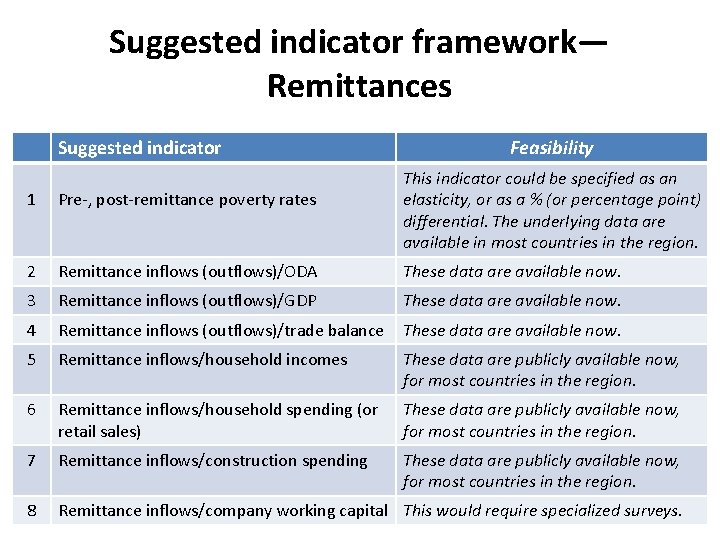
Suggested indicator framework— Remittances Suggested indicator Feasibility This indicator could be specified as an elasticity, or as a % (or percentage point) differential. The underlying data are available in most countries in the region. 1 Pre-, post-remittance poverty rates 2 Remittance inflows (outflows)/ODA These data are available now. 3 Remittance inflows (outflows)/GDP These data are available now. 4 Remittance inflows (outflows)/trade balance These data are available now. 5 Remittance inflows/household incomes These data are publicly available now, for most countries in the region. 6 Remittance inflows/household spending (or retail sales) These data are publicly available now, for most countries in the region. 7 Remittance inflows/construction spending These data are publicly available now, for most countries in the region. 8 Remittance inflows/company working capital This would require specialized surveys.
Suggested indicator framework— Migration Suggested indicator 9 Migrants/population 10 Migrants/labour force 11 Migrants/employment 12 Migrants/unemployed 13 Sectoral, regional characteristics of migrants Feasibility Although registration data can provide some useful information, specialized surveys of migrants would be required. 14 Socio-economic vulnerability characteristics of migrants Note: “migrants” can be measured either as stocks or flows (i. e. , changes in stock levels).
Thank you very much! Ben. slay@undp. org