MidWest Electric Consumers Association US Army Corps of


- Slides: 14
Mid-West Electric Consumers Association US Army Corps of Engineers Status Update 255 255 237 237 217 217 200 200 0 163 163 131 132 122 Gary Hinkle Chief, Maintenance Engineering/ Management Support Branch 239 65 53 80 119 27 252 174. 59 110 135 120 112 92 56 23 June 2020 “The views, opinions and findings contained in this report are those of the authors(s) and should not be construed as an official Department of the Army position, policy or decision, unless so designated by other official documentation. ” 62 102 130 102 56 48 130 120 111
COVID-19 Impacts Omaha District 1, 100 Employees – Zero Positive for COVID • District Office Restrictions • Maximum Telework Encouraged / Virtual Meetings • Travel Moratorium through 30 June • Return to Offices Begins 15 June using 4 Phases • Field / Powerhouse Restrictions • • • Control Room Restrictions Split Crews for Craftspeople PPE / Janitorial Changes Additional Funding for COVID Return $250 K Recreational Areas Closed; Re-opening started 1 June • Project Execution • Keep Contractors Working / Keep Project on Schedule • Virtual Engineering / Conduct Virtual Contractor Site Visits • Savings / Slippage in many forms • Contract Impacts • • Gavins Point Turbine Cavitation Repair Ft Randall Asbestos & Heavy Metal Dust Housekeeping Oahe Digital Governor Repairs (Mod to remobilize) Garrison Repaint / Repair Penstock Gates
Customer Funded Program Status - FY 2020 • 5 contract actions scheduled • $28. 8 M in baseline obligations • FY 20 Awards: • • • Ft Randall Intake Gates Ft Randall Motor Control Centers Oahe GSU Bushing Replacement Ft Peck GSU Install Ft Peck High Resistance Grounding • FY 20 Projects Delayed • Gavins Point Cooler Replacement • FY 20 Project Closeouts: 14+ • $1. 4 M for FY 2021 reprogramming • FY 21 Customer Request • $72 M; Nine Projects incl FR Rehab
Project Status Gavins Point – Cavitation Repair Ft Randall HRG & Tunnel Fan Array Install Oahe / Big Bend MCC Replacements
Zebra Mussel Update AFTER BEFORE
Fort Randall Rehab Update • Current Status • 2 ND Industry Day Completed • Source Selection Requirements posted for industry comment • Advertise set posted for final comment • Ready to Advertise 2 October • Scheduled Award 2 August 2021 • Lessons Learned • Meeting w/ Walla Contracting Officer to discuss lessons learned on Mc. Nary Rehab award protest • Concentrating on Source Selection & Post-award management Plans
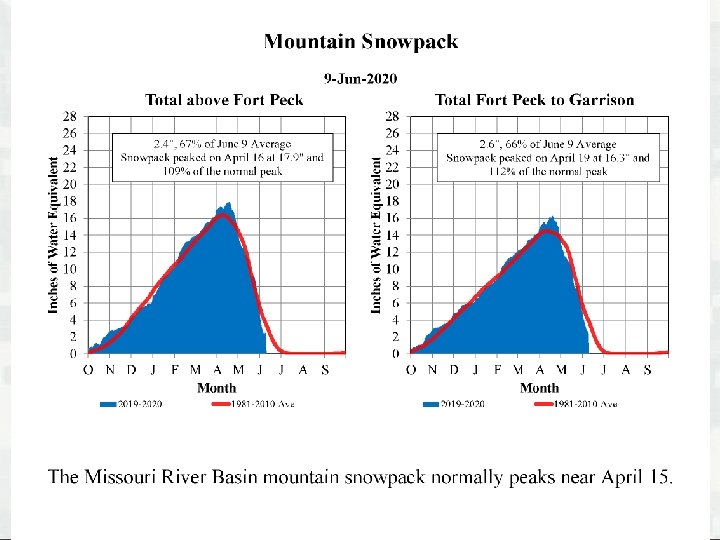
Missouri River Basin 2020 Water Year • Runoff above Sioux City is forecasted to be 32. 2 MAF (125% of average) • No major flooding • Projected power production of 11. 0 BKWH, 17% higher than the 9. 4 BKWH average
Missouri River Mainstem System Annual Runoff above Sioux City, IA 70 2020 Million Acre-Feet Historic Drought Periods 60 50 40 30 20 34. 5 MAF 10% 30. 6 25% U. D. U. Q. 24. 6 50% Med. 19. 3 16. 1 75% 90% L. Q. L. D. 10 0 1890 1900 1910 1920 1930 1940 1950 1960 1970 1980 1990 2000 2010 Year
CY 2020 Missouri River Runoff Above Sioux City, Iowa Million Acre-Feet Jan Feb Mar Apr May Actual June 1, 2020 Forecast – 32. 3 MAF – 125% Average: 25. 8 MAF Jun 2020 Normal Jul Aug Forecast Sep Oct Nov Dec
Missouri River Mainstem System Forecasted Energy Generation 1600 Energy in GWh 1400 1200 1000 800 600 400 200 0 Jan Feb Mar Apr May Actual Upper Basic: 13, 000 GWh Basic: 11, 000 GWh Lower Basic: 10, 300 GWh Jun Jul Aug 2020 Forecast Sep Oct 1967 -2019 Nov Dec J 21 F 21
Missouri River Mainstem System storage zones and allocations Historic max - 2011 72. 8 Exclusive Flood Control 6% *Storages updated in August 2013 based on reservoir surveys. 72. 4 67. 7 Annual Flood Control & Multiple. June 11, 2020 Use 16% Carryover Multiple Use 53% Storage In MAF* Historic min - 2007 Permanent Pool 25% 60. 5 56. 1 33. 9 17. 6 0
Mainstem System Generation Million Megawatt Hours 14. 6 16 10. 0 11. 2 14 11. 1 10. 4 7. 5 9. 6 12 10 8 12. 4 9. 4 8. 7 9. 6 8. 5 7. 6 9. 6 13. 0 11. 0 6. 1 7. 5 7. 6 6. 5 5. 6 6. 3 4. 9 6 4 2 0 No 97 98 99 00 01 02 03 04 05 06 07 08 09 10 11 12 13 14 15 16 17 18 19 Forecast 20 rm Jun 1, 2020 al Forecast Upper Basic: 13. 0 Lower Basic: 10. 3
LEVEE STATUS UPDATE 14