Midterm Elections POLS 125 Political Parties Elections http


*GOODNEWSCC VOTECC = Democratic share")


- Slides: 25
Midterm Elections POLS 125: Political Parties & Elections
http: //www. thedailyshow. com/watch/monnovember-6 -2006/daily-show-rock----midterm-elections
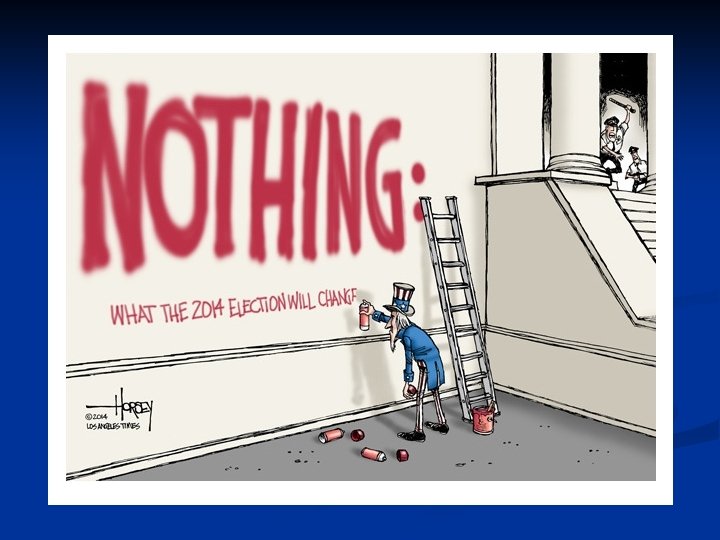
n n n Voters are apathetic, turnout is low A rigged and corrupt system ensures the reelection of incumbents Midterm elections don’t matter
Losses by the President's Party in Midterm Elections, 1862 -2010
The president’s party tends to lose seats in midterm elections. Period.
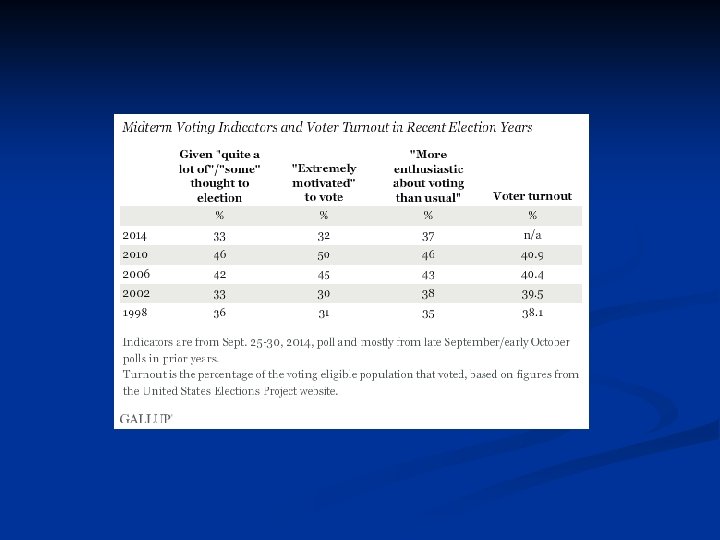
Theories of Midterm Loss n n “Surge-and-decline” focuses on shifts in voter turnout “Referendum” theories focus on the president’s popularity and performance (e. g. , national security, economic conditions)
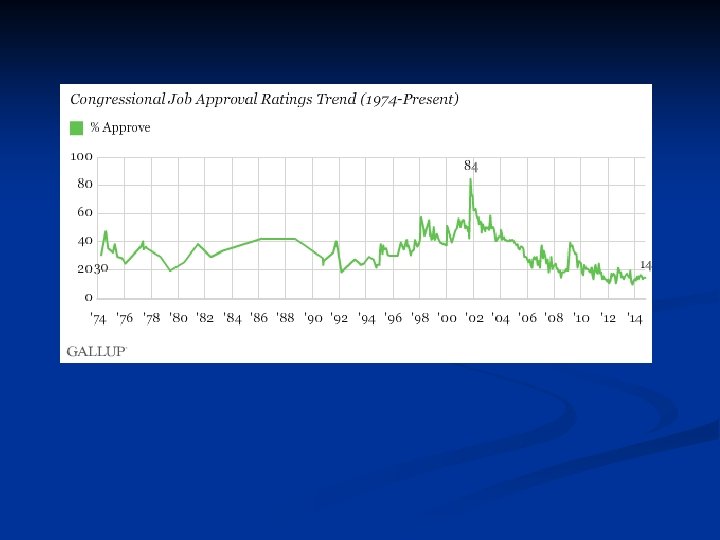
Erikson’s Theories on Midterm Loss n n Midterm loss as regression to the mean Midterm loss as surge and decline Midterm loss as a referendum on presidential performance Midterm loss as a presidential penalty
Turnout in Presidential and Mid-Term Elections, 1980 -2010 41. 3%
Erikson’s Theories on Midterm Loss n n Midterm loss as regression to the mean Midterm loss as surge and decline Midterm loss as a referendum on presidential performance Midterm loss as a presidential penalty
Tufte Model
Tufte Model
Fair’s Model VOTECC = 48. 53 -. 482*INFLATIONCC +. 710*(15/7)*GOODNEWSCC VOTECC = Democratic share of the two-party House vote in 2014. INFLATIONCC = The growth rate of the GDP deflator in the first 7 quarters of the second Obama administration, 2013: 1 -2014: 3, at an annual rate. GOODNEWSCC = The number of quarters in the first 7 quarters of the Obama administration in which the growth rate of real per capita GDP is greater than 3. 2 percent at an annual rate. These values lead to a predicted Democratic vote share of 50. 85 percent
“The economy elects presidents. Presidents elect Congress. ” — Lynn Vavreck, political scientist
http: //thedailyshow. cc. com/videos/exzp 4 a/dem ocalypse-2014 ---it-s-all-about-that-base
Erikson’s Theories on Midterm Loss n n Midterm loss as regression to the mean Midterm loss as surge and decline Midterm loss as a referendum on presidential performance Midterm loss as a presidential penalty
“We rely on statistical models for many decisions every single day, including, crucially: weather, medicine, and pretty much any complex system in which there’s an element of uncertainty to the outcome. In fact, these are the same methods by which scientists could tell Hurricane Sandy was about to hit the United States many days in advance. Dismissing predictive methods is not only incorrect; in the case of electoral politics, it’s politically harmful. ” — Zeynep Tufekci, “In Defense of Nate Silver, Election Pollsters, and Statistical Predictions”