Microsoft Virtual Academy Module 13 Monitoring Windows Server
- Slides: 30

Microsoft Virtual Academy ® Module 13 Monitoring Windows Server 2012

Module Overview • Monitoring Tools • Using Performance Monitor • Monitoring Event Logs

Monitoring Tools

Lesson 1: Monitoring Tools • Overview of Task Manager • Overview of Performance Monitor • Overview of Resource Monitor • Overview of Reliability Monitor • Overview of Event Viewer • Monitoring a Server With Server Manager

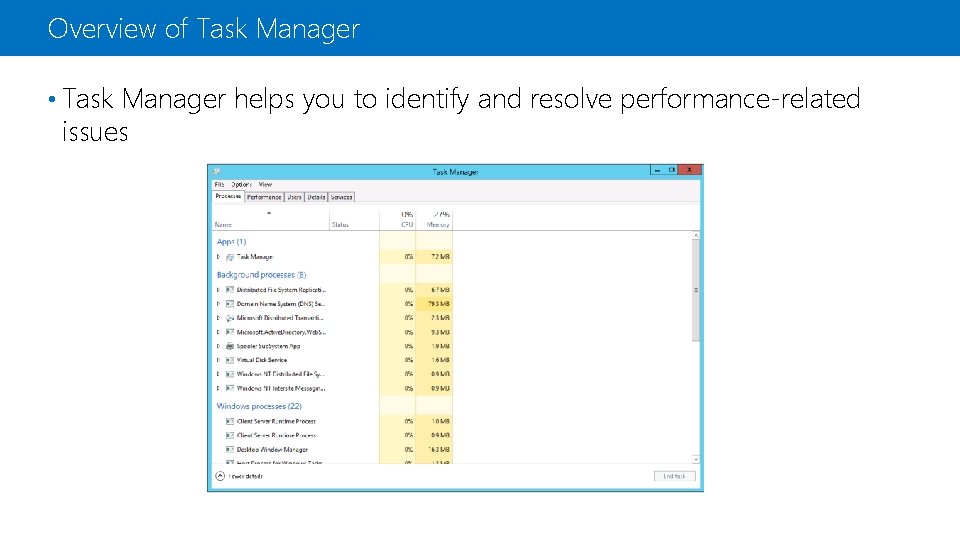
Overview of Task Manager • Task Manager helps you to identify and resolve performance-related issues

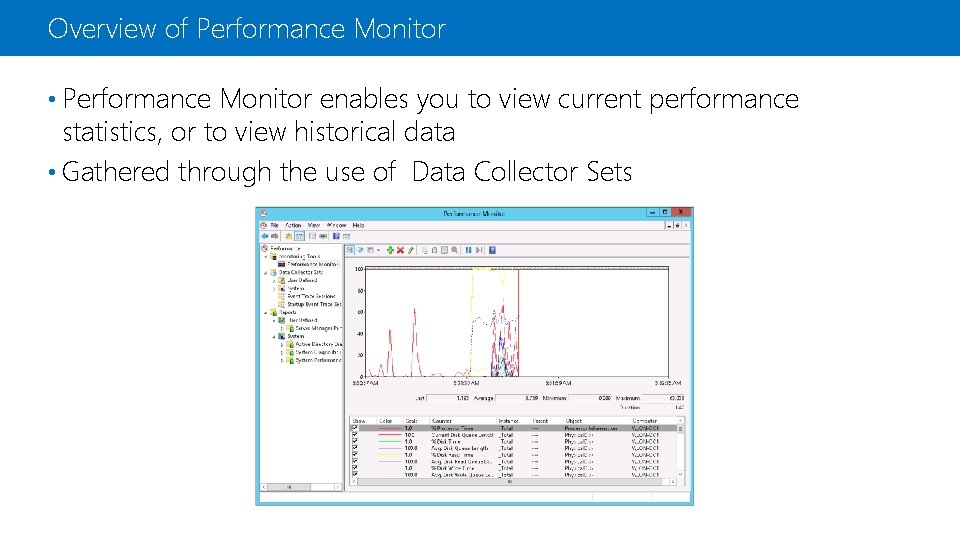
Overview of Performance Monitor • Performance Monitor enables you to view current performance statistics, or to view historical data • Gathered through the use of Data Collector Sets

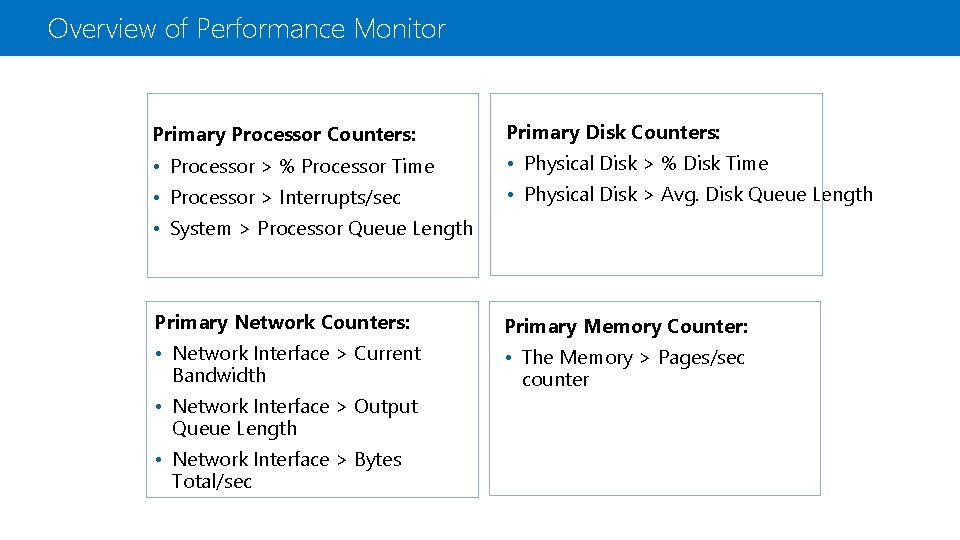
Overview of Performance Monitor Primary Processor Counters: Primary Disk Counters: • Processor > % Processor Time • Physical Disk > % Disk Time • Processor > Interrupts/sec • Physical Disk > Avg. Disk Queue Length • System > Processor Queue Length Primary Network Counters: Primary Memory Counter: • Network Interface > Current Bandwidth • The Memory > Pages/sec counter • Network Interface > Output Queue Length • Network Interface > Bytes Total/sec

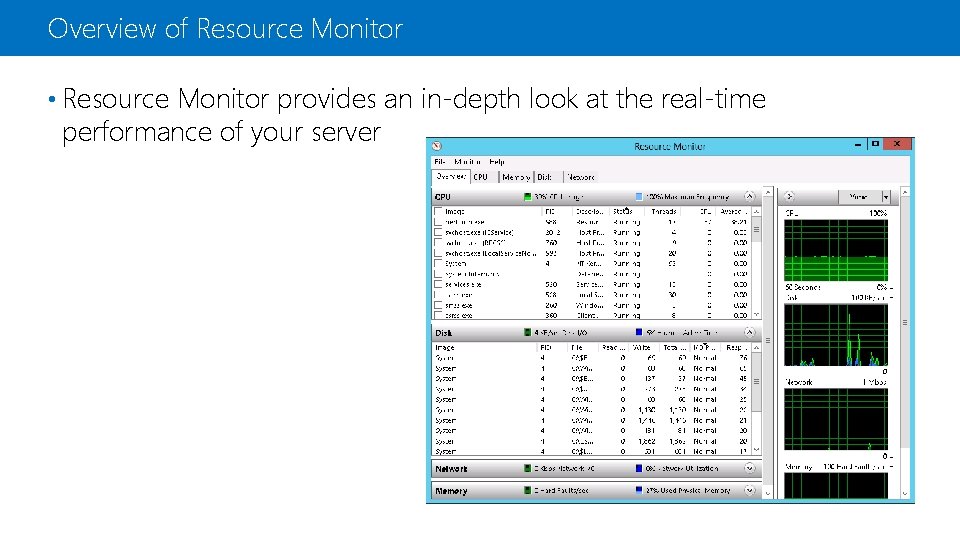
Overview of Resource Monitor • Resource Monitor provides an in-depth look at the real-time performance of your server

Overview of Reliability Monitor • Monitors hardware and software issues • Provides Stability Index number (from 1 to 10) 1 represents lowest stability • 10 represents highest stability • • Reliability monitor window components include: Historical reports on stability index • Reliability details • Action to be performed – saving historical data, starting Problem Reports console, checking online for a solution to specific problem •

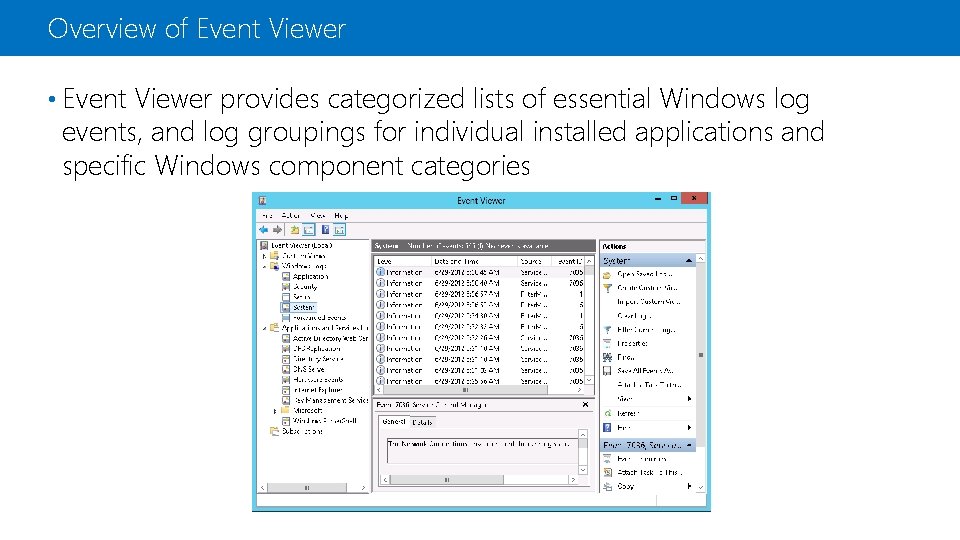
Overview of Event Viewer • Event Viewer provides categorized lists of essential Windows log events, and log groupings for individual installed applications and specific Windows component categories

Overview of Event Viewer • Event Viewer provides the ability to View multiple logs • Create customized views • Configure tasks scheduled to run in response to events • Create and manage event subscriptions • • Event Viewer has many built-in logs such as Application log • Security log • Setup log • System log • Forwarded events •

Monitoring a Server With Server Manager console: • Installed by default on Windows Server 2012, can be installed on Windows 8 • Supports monitoring of Windows Server operating systems • Provides a centralized monitoring dashboard • Analyzes or troubleshoots different types of issues • Identifies critical events • Monitors the status of Best Practices Analyzer tool

Using Performance Monitor

Lesson 2: Using Performance Monitor • Performance Baselines, Trends, and Capacity Planning • What Are Data Collector Sets? • Demonstration: Capturing Counter Data with a Data Collector Set • What Are Alerts? • Demonstration: Configuring an Alert • Demonstration: Viewing Reports in Performance Monitor • Monitoring Network Infrastructure Services • Considerations for Monitoring Virtual Machines

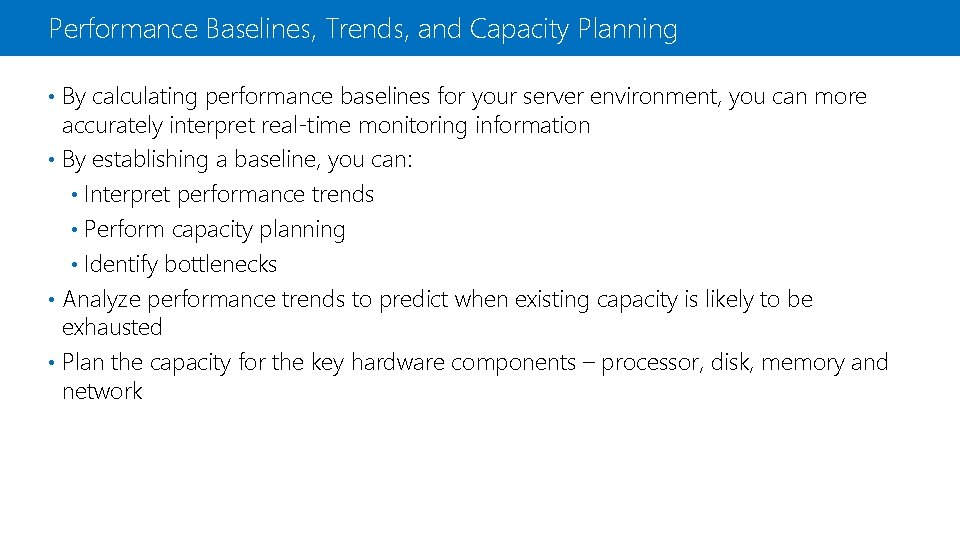
Performance Baselines, Trends, and Capacity Planning • By calculating performance baselines for your server environment, you can more accurately interpret real-time monitoring information • By establishing a baseline, you can: • Interpret performance trends • Perform capacity planning • Identify bottlenecks • Analyze performance trends to predict when existing capacity is likely to be exhausted • Plan the capacity for the key hardware components – processor, disk, memory and network

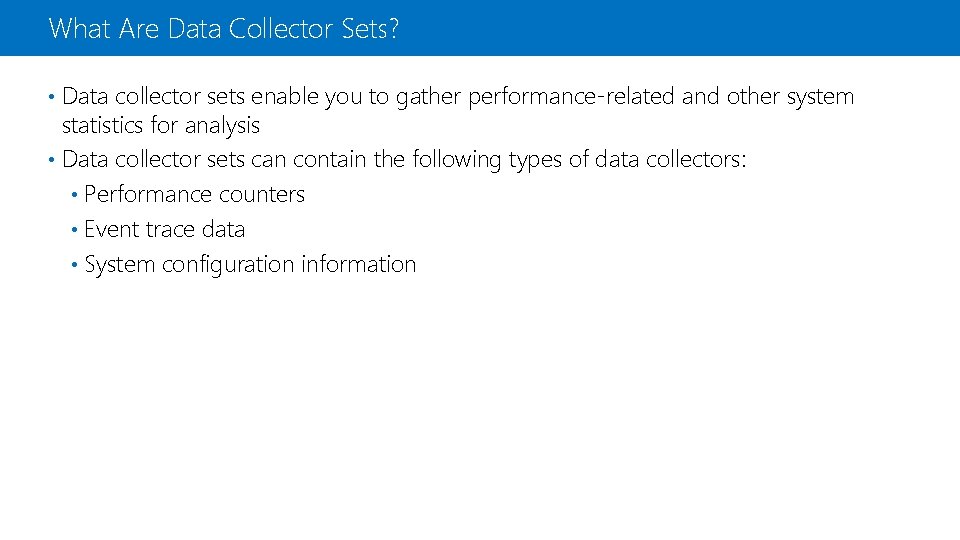
What Are Data Collector Sets? • Data collector sets enable you to gather performance-related and other system statistics for analysis • Data collector sets can contain the following types of data collectors: • Performance counters • Event trace data • System configuration information

Demonstration: Capturing Counter Data with a Data Collector Set In this demonstration, you will see how to: • Create a data collector set • Create a disk load on the server • Analyze the resulting data in a report

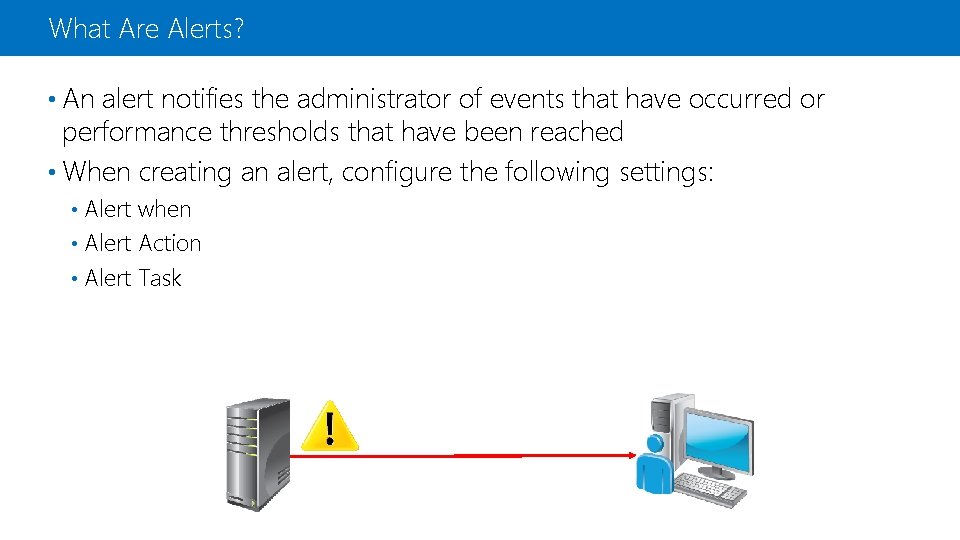
What Are Alerts? • An alert notifies the administrator of events that have occurred or performance thresholds that have been reached • When creating an alert, configure the following settings: Alert when • Alert Action • Alert Task •

Demonstration: Configuring an Alert In this demonstration, you will see how to: • Create a data collector set with an alert counter • Generate a server load that exceeds the configured threshold • Examine the event log for the resulting event

Demonstration: Viewing Reports in Performance Monitor • In this demonstration, you will see how to view a performance report

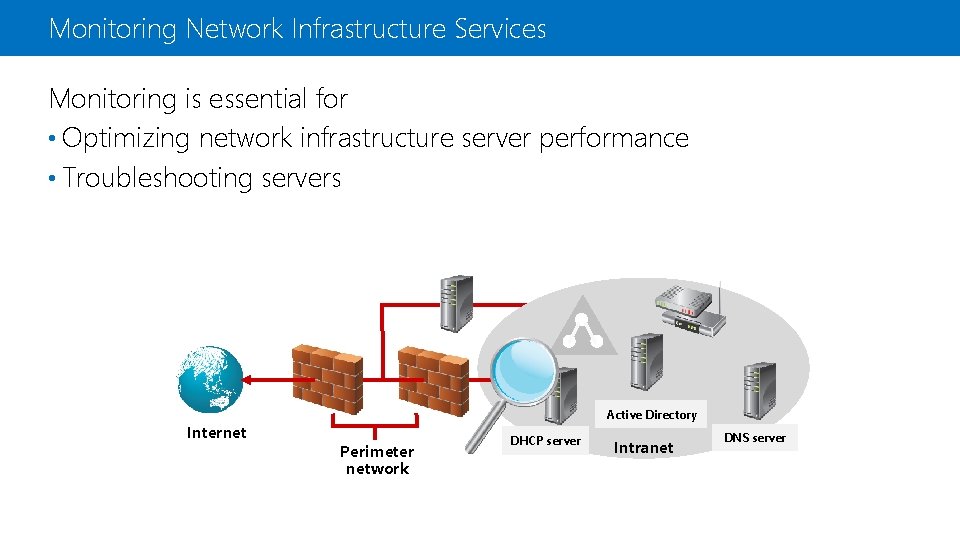
Monitoring Network Infrastructure Services Monitoring is essential for • Optimizing network infrastructure server performance • Troubleshooting servers Internet Active Directory Perimeter network DHCP server Intranet DNS server

Considerations for Monitoring Virtual Machines Considerations for monitoring virtual machines: • Virtual machines must be assigned sufficient resources for their workload • If multiple virtual machines run on a host, ensure the host has enough resources • Resources are shared, so performance of one virtual machine can affect the performance of others • You must remember to monitor the resource utilization on the host as well as the guests

Monitoring Event Logs

Lesson 3: Monitoring Event Logs • Using Server Manager to View Event Logs • What Is a Custom View? • Demonstration: Creating a Custom View • What Are Event Subscriptions? • Demonstration: Configuring an Event Subscription

Using Server Manager to View Event Logs • Server Manager provides a centralized location for event logs from remote servers • Event logging Enabled by default • Categorized by technology – AD DS, DNS, Remote Access • • Customized views Create queries for specific types of events that need to be displayed • Configure event data that needs to be displayed •

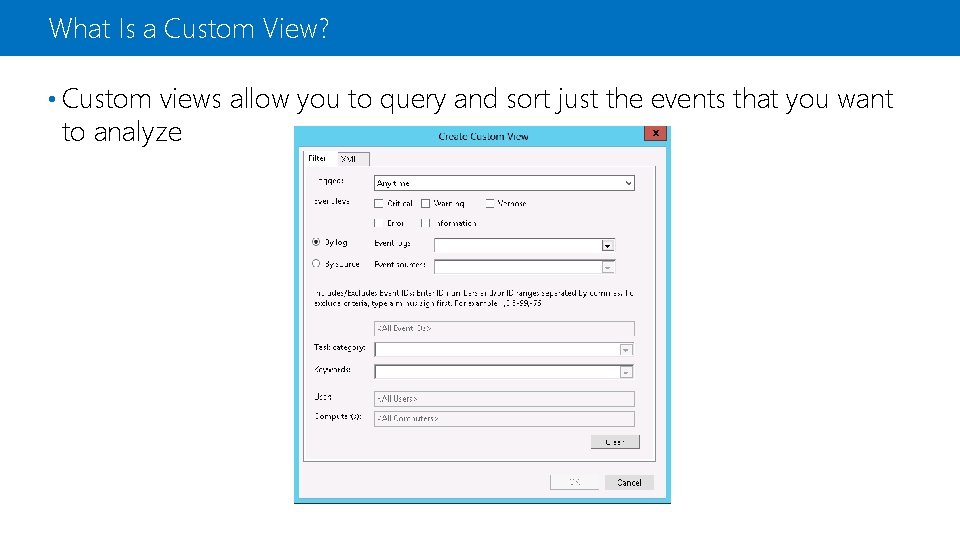
What Is a Custom View? • Custom views allow you to query and sort just the events that you want to analyze

Demonstration: Creating a Custom View In this demonstration, you will see how to: • View Server Roles custom views • Create a custom view

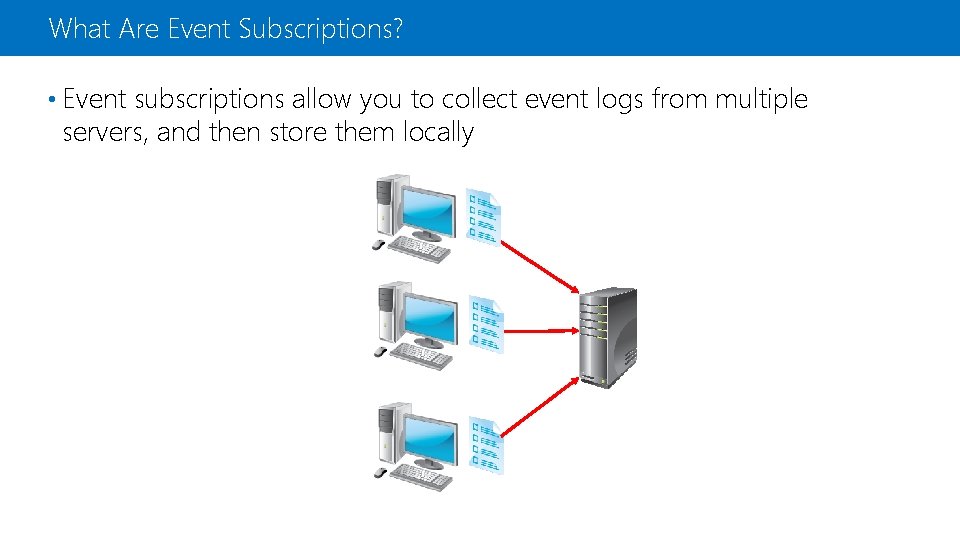
What Are Event Subscriptions? • Event subscriptions allow you to collect event logs from multiple servers, and then store them locally

Demonstration: Configuring an Event Subscription In this demonstration, you will see how to: • Configure the source computer • Configure the collector computer • Create and view the subscribed log

Additional Resources & Next Steps Instructor-Led Courses • 20411 C: Administering Windows Server 2012 Books • Exam Ref 70 -411: Administering Windows Server 2012 Exams & Certifications • Exam 70 -411: Administering Windows Server 2012