Microsoft SQL Server 2000 Performance Matthew Stephen SQL






![Wait types 2 • DBCC sqlperf(waitstats, [clear]) – Cumulative waittypes & waittimes – Limitation: Wait types 2 • DBCC sqlperf(waitstats, [clear]) – Cumulative waittypes & waittimes – Limitation:](https://slidetodoc.com/presentation_image_h2/e716428b158d68ece1947e998545544a/image-57.jpg)
![Virtual System Tables • : : Fn_virtualfilestats (dbid, [file. Id | -1]) – Provides Virtual System Tables • : : Fn_virtualfilestats (dbid, [file. Id | -1]) – Provides](https://slidetodoc.com/presentation_image_h2/e716428b158d68ece1947e998545544a/image-69.jpg)



- Slides: 92

Microsoft® SQL Server™ 2000 Performance Matthew Stephen SQL Server Evangelist http: //blogs. msdn. com/mat_stephen Mattstep@microsoft. com Microsoft Corporation

What We Will Cover • • • Locking Query Processor Query Tuning System Configuration Performance Monitoring

Session Prerequisites • This session assumes that you understand the fundamentals of – Windows® 2000 Server – SQL Server 2000 – System Monitor Level 200 -300

Agenda • • • Locking Query Processor Query Tuning System Configuration Performance Monitoring

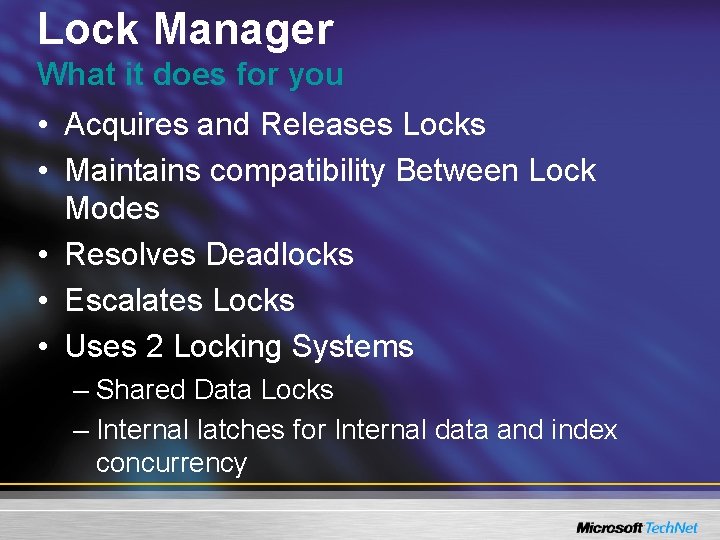
Lock Manager What it does for you • Acquires and Releases Locks • Maintains compatibility Between Lock Modes • Resolves Deadlocks • Escalates Locks • Uses 2 Locking Systems – Shared Data Locks – Internal latches for Internal data and index concurrency

Lock Isolation Levels • Supports all 4 ANSI and ISO isolation levels – Serializable – Repeatable Read – Read Committed – Read Uncommitted

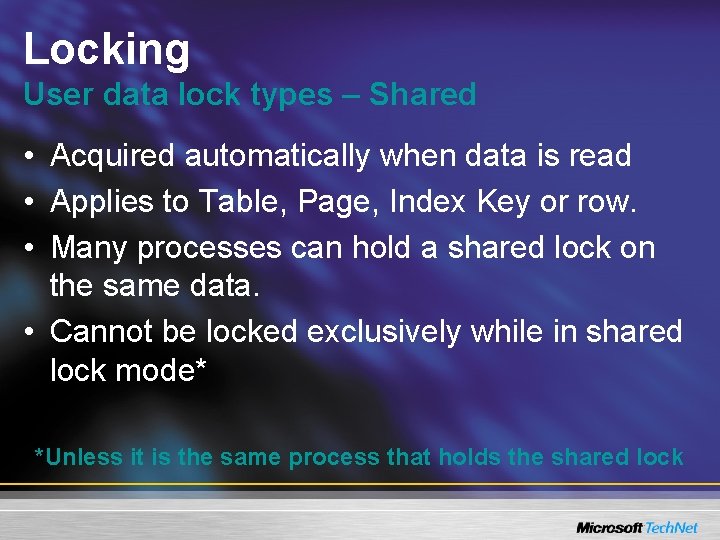
Locking User data lock types – Shared • Acquired automatically when data is read • Applies to Table, Page, Index Key or row. • Many processes can hold a shared lock on the same data. • Cannot be locked exclusively while in shared lock mode* *Unless it is the same process that holds the shared lock

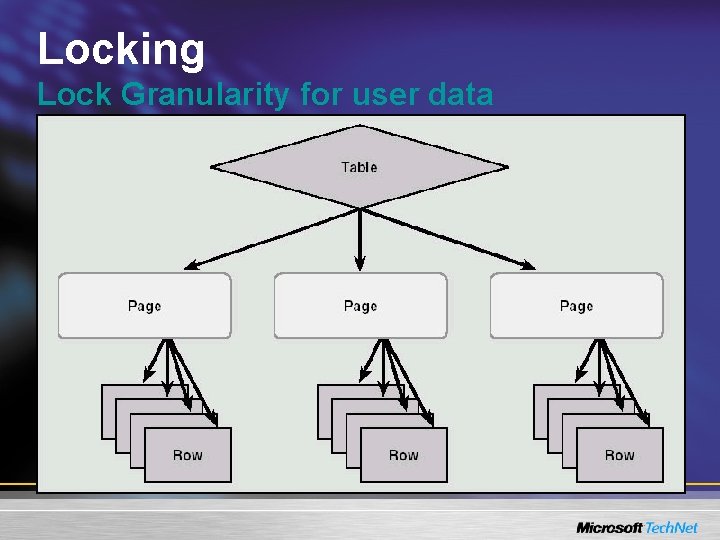
Locking Lock Granularity for user data

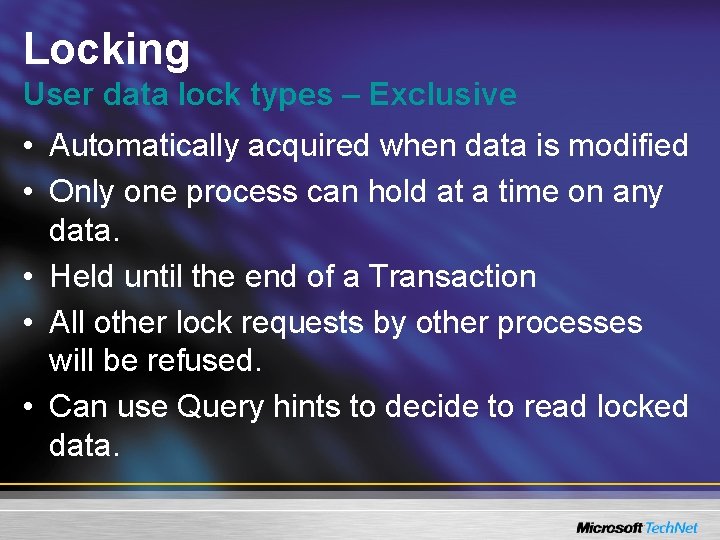
Locking User data lock types – Exclusive • Automatically acquired when data is modified • Only one process can hold at a time on any data. • Held until the end of a Transaction • All other lock requests by other processes will be refused. • Can use Query hints to decide to read locked data.

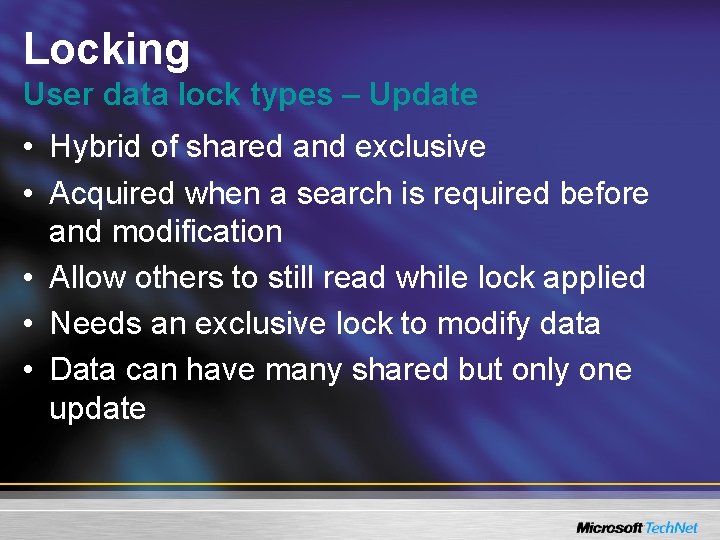
Locking User data lock types – Update • Hybrid of shared and exclusive • Acquired when a search is required before and modification • Allow others to still read while lock applied • Needs an exclusive lock to modify data • Data can have many shared but only one update

Locking User data lock types – Intent • Not a real lock mode just a qualifier e. g. Intent Update lock • Qualifier to modes already discussed

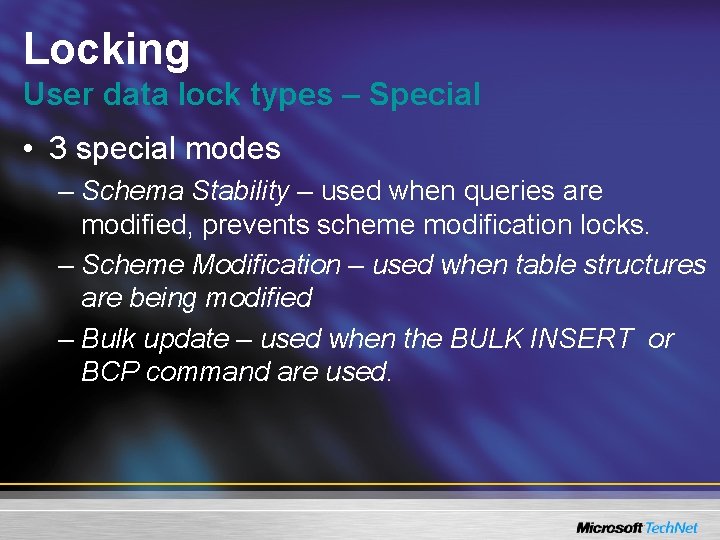
Locking User data lock types – Special • 3 special modes – Schema Stability – used when queries are modified, prevents scheme modification locks. – Scheme Modification – used when table structures are being modified – Bulk update – used when the BULK INSERT or BCP command are used.

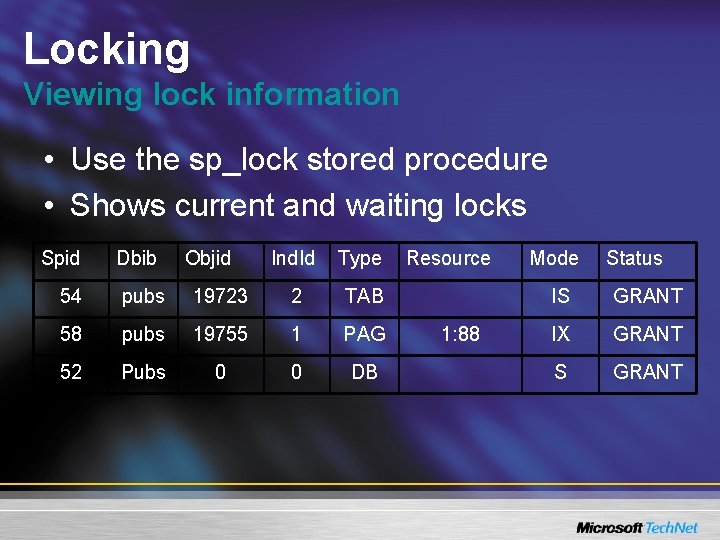
Locking Viewing lock information • Use the sp_lock stored procedure • Shows current and waiting locks Spid Dbib Objid Ind. Id Type 54 pubs 19723 2 TAB 58 pubs 19755 1 PAG 52 Pubs 0 0 DB Resource 1: 88 Mode Status IS GRANT IX GRANT S GRANT

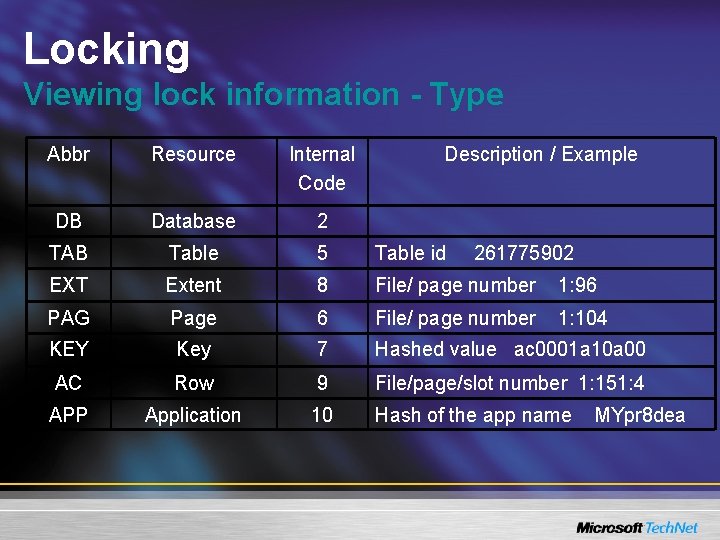
Locking Viewing lock information - Type Abbr Resource Internal Code Description / Example DB Database 2 TAB Table 5 Table id EXT Extent 8 File/ page number 1: 96 PAG Page 6 File/ page number 1: 104 KEY Key 7 Hashed value ac 0001 a 10 a 00 AC Row 9 File/page/slot number 1: 151: 4 APP Application 10 Hash of the app name 261775902 MYpr 8 dea

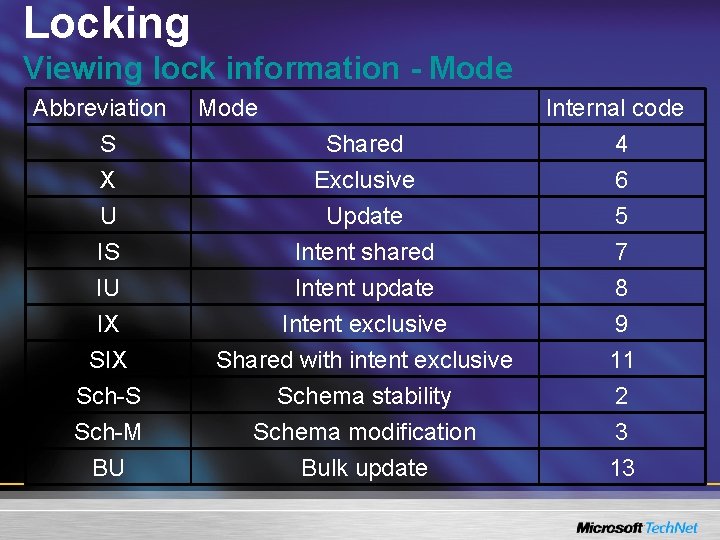
Locking Viewing lock information - Mode Abbreviation S X U IS IU IX Sch-S Sch-M BU Mode Shared Exclusive Update Internal code 4 6 5 Intent shared Intent update Intent exclusive Shared with intent exclusive Schema stability Schema modification Bulk update 7 8 9 11 2 3 13

Locking Lock Overhead • Lock Overhead – Each lock – 32 bytes – Each Process holding lock – 32 bytes – Each Process waiting for lock – 32 bytes

Agenda • • • Locking Query Processor Query Tuning System Configuration Performance Monitoring

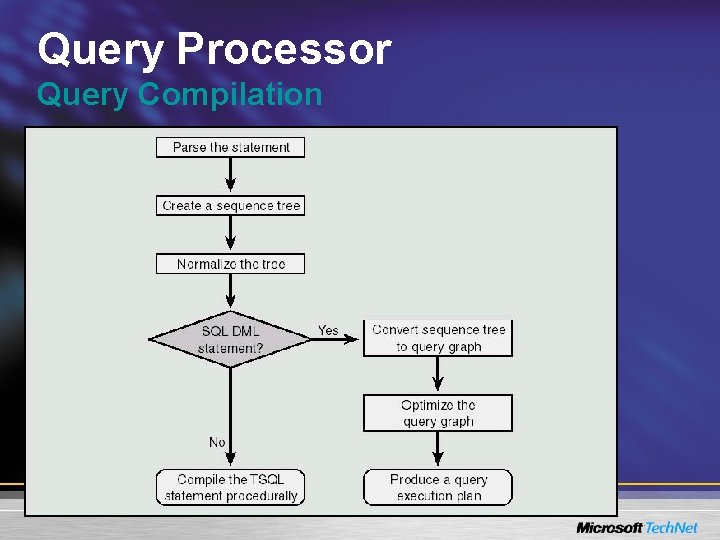
Query Processor Query Compilation

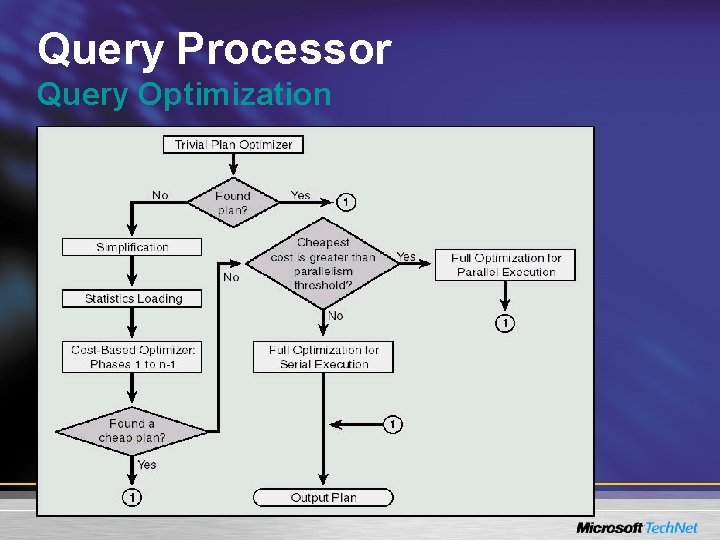
Query Processor Query Optimization

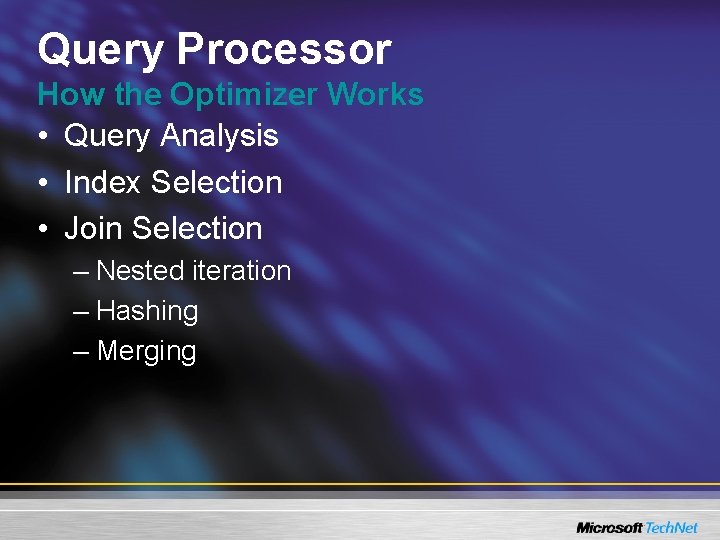
Query Processor How the Optimizer Works • Query Analysis • Index Selection • Join Selection – Nested iteration – Hashing – Merging

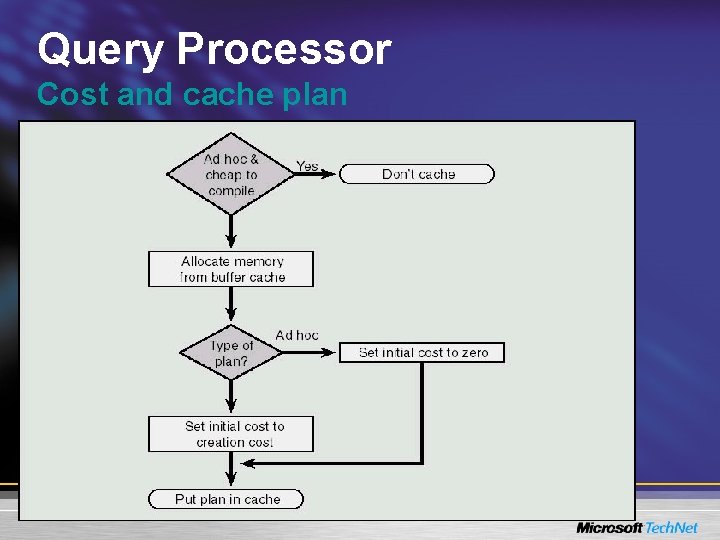
Query Processor Cost and cache plan

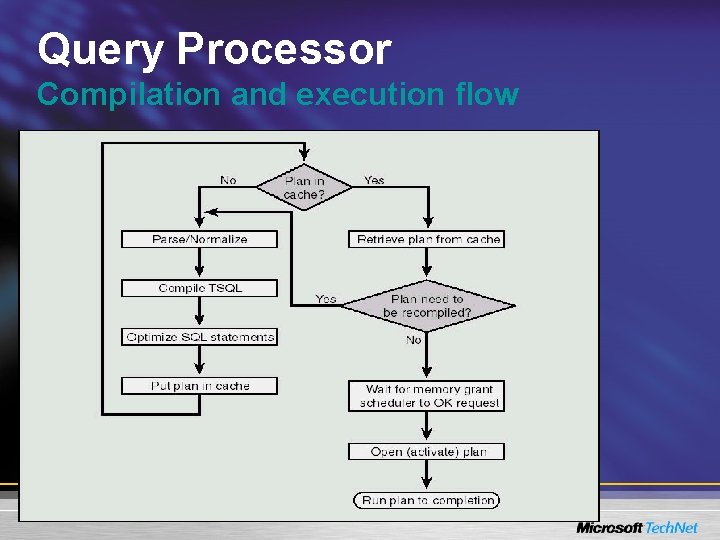
Query Processor Compilation and execution flow

Agenda • • • Locking Query Processor Query Tuning System Configuration Performance Monitoring

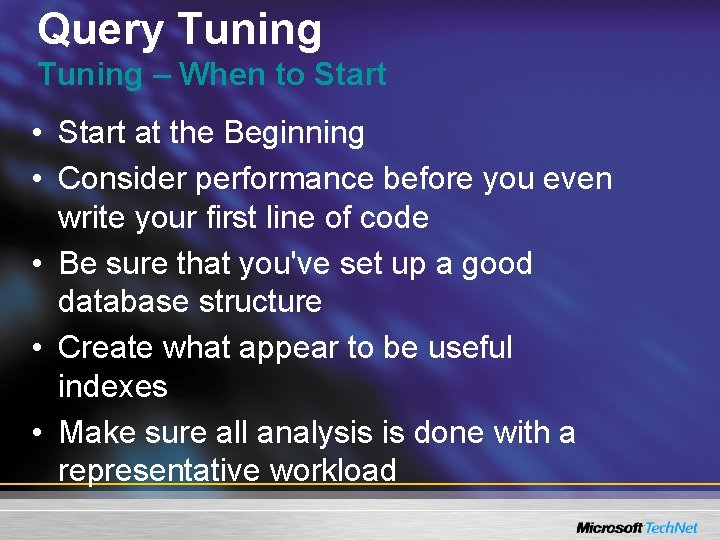
Query Tuning – When to Start • Start at the Beginning • Consider performance before you even write your first line of code • Be sure that you've set up a good database structure • Create what appear to be useful indexes • Make sure all analysis is done with a representative workload

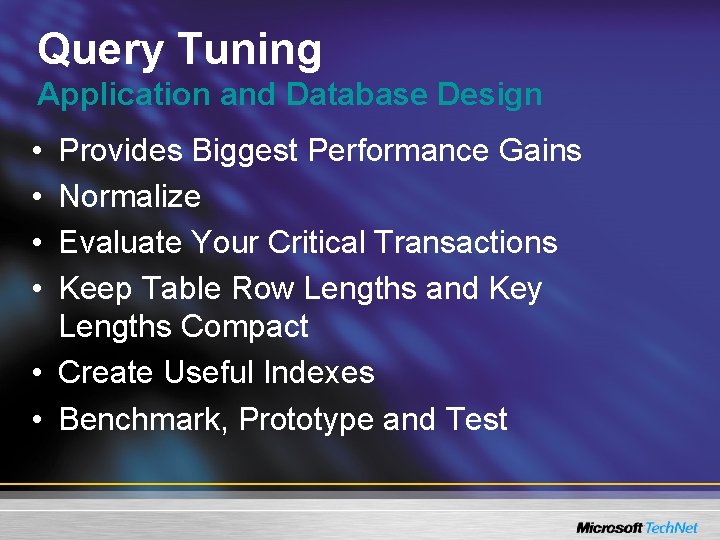
Query Tuning Application and Database Design • • Provides Biggest Performance Gains Normalize Evaluate Your Critical Transactions Keep Table Row Lengths and Key Lengths Compact • Create Useful Indexes • Benchmark, Prototype and Test

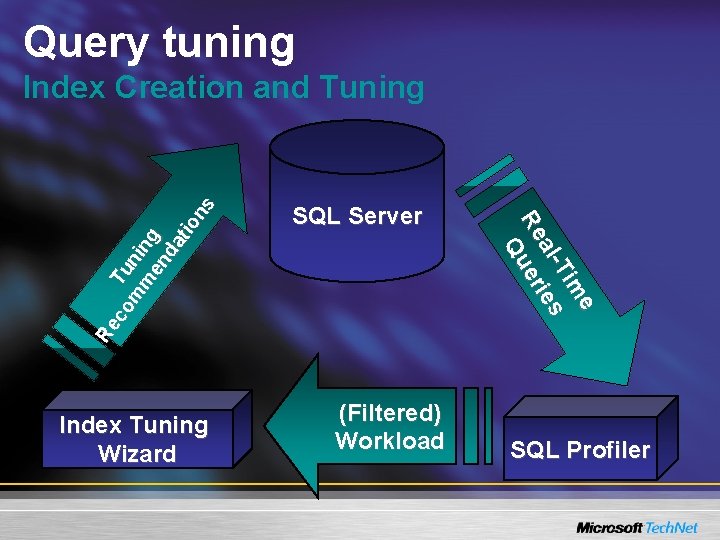
Query tuning Index Tuning Wizard SQL Server (Filtered) Workload e Tim al - ies Re er Qu Re co Tu m nin m en g da tio ns Index Creation and Tuning SQL Profiler

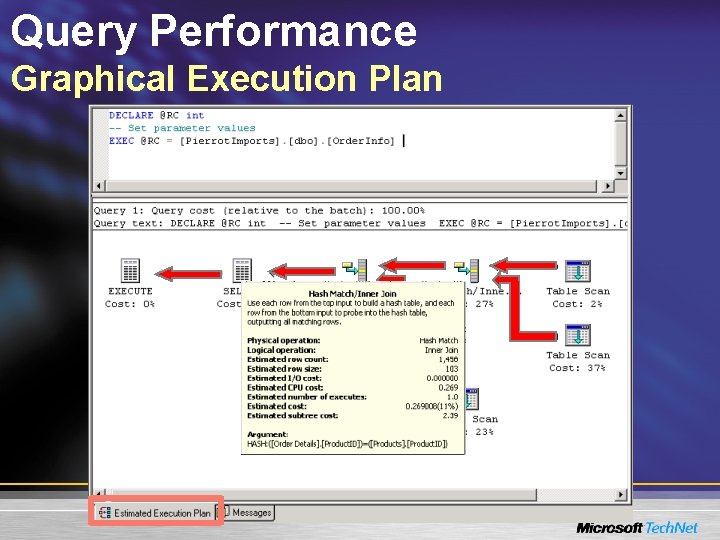
Query Performance Graphical Execution Plan

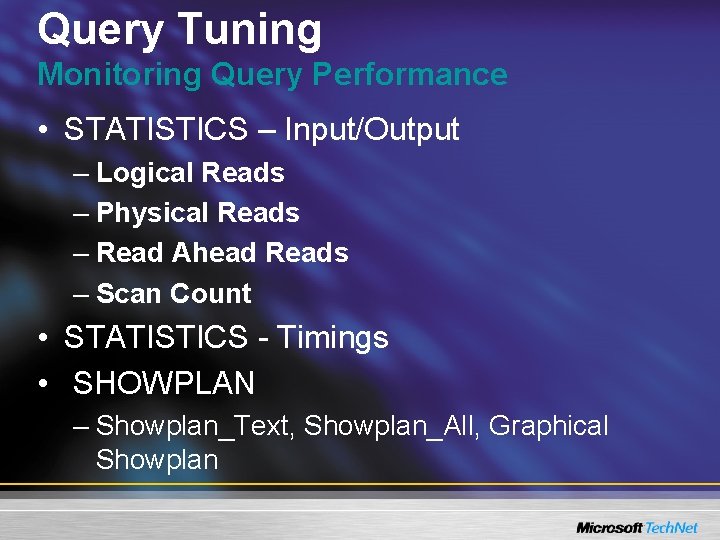
Query Tuning Monitoring Query Performance • STATISTICS – Input/Output – Logical Reads – Physical Reads – Read Ahead Reads – Scan Count • STATISTICS - Timings • SHOWPLAN – Showplan_Text, Showplan_All, Graphical Showplan

Query Tuning Query Hints • Query hints should be used for special cases—not as standard operating procedure • Hint Types: – Join Hints – Index Hints – Lock Hints – Processing Hints

Query Tuning Blocking and Deadlocks – How to Resolve Them • Keep transactions as short as possible • Never add a pause within a transaction for user input • When you process a result set, process all rows as quickly as possible • For browsing applications, consider using cursors with optimistic concurrency control

Query Tuning Deadlocks – How to Resolve Them • To prevent cycle deadlocks, make all processes access resources in a consistent order. • Reduce the transaction isolation level if it's suitable for the application. • To prevent conversion deadlocks, explicitly serialize access to a resource.

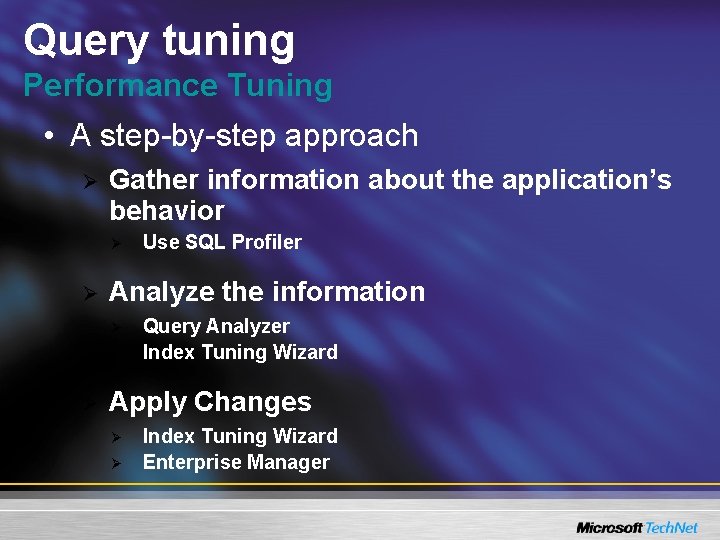
Query tuning Performance Tuning • A step-by-step approach Ø Gather information about the application’s behavior Ø Ø Analyze the information Ø Ø Ø Use SQL Profiler Query Analyzer Index Tuning Wizard Apply Changes Ø Ø Index Tuning Wizard Enterprise Manager

Agenda • • • Locking Query Processor Query Tuning System Configuration Performance Monitoring

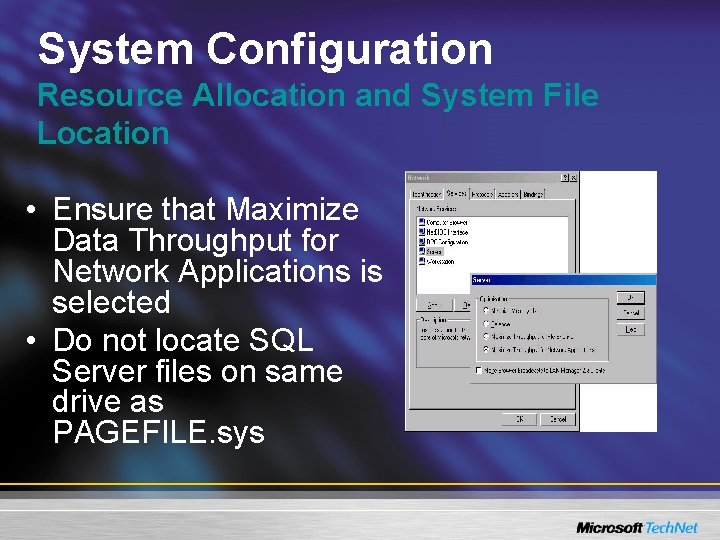
System Configuration Resource Allocation and System File Location • Ensure that Maximize Data Throughput for Network Applications is selected • Do not locate SQL Server files on same drive as PAGEFILE. sys

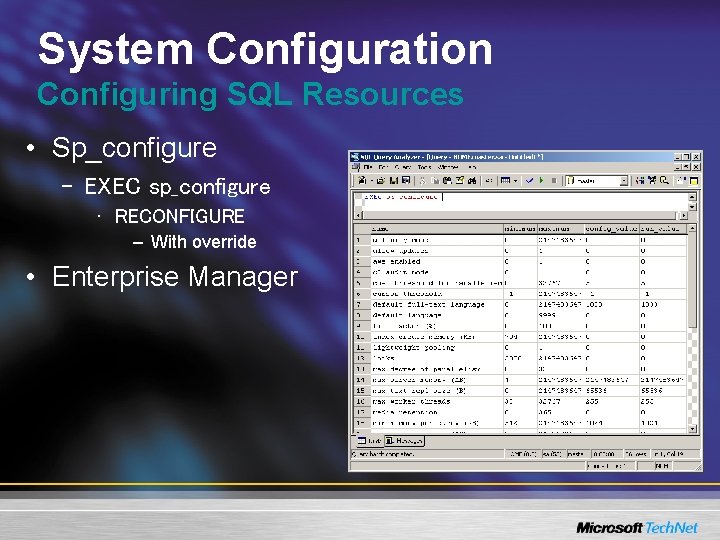
System Configuration Configuring SQL Resources • Sp_configure – EXEC sp_configure • RECONFIGURE – With override • Enterprise Manager

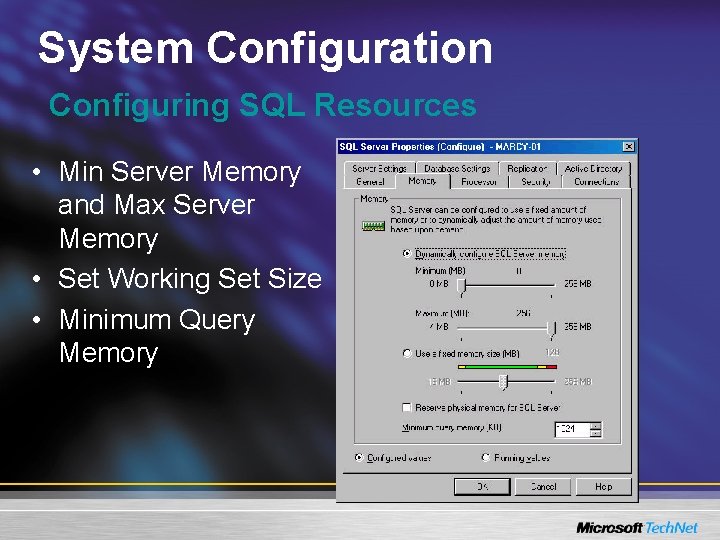
System Configuration Configuring SQL Resources • Min Server Memory and Max Server Memory • Set Working Set Size • Minimum Query Memory

System Configuration Configuring SQL Resources • Scheduling – Lightweight Pooling – Affinity mask – Priority boost – Max Worker Threads • Disk I/O Options

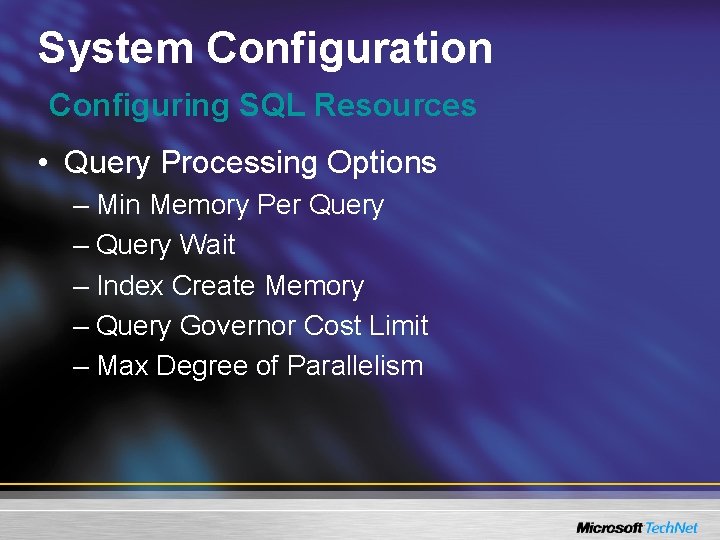
System Configuration Configuring SQL Resources • Query Processing Options – Min Memory Per Query – Query Wait – Index Create Memory – Query Governor Cost Limit – Max Degree of Parallelism

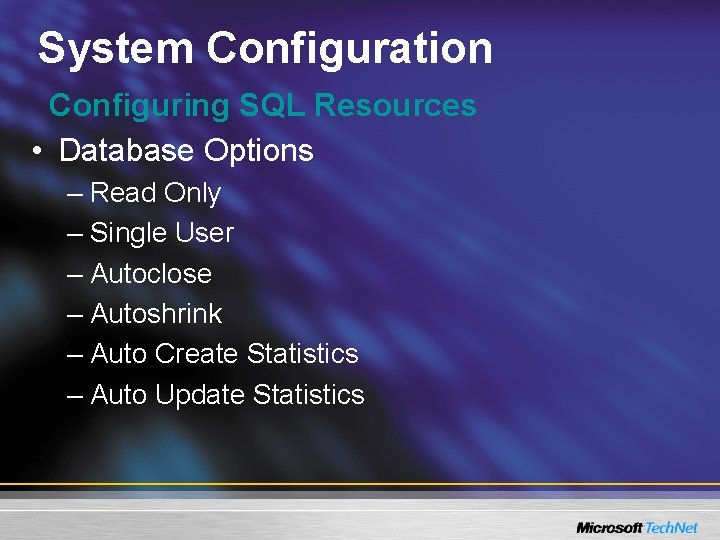
System Configuration Configuring SQL Resources • Database Options – Read Only – Single User – Autoclose – Autoshrink – Auto Create Statistics – Auto Update Statistics

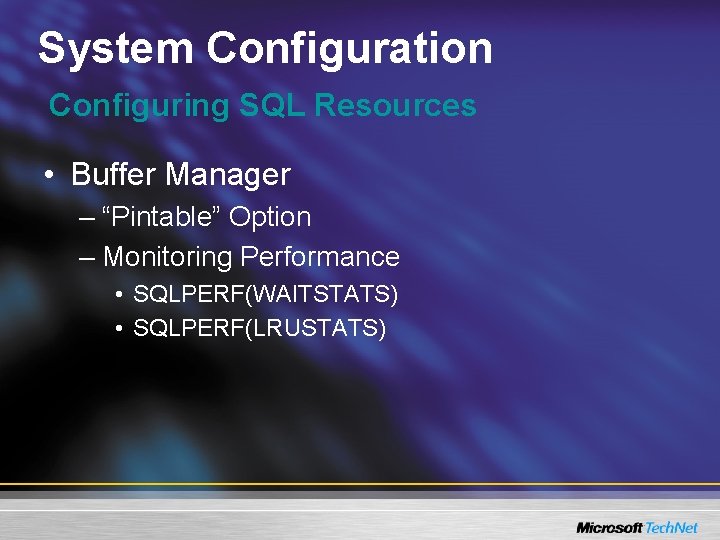
System Configuration Configuring SQL Resources • Buffer Manager – “Pintable” Option – Monitoring Performance • SQLPERF(WAITSTATS) • SQLPERF(LRUSTATS)

Agenda • • • Locking Query Processor Query Tuning System Configuration Performance Monitoring

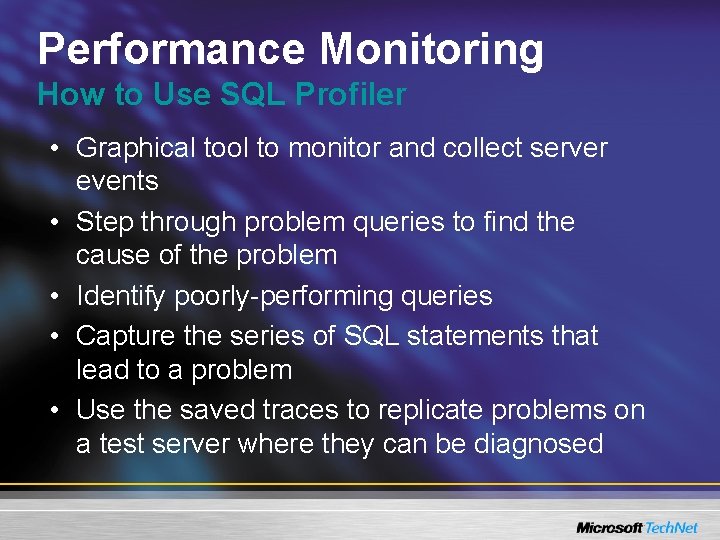
Performance Monitoring How to Use SQL Profiler • Graphical tool to monitor and collect server events • Step through problem queries to find the cause of the problem • Identify poorly-performing queries • Capture the series of SQL statements that lead to a problem • Use the saved traces to replicate problems on a test server where they can be diagnosed

Performance Monitoring How to Use SQL Profiler • Debug T-SQL or stored procedures • Monitor the performance of SQL Server to tune workloads • Capture deadlocking scenarios • Playback events captured

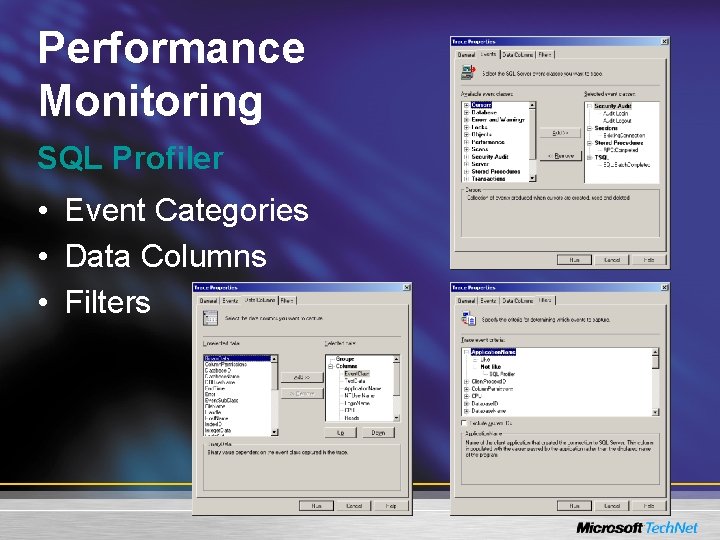
Performance Monitoring SQL Profiler • Event Categories • Data Columns • Filters

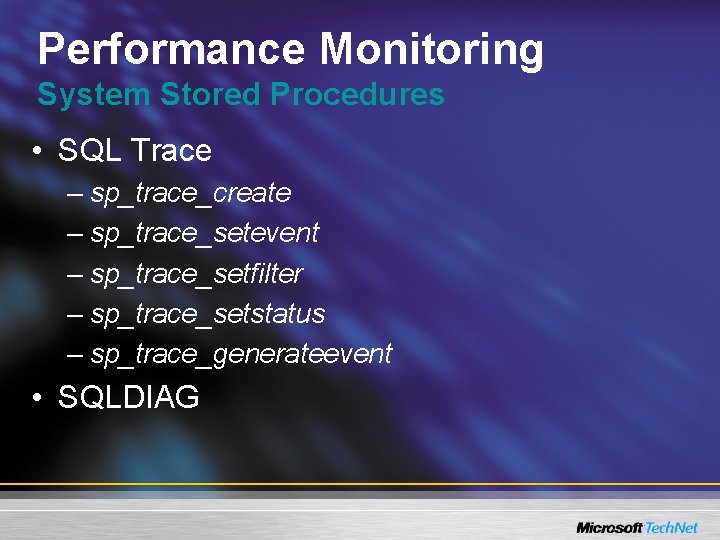
Performance Monitoring System Stored Procedures • SQL Trace – sp_trace_create – sp_trace_setevent – sp_trace_setfilter – sp_trace_setstatus – sp_trace_generateevent • SQLDIAG

Performance Monitoring Using System Monitor • Monitors Entire System Performance • System Counters • SQL Counters

Performance Monitoring System Monitor • View data simultaneously from any number of computers • View and change charts to reflect current activity, and show counter values that are updated at a user-defined frequency • Export data from charts, logs, alert logs, and reports to spreadsheet or database applications for further manipulation and printing • Add system alerts that list an event in the alert log and can notify you by reverting to the Alert view or issuing a network alert

Performance Monitoring System Monitor • Run a predefined application the first time or every time a counter value goes over or under a user-defined value • Create log files that contain data about various objects from different computers • Append to one file selected sections from other existing log files to form a long-term archive • View current-activity reports, or create reports from existing log files • Save individual chart, alert, log, or report settings, or the entire workspace setup for reuse when needed

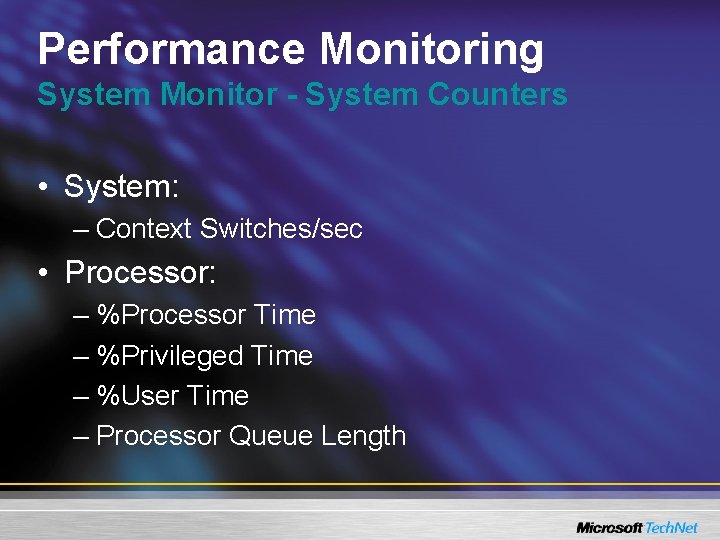
Performance Monitoring System Monitor - System Counters • System: – Context Switches/sec • Processor: – %Processor Time – %Privileged Time – %User Time – Processor Queue Length

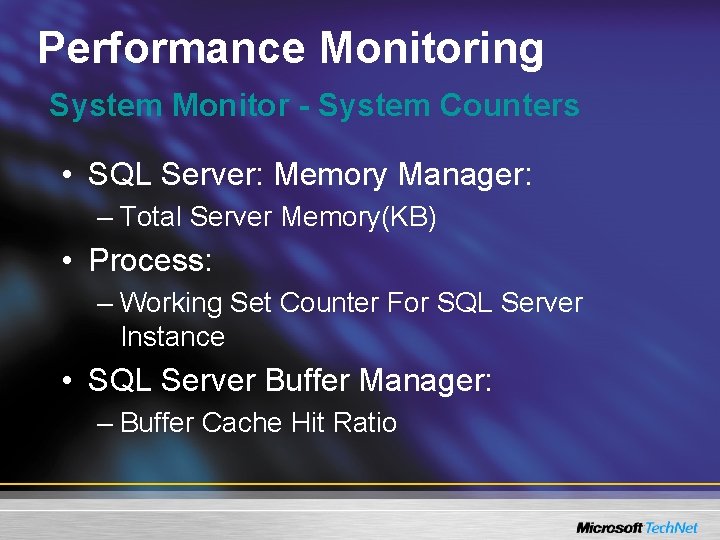
Performance Monitoring System Monitor - System Counters • SQL Server: Memory Manager: – Total Server Memory(KB) • Process: – Working Set Counter For SQL Server Instance • SQL Server Buffer Manager: – Buffer Cache Hit Ratio

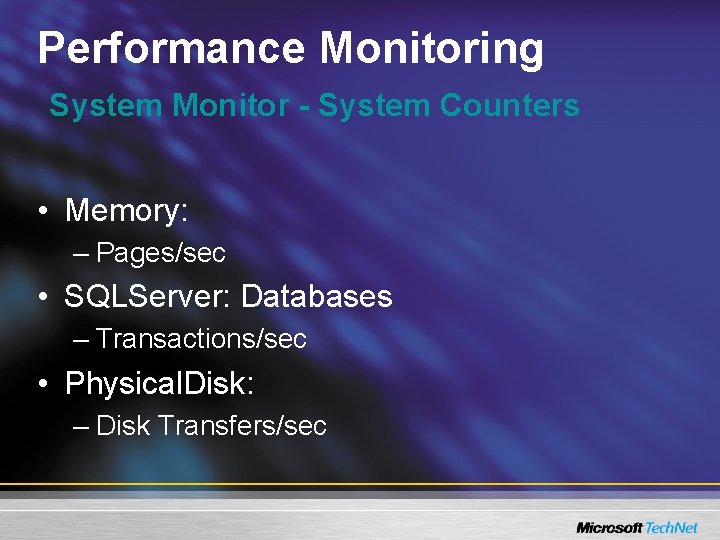
Performance Monitoring System Monitor - System Counters • Memory: – Pages/sec • SQLServer: Databases – Transactions/sec • Physical. Disk: – Disk Transfers/sec

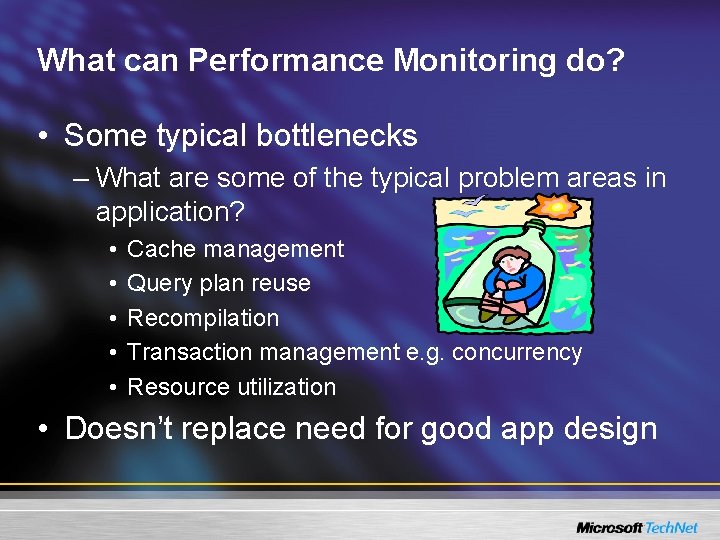
What can Performance Monitoring do? • Some typical bottlenecks – What are some of the typical problem areas in application? • • • Cache management Query plan reuse Recompilation Transaction management e. g. concurrency Resource utilization • Doesn’t replace need for good app design

Waits & Queues • Complementary information – Together, explains app performance – Most are familiar with queues ( ½ the story) – Both are essential for problem determination • Queues – Perfmon counters - measure resource utilization – Queues indicate unfulfilled resource requests • SQL Waits – Waits from an Application or User connection perspective

Waits • SQL waits – Application sends SQL queries • SQL Server in turn issues resource requests – Translates to subsystem IO, memory, CPU – E. g. acquire locks, read | write data pages, sorts • 50+ wait types for SQL 2000 • Anytime a user connection waits for results, SQL sets a wait type

Queues • PERFMON counters provide a view of system performance from a resource standpoint • Queues measure resource utilization – Requests that cannot be immediately provided are queued – Key Perfmon counters • Physical Disk (IO) • SQL Buffer Cache • CPU

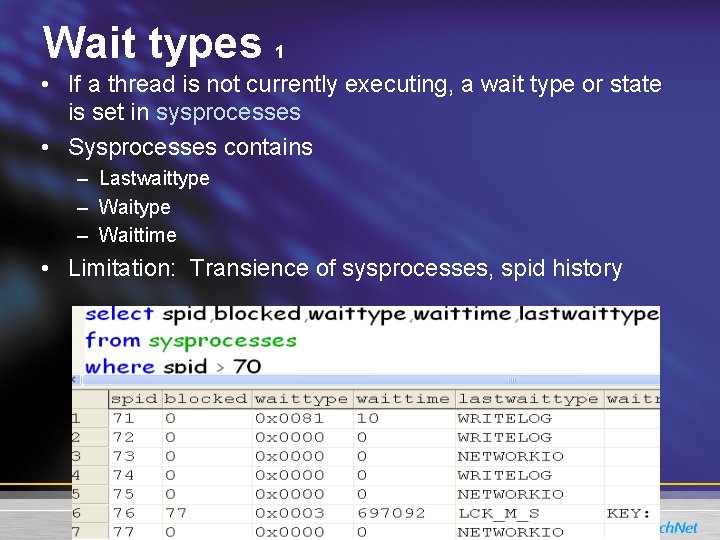
Wait types 1 • If a thread is not currently executing, a wait type or state is set in sysprocesses • Sysprocesses contains – Lastwaittype – Waittime • Limitation: Transience of sysprocesses, spid history
![Wait types 2 DBCC sqlperfwaitstats clear Cumulative waittypes waittimes Limitation Wait types 2 • DBCC sqlperf(waitstats, [clear]) – Cumulative waittypes & waittimes – Limitation:](https://slidetodoc.com/presentation_image_h2/e716428b158d68ece1947e998545544a/image-57.jpg)
Wait types 2 • DBCC sqlperf(waitstats, [clear]) – Cumulative waittypes & waittimes – Limitation: relevance types, what you can control?

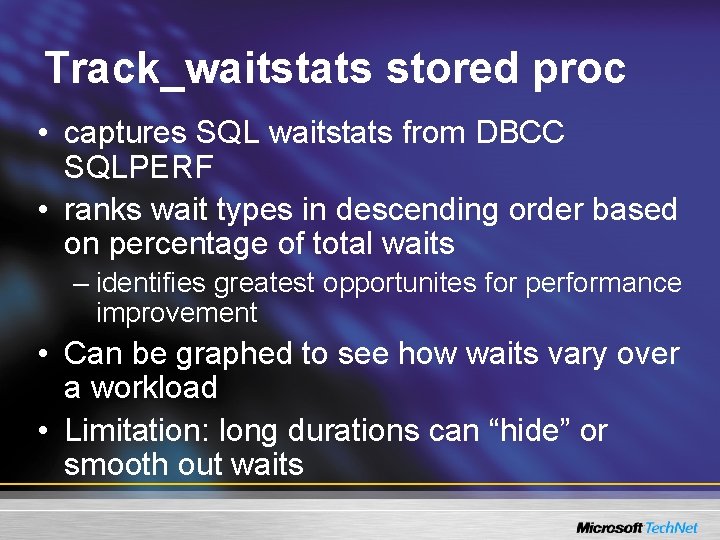
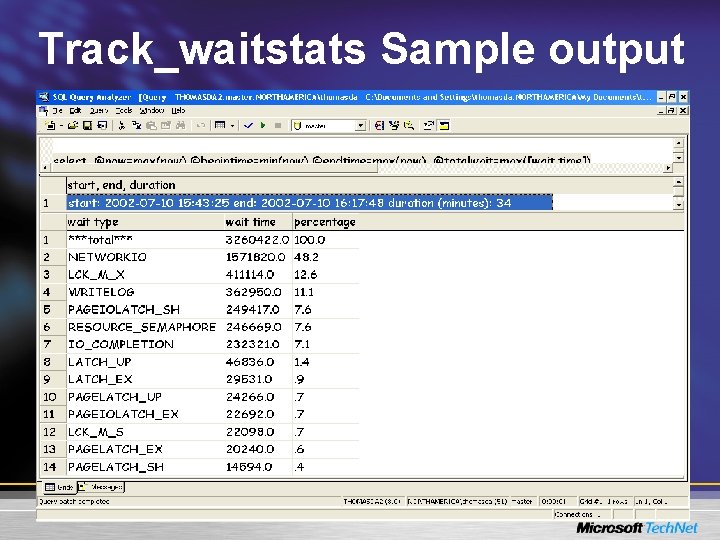
Track_waitstats stored proc • captures SQL waitstats from DBCC SQLPERF • ranks wait types in descending order based on percentage of total waits – identifies greatest opportunites for performance improvement • Can be graphed to see how waits vary over a workload • Limitation: long durations can “hide” or smooth out waits

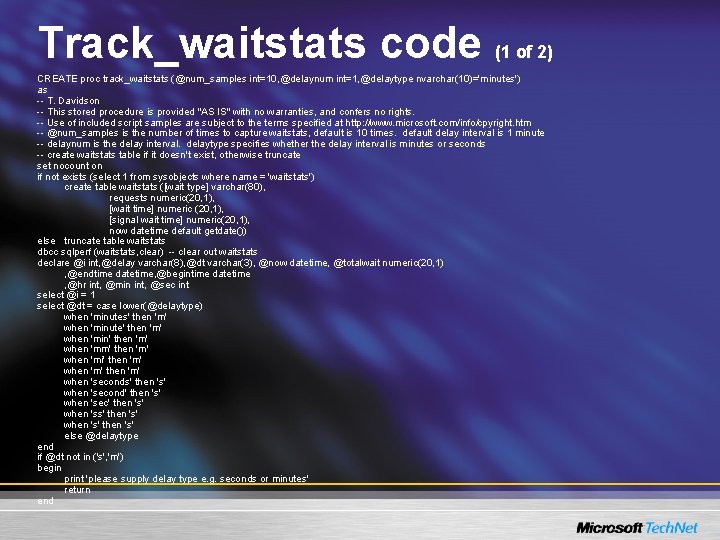
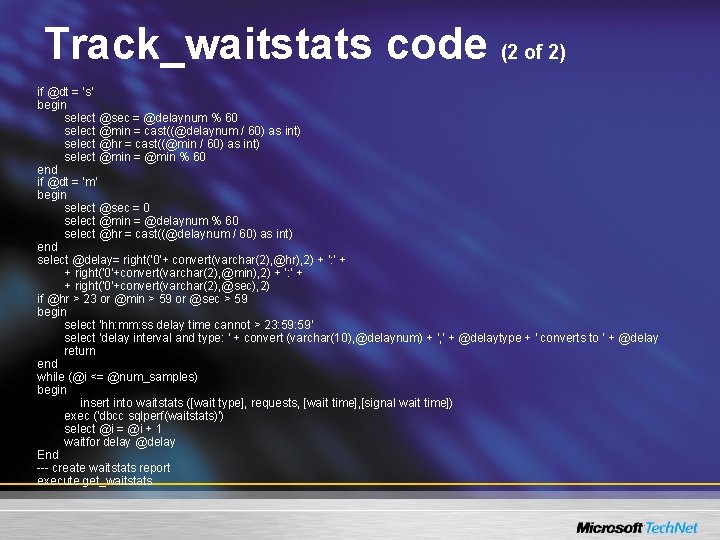
Track_waitstats code (1 of 2) CREATE proc track_waitstats (@num_samples int=10, @delaynum int=1, @delaytype nvarchar(10)='minutes') as -- T. Davidson -- This stored procedure is provided "AS IS" with no warranties, and confers no rights. -- Use of included script samples are subject to the terms specified at http: //www. microsoft. com/info/cpyright. htm -- @num_samples is the number of times to capture waitstats, default is 10 times. default delay interval is 1 minute -- delaynum is the delay interval. delaytype specifies whether the delay interval is minutes or seconds -- create waitstats table if it doesn't exist, otherwise truncate set nocount on if not exists (select 1 from sysobjects where name = 'waitstats') create table waitstats ([wait type] varchar(80), requests numeric(20, 1), [wait time] numeric (20, 1), [signal wait time] numeric(20, 1), now datetime default getdate()) else truncate table waitstats dbcc sqlperf (waitstats, clear) -- clear out waitstats declare @i int, @delay varchar(8), @dt varchar(3), @now datetime, @totalwait numeric(20, 1) , @endtime datetime, @begintime datetime , @hr int, @min int, @sec int select @i = 1 select @dt = case lower(@delaytype) when 'minutes' then 'm' when 'minute' then 'm' when 'min' then 'm' when 'mm' then 'm' when 'mi' then 'm' when 'm' then 'm' when 'seconds' then 's' when 'second' then 's' when 'sec' then 's' when 'ss' then 's' when 's' then 's' else @delaytype end if @dt not in ('s', 'm') begin print 'please supply delay type e. g. seconds or minutes' return end

Track_waitstats code (2 of 2) if @dt = 's' begin select @sec = @delaynum % 60 select @min = cast((@delaynum / 60) as int) select @hr = cast((@min / 60) as int) select @min = @min % 60 end if @dt = 'm' begin select @sec = 0 select @min = @delaynum % 60 select @hr = cast((@delaynum / 60) as int) end select @delay= right('0'+ convert(varchar(2), @hr), 2) + ': ' + + right('0'+convert(varchar(2), @min), 2) + ': ' + + right('0'+convert(varchar(2), @sec), 2) if @hr > 23 or @min > 59 or @sec > 59 begin select 'hh: mm: ss delay time cannot > 23: 59' select 'delay interval and type: ' + convert (varchar(10), @delaynum) + ', ' + @delaytype + ' converts to ' + @delay return end while (@i <= @num_samples) begin insert into waitstats ([wait type], requests, [wait time], [signal wait time]) exec ('dbcc sqlperf(waitstats)') select @i = @i + 1 waitfor delay @delay End --- create waitstats report execute get_waitstats

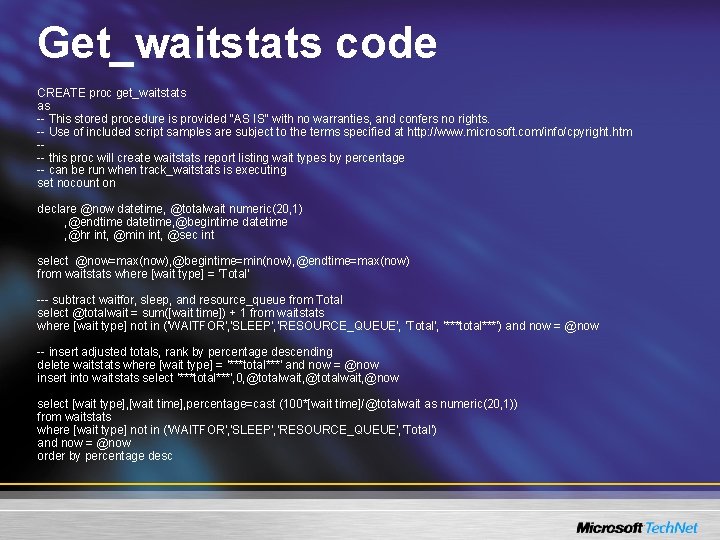
Get_waitstats code CREATE proc get_waitstats as -- This stored procedure is provided "AS IS" with no warranties, and confers no rights. -- Use of included script samples are subject to the terms specified at http: //www. microsoft. com/info/cpyright. htm --- this proc will create waitstats report listing wait types by percentage -- can be run when track_waitstats is executing set nocount on declare @now datetime, @totalwait numeric(20, 1) , @endtime datetime, @begintime datetime , @hr int, @min int, @sec int select @now=max(now), @begintime=min(now), @endtime=max(now) from waitstats where [wait type] = 'Total' --- subtract waitfor, sleep, and resource_queue from Total select @totalwait = sum([wait time]) + 1 from waitstats where [wait type] not in ('WAITFOR', 'SLEEP', 'RESOURCE_QUEUE', 'Total', '***total***') and now = @now -- insert adjusted totals, rank by percentage descending delete waitstats where [wait type] = '***total***' and now = @now insert into waitstats select '***total***', 0, @totalwait, @now select [wait type], [wait time], percentage=cast (100*[wait time]/@totalwait as numeric(20, 1)) from waitstats where [wait type] not in ('WAITFOR', 'SLEEP', 'RESOURCE_QUEUE', 'Total') and now = @now order by percentage desc

Track_waitstats Sample output

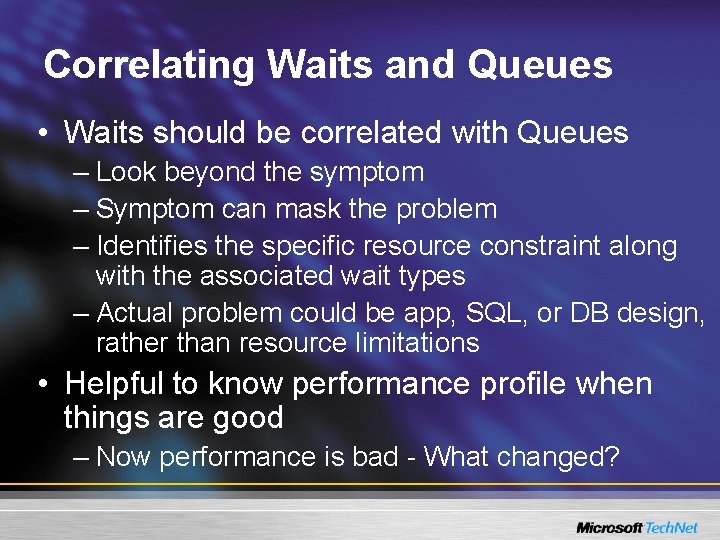
Correlating Waits and Queues • Waits should be correlated with Queues – Look beyond the symptom – Symptom can mask the problem – Identifies the specific resource constraint along with the associated wait types – Actual problem could be app, SQL, or DB design, rather than resource limitations • Helpful to know performance profile when things are good – Now performance is bad - What changed?

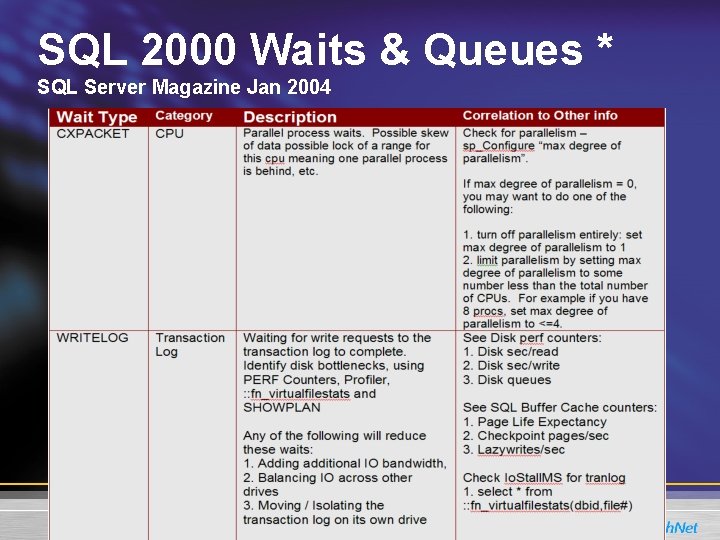
SQL 2000 Waits & Queues * SQL Server Magazine Jan 2004

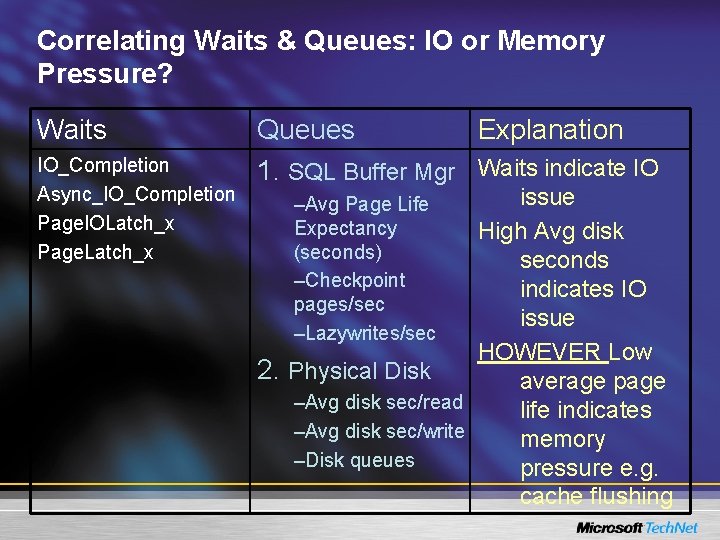
Correlating Waits & Queues: IO or Memory Pressure? Waits IO_Completion Async_IO_Completion Page. IOLatch_x Page. Latch_x Queues Explanation 1. SQL Buffer Mgr Waits indicate IO issue High Avg disk seconds indicates IO issue HOWEVER Low 2. Physical Disk average page –Avg disk sec/read life indicates –Avg disk sec/write memory –Disk queues pressure e. g. cache flushing –Avg Page Life Expectancy (seconds) –Checkpoint pages/sec –Lazywrites/sec

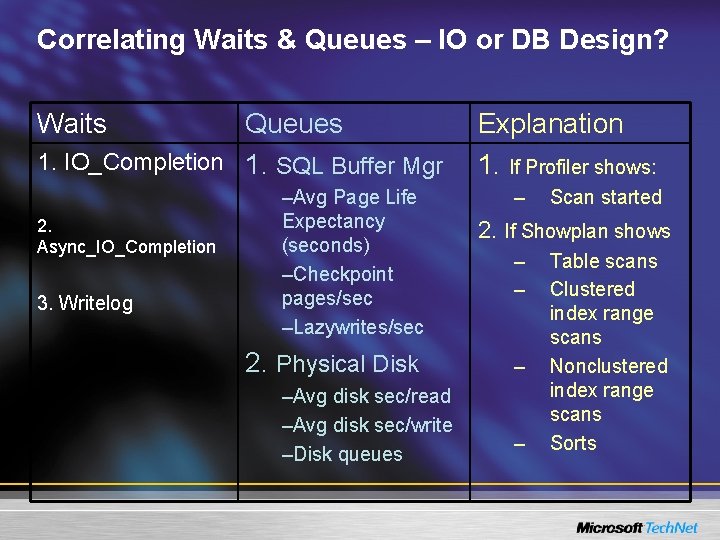
Correlating Waits & Queues – IO or DB Design? Waits Queues 1. IO_Completion 1. SQL Buffer Mgr 2. Async_IO_Completion 3. Writelog –Avg Page Life Expectancy (seconds) –Checkpoint pages/sec –Lazywrites/sec 2. Physical Disk –Avg disk sec/read –Avg disk sec/write –Disk queues Explanation 1. If Profiler shows: – Scan started 2. If Showplan shows – – Table scans Clustered index range scans Nonclustered index range scans Sorts

Other sources of information • Virtual tables • Undocumented DBCC options

File Statistics • Dbcc showfilestats • Select Number. Reads, Number. Writes, Bytes. Read, Bytes. Written, Io. Stall. MS from : : fn_virtualfilestats
![Virtual System Tables Fnvirtualfilestats dbid file Id 1 Provides Virtual System Tables • : : Fn_virtualfilestats (dbid, [file. Id | -1]) – Provides](https://slidetodoc.com/presentation_image_h2/e716428b158d68ece1947e998545544a/image-69.jpg)
Virtual System Tables • : : Fn_virtualfilestats (dbid, [file. Id | -1]) – Provides breakdown of IO by file – Look for Iostall. MS – compare to Physical Disk reads/writes • Indentifies SQL component of IO • Syscacheobjects – Contains compiled objects e. g. query plans • Sysprocesses – Contains each SQL thread & wait types • Syslocks

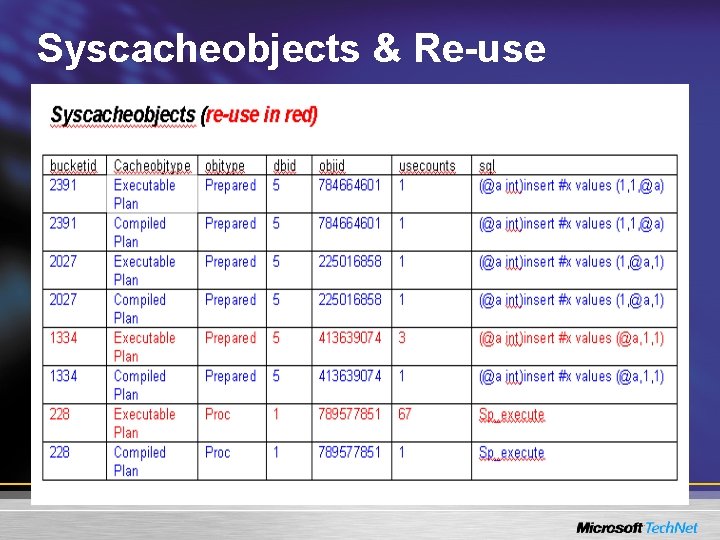
Stored procedures • Query plans are in syscacheobjects – Execution plan (N) • User context, variable values, etc. – Compiled plan (1) • Access strategy - single serial or parallel compiled plan • Sp_procinfo – Displays stored proc info • • Parameters Plan re-use (usecounts) Startup Owner

Real memory issues • 32 -bit SQL Server – Virtual memory is limited to 2 GB unless using /3 GB, then it’s 3 GB • sorting, query plans, user connections, locks, utility buffers compete for virtual memory • Thrashing (or memory pressure) in real memory means discarding plans & small sorts – Affects index creation, joins, repeated optimization – AWE (virtual memory above real) • Data and index pages • AWE map/unmap to access pages in virtual memory • 64 -bit SQL Server – Flat memory model so no limits to proc cache, no AWE memory mapping

What is in memory? • Dbcc memobjlist (lists objects in real memory) • Dbcc memorystatus

Syscacheobjects & Re-use

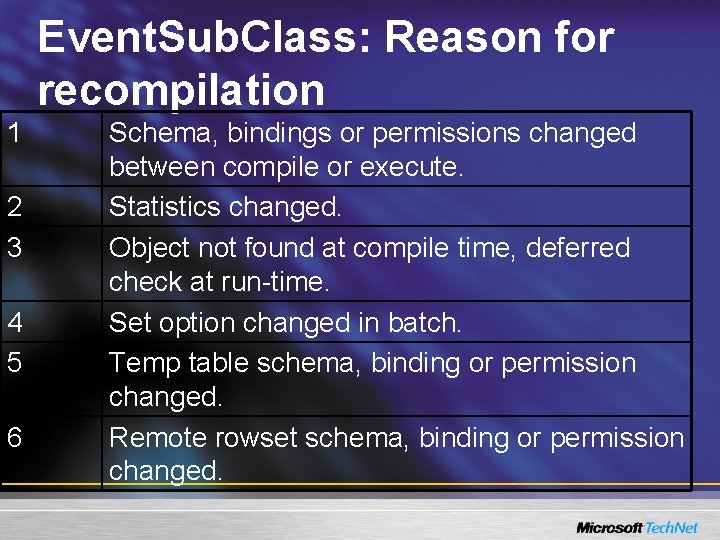
Event. Sub. Class: Reason for recompilation 1 2 3 4 5 6 Schema, bindings or permissions changed between compile or execute. Statistics changed. Object not found at compile time, deferred check at run-time. Set option changed in batch. Temp table schema, binding or permission changed. Remote rowset schema, binding or permission changed.

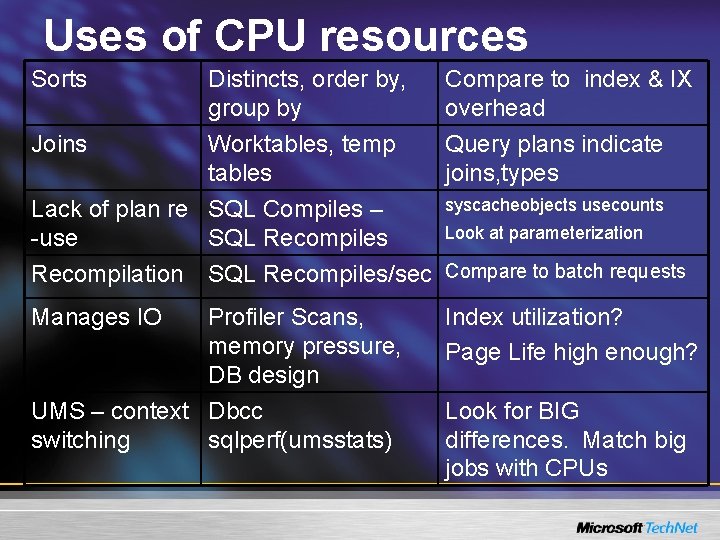
Uses of CPU resources Sorts Joins Distincts, order by, group by Worktables, temp tables Lack of plan re SQL Compiles – -use SQL Recompiles Compare to index & IX overhead Query plans indicate joins, types syscacheobjects usecounts Look at parameterization Recompilation SQL Recompiles/sec Compare to batch requests Manages IO Profiler Scans, memory pressure, DB design UMS – context Dbcc switching sqlperf(umsstats) Index utilization? Page Life high enough? Look for BIG differences. Match big jobs with CPUs

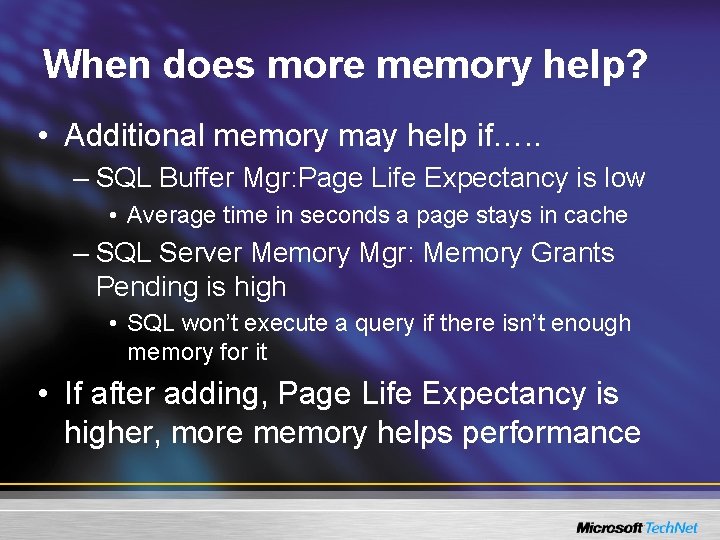
When does more memory help? • Additional memory may help if…. . – SQL Buffer Mgr: Page Life Expectancy is low • Average time in seconds a page stays in cache – SQL Server Memory Mgr: Memory Grants Pending is high • SQL won’t execute a query if there isn’t enough memory for it • If after adding, Page Life Expectancy is higher, more memory helps performance

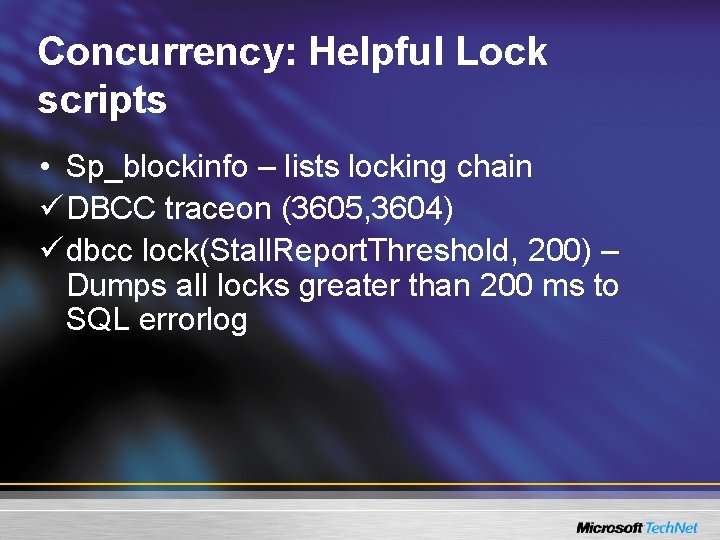
Concurrency: Helpful Lock scripts • Sp_blockinfo – lists locking chain ü DBCC traceon (3605, 3604) ü dbcc lock(Stall. Report. Threshold, 200) – Dumps all locks greater than 200 ms to SQL errorlog

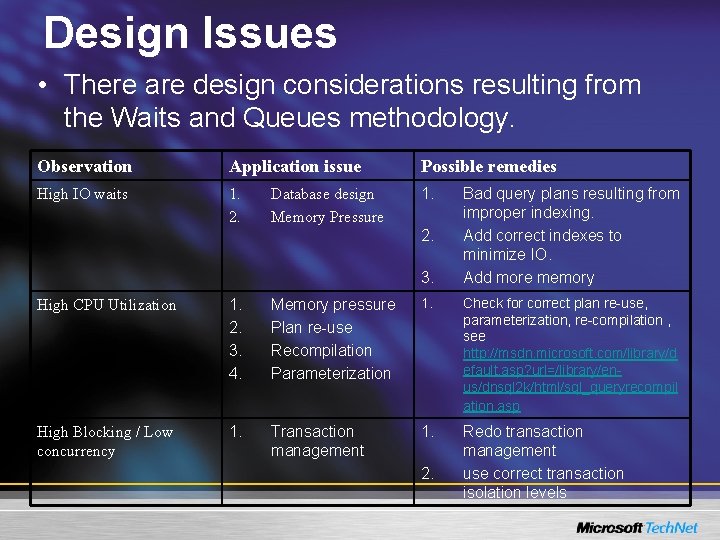
Design Issues • There are design considerations resulting from the Waits and Queues methodology. Observation Application issue Possible remedies High IO waits 1. 2. 1. Database design Memory Pressure 2. 3. Bad query plans resulting from improper indexing. Add correct indexes to minimize IO. Add more memory High CPU Utilization 1. 2. 3. 4. Memory pressure Plan re-use Recompilation Parameterization 1. Check for correct plan re-use, parameterization, re-compilation , see http: //msdn. microsoft. com/library/d efault. asp? url=/library/enus/dnsql 2 k/html/sql_queryrecompil ation. asp High Blocking / Low concurrency 1. Transaction management 1. Redo transaction management use correct transaction isolation levels 2.

Summation • Application performance all about waits and queues – Workloads may vary, shifting waits & queues • System performance is all about identifying (& resolving) bottlenecks, maximizing system capabilities – Figure out the problem, if it ain’t broke….

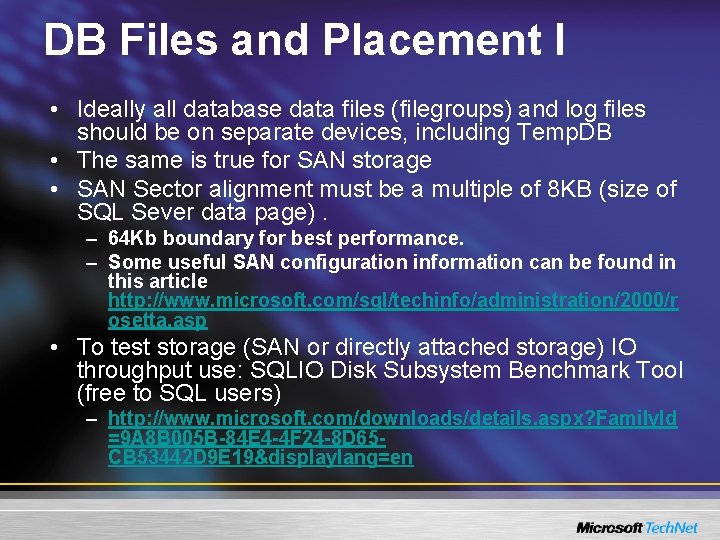
DB Files and Placement I • Ideally all database data files (filegroups) and log files should be on separate devices, including Temp. DB • The same is true for SAN storage • SAN Sector alignment must be a multiple of 8 KB (size of SQL Sever data page). – 64 Kb boundary for best performance. – Some useful SAN configuration information can be found in this article http: //www. microsoft. com/sql/techinfo/administration/2000/r osetta. asp • To test storage (SAN or directly attached storage) IO throughput use: SQLIO Disk Subsystem Benchmark Tool (free to SQL users) – http: //www. microsoft. com/downloads/details. aspx? Family. Id =9 A 8 B 005 B-84 E 4 -4 F 24 -8 D 65 CB 53442 D 9 E 19&displaylang=en

DB Files and Placement II From Books Online: As data is written to the filegroup, Microsoft® SQL Server™ writes an amount proportional to the free space in the file to each file within the filegroup, rather than writing all the data to the first file until full and then writing to the next file. As soon as all the files in a filegroup are full, SQL Server automatically expands one file at a time in a round-robin fashion to accommodate more data (provided that the database is set to grow automatically). • For maximum IO throughput there should be as many data files as there are processors • Start off with a sufficient number of files (minimum 3). Avoid adding files at a later time • Avoid automatic growth of data files so as not to lose proportional fill • Keep all files at the same size

Performance Monitoring • • • SQL Server has hundreds of counters that can be monitored and recorded using Performance (System) Monitor. This requires no additional, specialised or third party software. SAP will use some of these counters for its own reports. SELECT * FROM : : fn_virtualfilestats(-1, -1) – Io. Stall. MS / Number. Reads < 5 ms good, <10 ms fair, < 20 ms poor – More information on this command from: Miscellaneous SQL Server Performance Tuning Tips http: //www. sql-server-performance. com/misc_tips. asp • dbcc sqlperf (waitstats) – WRITELOG (Wait time / requests) < 5 ms good, <10 ms fair – PAGEIOLATCH_SH (Wait time / requests) < 15 ms good • Windows perfmance counters – Disk queue length – can be very misleading on SAN equipment where a permanently high figure may be reported without any performance issue. – Average disk transfer times – For SQL Server counters and other useful Windows counters see Microsoft SQL Server 2000 RDBMS Performance Tuning Guide for Data Warehousing http: //www. microsoft. com/technet/prodtechnol/sql/2000/maintain/rdbms pft. mspx

Performance Monitoring • DBCC INDEXDEFRAG – An online operation for index defragmenting. Effects of fragmentation are minimal on a SAN with lots of spindles. Microsoft SQL Server 2000 RDBMS Performance Tuning Guide for Data Warehousing http: //www. microsoft. com/technet/prodtechnol/sql/2000/maintain/rdbmspft. mspx HOW TO: Troubleshoot Application Performance with SQL Server http: //support. microsoft. com/? id=224587

Performance Monitoring Distribution Statistics Books Online - Distribution Statistics : All indexes have distribution statistics that describe the selectivity and distribution of the key values in the index. The distribution statistics are used to estimate how efficient an index would be in retrieving data associated with a key value or range specified in the query. Distribution statistics may also be maintained for unindexed columns. These can be defined manually using the CREATE STATISTICS statement or created automatically by the query optimizer. Caution SELECT statements may, from time to time, cause the automatic update of statistics, depending on how much a table has changed since the statistics were last updated. This will have the effect of making the statement take a lot longer to return for no readily apparent reason. Whilst the automatic update of statistics can be disabled this shouldn’t be necessary except in the most extreme situations. Were this deemed necessary statistics would need to be updated as part of a scheduled process.

Demonstration

Conclusions • • SQL Server 2000 is a high performance enterprise class database. Performance Monitoring is a tool that should be used throughout the application life cycle – Identify bottlenecks in • • • – application database resource utilization Exploit all resources • • CPU I/O Network Data (concurrency vs. consistency)

References • • “Inside SQL Server 2000” by Kalen Delaney “SQL Server 2000 Performance Tuning” by Whalen, Garcia, De. Luca, Thompson “SQL Server 2000 Recompilation” at http: //msdn. microsoft. com “SQL Server 2000 Performance Tuning with Waits & Queues” SQL Magazine (January 2004)

For More Information • • “Inside SQL Server 2000”, Microsoft Press, 2000. , or: http: //mspress. microsoft. com/books/4297. htm “Microsoft® SQL Server™ 2000 Resource Kit”, http: //www. mspress. microsoft. com/PROD/BOOKS/4939. HTM “Microsoft® SQL Server™ 2000 Reference Library “, http: //mspress. microsoft. com/prod/books/5001. htm “Microsoft® SQL Server™ 2000 Administrator's Companion”, http: //mspress. microsoft. com/books/4519. htm “Microsoft® Back. Office® 4. 5 Resource Kit ”, Microsoft Press, 1999, or: http: //mspress. microsoft. com/prod/books/2483. htm Refer to the Tech. Net website at www. microsoft. com/technet/ IT Professionals User Groups in your area – www. microsoft. com/technet/usergroup/default. asp

Training Resources for ITProfessionals • Administering a Microsoft SQL Server 2000 Database – Course # 2072—Five days—Instructor-led – Available: through MS CTECs in your area • Querying Microsoft SQL Server 2000 with Transact-SQL – Course # 2071—Two days—Instructor-led or e. Learning – Available: through MS CTECs in your area

Where Can I Get Tech. Net? • Visit Tech. Net Online at www. microsoft. com/technet • Register for the Tech. Net Flash www. microsoft. com/technet/register/flash. asp • Join the Tech. Net Online forum at www. microsoft. com/technet/discuss • Become an Tech. Net Subscriber at technetbuynow. one. microsoft. com • Attend More Tech. Net Events

Become A Microsoft Certified Systems Engineer • What Is MCSE? – Premier certification for professionals who analyze the business requirements and design and implement the infrastructure for business solutions based on the Microsoft server software. • How do I become a Windows 2000 MCSE? – Pass 4 Core Exams – Pass 1 Design Exam – Pass 2 Electives from a comprehensive list • Where Do I Get More Information? – For more information about certification requirements, exams, and training options, visit www. microsoft. com/mcp
