Microscopes Light microscope Invert Microscope Fluorescence microscope uses


")
")

 Cellvibrio japonicus (credit: J. Narrett)")


 , (Rotational transitions) 1 (Infrared), 10")


")
 Spectrophotometry (Circularly polarized light is needed for it)")
, beta sheet (green) and")

")


- Slides: 23
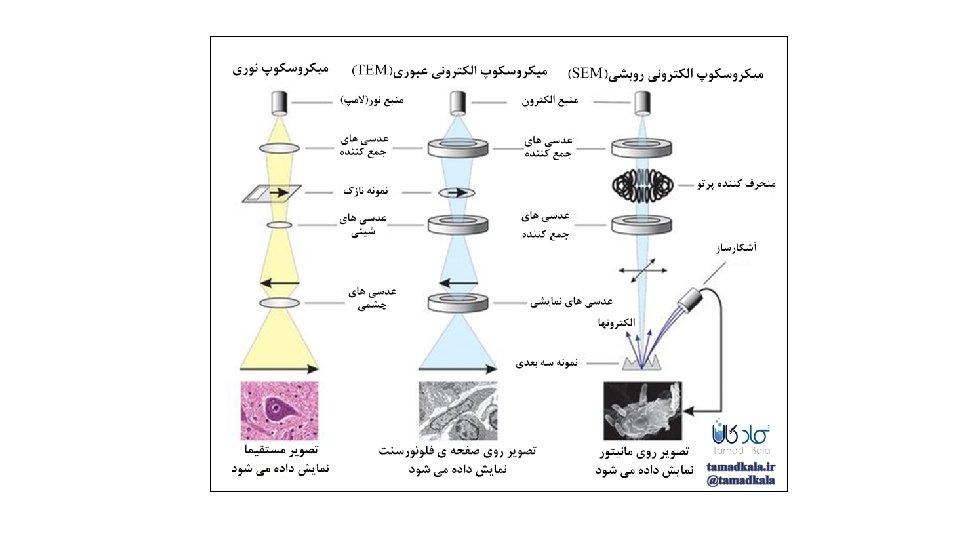
Microscopes
Light microscope ﻣیکﺮﻭﺳکﻮپ ﻣﻌکﻮﺱ Invert Microscope
Fluorescence microscope uses uv as a light source
Electron Microscopy: 1. Scanning Electron Microscopy(SEM)
Transmission Electron Microscope (T. E. M)
SEM TEM
Atomic Force Electron microscope (A. F. M) Cellvibrio japonicus (credit: J. Narrett)
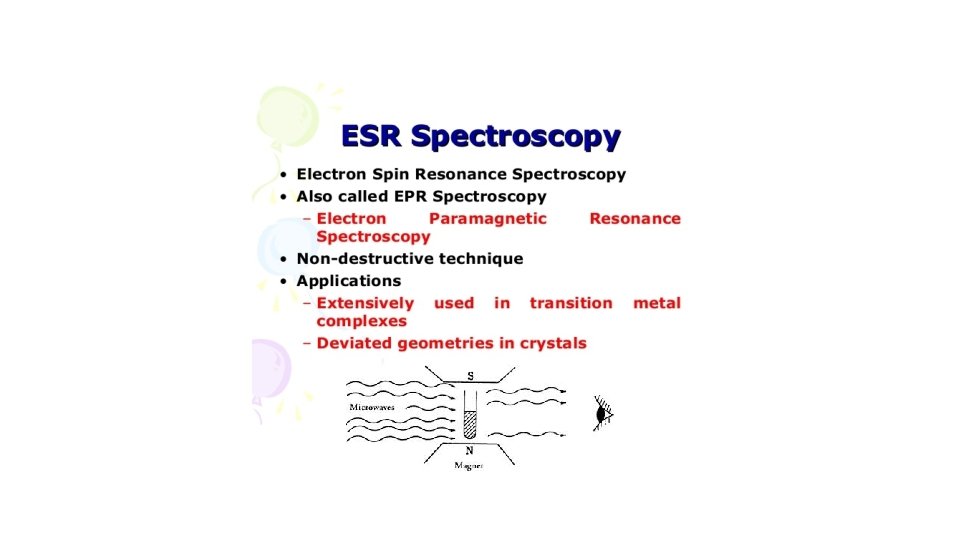
Spectroscopy
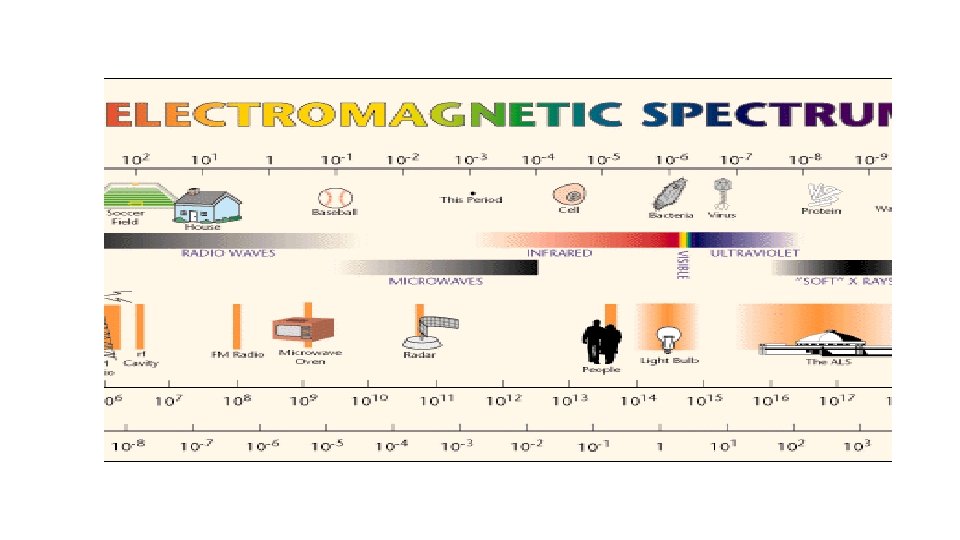
perpendicular to each other Biophysics for Microbiology students Electromagnetic wave is composed of two perpendicular merged magnetic and electric waves E: electrical wave B: Magnetic wave Energy = h × f (h: Plank constant, F = C/ʎ f: frequency) (ʎ: Wave length, C: light rate: 3× 10^8 m) Energy = h. C/ ʎ ʎ , Energy & ʎ , Energy ʎ B
Energy kcal/mol ʎ nm 100, 000 1000 (microwave) , (Rotational transitions) 1 (Infrared), 10 (Visible) 100 10 (UV) (Vibrational transitions) electronic transitions, atom outer shell) (X-Rays) 1000 10, 000 1 “Each energy (ʎ) range Causes special transition and can provide a spectroscopy instrumentation”
Microwave Rotational Spectroscopy Since its inception in 1934, microwave rotational spectroscopy has provided some of the most accurate data for numerous small to medium sized molecules, including structural parameters, force field parameters, and electronic charge distributions. Analyses of the recorded rotational spectra can yield a number of spectroscopic parameters, depending on the molecular symmetry and the various angular momenta present, such as nuclear spins and electronic momenta.
UV-visible Spectroscopy Concentration effect on UV-visible spectrum UV-Visible spectrophotometer
UV-Visible spectrum of Chlorophyll a & b
IR Spectroscopy IR Spectrum Ft- IR Spectrum (1/ʎ)
Circular Dichroism (CD) Spectrophotometry (Circularly polarized light is needed for it)
Cd Spectrum can determine Protein second structure: alpha helix (red), beta sheet (green) and random coil (black)
CD Images
Nuclear Magnetic Resonance (NMR)
NMR spectrum
Mass spectroscopy: The best tool for determining trace of materials in samples