Microevolution Population genetics Chapter 23 Biology B Adi
 Chapter 23 Biology B Adi Stern 1")
Microevolution (Population genetics) Chapter 23 Biology B Adi Stern 1
? • Evolution = change in allele frequencies over time")
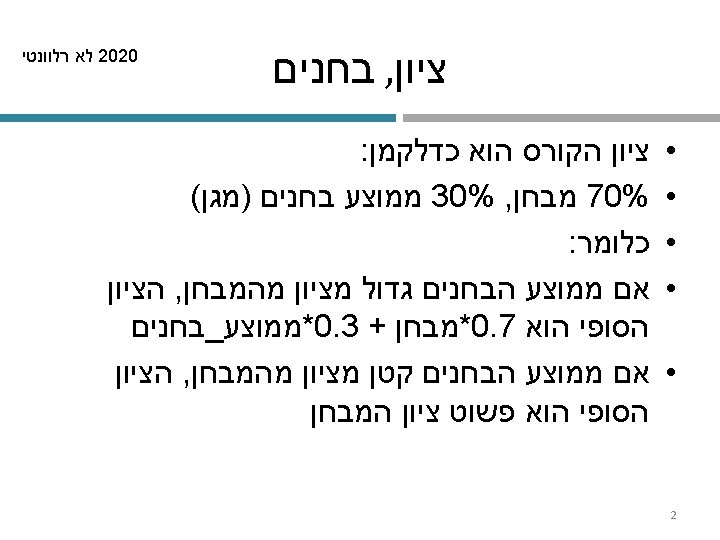
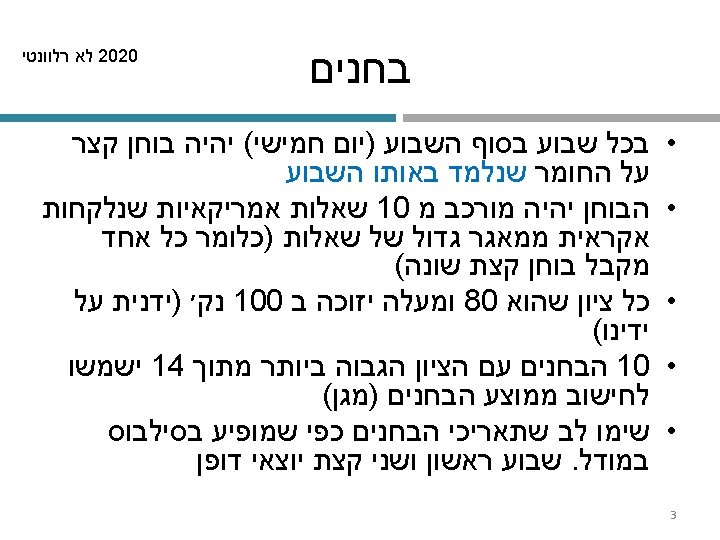
What is microevolution (population genetics)? • Evolution = change in allele frequencies over time • Microevolution = short term evolution • Macroevolution = long term evolution • Population genetics = mathematical structure for short term evolutionary changes 5

Modern synthesis • From Darwin to Mendel to geneticists Fisher, Haldane and Wright • Made the link between genotype (the molecular level) and phenotype (the level where selection acts) 6
 • More complex traits (many")
Genotype to phenotype • Colors (e. g. eye color) • More complex traits (many genes) Eye color/s is determined by a few genes (around five) Most other traits (height, size, etc. ) are determined by multiple genes and complex interactions 7

What is a population? • A population is a localized group of individuals capable of interbreeding and producing fertile offspring 8
 9")
Evolution acts on genetic diversity (genetic variation) 9

How to measure genetic variation • Average heterozygosity = the average proportion of individuals that are heterozygous for a specified set of loci • Cheetahs… have very low average heterozygosity 10
: shuffles existing variation")
What creates genetic diversity? 1. Mutation, mutation 2. Recombination (sexual reproduction): shuffles existing variation 3. Duplication (segments, chromosomes, transposons) create complex effects 11
 • Most often deleterious or neutral")
Effects of mutations ( & all genetic changes) • Most often deleterious or neutral • Neutral: synonymous mutations, mutations at non-coding regions (? ) • Deleterious: deleterious mutations are often hidden in the form of recessive alleles, thus contributing to diversity • Very rarely, an adaptive mutation 12
 Mutation rates 13")
Mutation rate (mutation/site/replication) Mutation rates 13

Low mutation rates • Viruses aside, most organisms have very low mutation rates (~10 -9 mutations per site per replication cycle) • The effects of mutations are also dependent on generation time • Thus, for example in bacteria/yeast, we will observe the effects of mutation rate more rapidly 14

Sexual reproduction • Sexual reproduction can “shuffle” existing alleles into new combinations • In organisms that reproduce sexually, recombination of alleles is likely more important than mutation in producing the genetic differences that make adaptation possible 15

The Hardy-Weinberg Equation 16

The HW equation • Gives a sense what to expect when no evolution occurs • Reminder: evolution is modification with descent, i. e. , represents changes over time 17

Some definitions • Gene pool: all the alleles for all loci in the population • A locus is fixed if all individuals in a population are homozygous for the same allele • If there are two or more alleles for a locus, diploid individuals may be either homozygous or heterozygous 18

Figure 23. UN 01 Example: populations of flowers Color is determined by one locus. with incomplete dominance CR CR CW CW CR allele, homozygous CW allele, homozygous heterozygous

Calculating allele frequencies • For diploid organisms, the total number of alleles at a locus is the total number of individuals times 2 • The total number of dominant alleles at a locus is two alleles for each homozygous dominant individual plus one allele for each heterozygous individual; the same logic applies for recessive alleles

• By convention, if there are two alleles at a locus, p and q are used to represent their frequencies • The frequency of alleles in a population will add up to 1: p q 1

Example of allele frequencies • For example, consider a population of wildflowers : – 320 red flowers (CRCR) – 160 pink flowers (CRCW) – 20 white flowers (CWCW) • Calculate the number of copies of each allele – CR (320 2) 160 800 – CW (20 2) 160 200

• To calculate the frequency of each allele p freq CR 800 / (800 200) 0. 8 q freq CW 200 / (800 200) 0. 2 • The sum of allele frequencies is always 1 0. 8 0. 2 1

The Hardy-Weinberg Equation • The Hardy-Weinberg equation describes the genetic makeup we expect for a population that is not evolving at a particular locus • If the observed genetic makeup of the population differs from expectations under Hardy-Weinberg, it suggests that the population may be evolving

Hardy-Weinberg Equilibrium • In a population where gametes contribute to the next generation randomly and Mendelian inheritance occurs, allele and genotype frequencies remain constant from generation to generation • Such a population is in Hardy-Weinberg equilibrium

Figure 23. 7 Frequencies of alleles p = frequency of CR allele = 0. 8 q = frequency of CW allele = 0. 2 Alleles in the population Gametes produced Each sperm: Each egg: 80% 20% chance

• Hardy-Weinberg equilibrium describes the constant frequency of alleles in such a gene pool • Consider, for example, the same population of 500 wildflowers and 1, 000 alleles where p freq CR 0. 8 q freq CW 0. 2

• The frequency of genotypes can be calculated – CRCR p 2 (0. 8)2 0. 64 – CRCW 2 pq 2(0. 8)(0. 2) 0. 32 – CWCW q 2 (0. 2)2 0. 04 • The frequency of genotypes can be confirmed using a Punnett square
 20% CW (q = 0.")
Figure 23. 8 80% CR (p = 0. 8) 20% CW (q = 0. 2) Sperm CR p = 0. 8 CW q = 0. 2 CR p = 0. 8 0. 64 (p 2) CRCR Eggs CW 0. 16 (pq) CRCW 0. 16 (qp) CRCW q = 0. 2 0. 04 (q 2) CWCW 64% CRCR, 32% CRCW, and 4% CWCW Gametes of this generation: 64% CR + (from CRCR plants) 16% CR = 80% CR = 0. 8 = p (from CRCW plants) 4% CW + (from CWCW plants) 16% CW = 20% CW = 0. 2 = q (from CRCW plants) With random mating, these gametes will result in the same mix of genotypes in the next generation: 64% CRCR, 32% CRCW, and 4% CWCW plants
 80% CR (p =")
Figure 23. 8 a 20% CW (q = 0. 2) 80% CR (p = 0. 8) CR Sperm p = 0. 8 CW q = 0. 2 CR p = 0. 8 Eggs CW q = 0. 2 0. 64 (p 2) C RC R 0. 16 (qp) C RC W 0. 16 (pq) C RC W 0. 04 (q 2) CW CW

• If p and q represent the relative frequencies of the only two possible alleles in a population at a particular locus, then p 2 2 pq q 2 1 …. = (p+q)2 where p 2 and q 2 represent the frequencies of the homozygous genotypes and 2 pq represents the frequency of the heterozygous genotype

Hardy-Weinberg expectation Genotype frequencies Allele frequencies 32

Five assumptions underlying HW 1. 2. 3. 4. 5. No mutations Random mating (with respect to locus) No natural selection Extremely large (infinite) population size No gene flow (no migration)
 Equilibrium • Given HW, we know")
What can we learn from the Hardy-Weinberg (HW) Equilibrium • Given HW, we know what to expect in the next generation/s • Given HW, we can calculate frequencies of heterozygotes from allele frequencies (for example) • We can test for HW. If it is violated, this can give us a lead that one of the five assumptions was not met
")
Applying the Hardy-Weinberg Equation • Let’s look at the locus that causes phenylketonuria (PKU) and test whether it is in Hardy-Weinberg equilibrium in the U. S.

Phenylketonuria • Genetic disease whereby phenylalanine is not metabolized • Treatment: phenylalanine-restricted diet 36

Do the five assumptions hold? 1. 2. 3. 4. 5. No mutations Random mating (with respect to locus) No natural selection Extremely large population size No gene flow (no migration) 37

Yes 1. The PKU gene mutation rate is very low 2. Mate selection is random with respect to whether or not an individual is a carrier for the PKU allele 3. Natural selection can only act on rare homozygous individuals who do not follow dietary restrictions 4. The U. S. population is large 5. Migration has little to no effect as many other populations have similar allele frequencies

Testing for Hardy-Weinberg equilibrium • The occurrence of PKU is 1 per 10, 000 births q 2 0. 0001 q 0. 01 • The frequency of the normal allele is p 1 - q 1 - 0. 01 0. 99 • The frequency of carriers should be 2 pq 2 0. 99 0. 0198 or approximately 2% of the U. S. population ✔

Summary of HW • We’ve seen what to expect when there is no evolution 40

So what does cause evolution ? 41

What creates changes in allele frequencies? • Three major mechanisms: I. Natural selection II. Genetic drift III. Gene flow • All of these mechanism cause changes in allele frequency, and hence evolution • Only natural selection consistently causes adaptive evolution 42

Natural selection • Yet another definition, put in similar terms: • Natural selection: “Differential success in reproduction results in certain alleles being passed to the next generation in greater proportions” 43

Fitness • Fitness of an organism/allele/phenotype is defined as its reproductive success and how much it contributes to the gene pool of the next generation 44

Confusing term • The phrases “struggle for existence” and “survival of the fittest” are misleading as they imply direct competition among individuals • There is however resource competition & there also might be direct competition (e. g. , bull males) 45

Types of natural selection 46

Directional, Disruptive, and Stabilizing Selection • There are three modes of selection – Directional selection favors individuals at one extreme end of the phenotypic range – Disruptive selection favors individuals at both extremes of the phenotypic range – Stabilizing selection favors intermediate variants and acts against extreme phenotypes
")
Frequency of individuals Figure 23. 13 Original population Original Evolved population Phenotypes (fur color) (a) Directional selection (b) Disruptive selection (c) Stabilizing selection

Genetic drift 49

Genetic drift • The smaller a sample, the greater the chance of random deviation from a predicted result • Genetic drift describes how allele frequencies fluctuate unpredictably from one generation to the next • Genetic drift tends to reduce genetic variation through losses of alleles 50

Figure 23. 9– 1 CRCR CRCW CRCR CWCW CRCW CRCR CRCW Generation 1 p (frequency of CR) = 0. 7 q (frequency of CW) = 0. 3

Figure 23. 9– 2 5 plants leave offspring CRCR CWCW CRCR CRCW CRCR CWCW CRCR CWCW CRCW CRCR CRCW Generation 1 p (frequency of CR) = 0. 7 q (frequency of CW) = 0. 3 CRCW Generation 2 p = 0. 5 q = 0. 5

Figure 23. 9– 3 5 plants leave offspring CRCR CRCW CWCW CRCR CRCR CWCW 2 plants leave offspring CRCR Generation 1 p (frequency of CR) = 0. 7 q (frequency of CW) = 0. 3 CRCR CRCW CRCR CWCW CRCW CRCR CRCW Generation 2 p = 0. 5 q = 0. 5 CRCR Generation 3 p = 1. 0 q = 0. 0

Genetic drift, effects of small numbers • Genetic drift is based on statistical effects of small numbers • Flip a coin 1, 000 times. Heads 50% Tails 50% • Flip a coin 10 times. Very possibly deviate from 5 Heads-5 Tails. 54

Two manifestations of genetic drift 1. The founder effect 2. The bottleneck effect (Both are very similar) 55

Founder effect • The founder effect occurs when a few individuals become isolated from a larger population • Allele frequencies in the small founder population can be different from those in the larger parent population 56
")
Founder effect • South Africa was colonized by a small number of Dutch (Afrikaners) founders • Today - high frequency of allele for Huntington's disease (late onset disease causing brain cell death) 57

The Bottleneck Effect • The bottleneck effect is a sudden reduction in population size due to a change in the environment • The resulting gene pool may no longer be reflective of the original population’s gene pool • If the population remains small, it may be further affected by genetic drift

Figure 23. 10– 1 Original population

Figure 23. 10– 2 Original population Bottlenecking event

Figure 23. 10– 3 Original population Bottlenecking event Surviving population

Northern elephant seals • Severe population bottleneck during the 1890’s, population dropped to about 20 individuals • Since, the population has increased to ~30, 000 • Still very low genetic diversity 62
 are small")
Genetic drift summary • Can occur when numbers (population size, allele number) are small • May cause alleles to be lost or fixed simply by chance • May also lead to loss of adaptive alleles • May lead to fixation of deleterious alleles 63

לא רלוונטי 2020 Selection versus drift Not studied • Selection is deterministic • Genetic drift is a random process There is a big debate which process affects evolution more 64

Gene flow 65
 consists of the movement of alleles among")
Gene flow definition • Gene flow (migration) consists of the movement of alleles among populations • Alleles can be transferred through the movement of fertile individuals or gametes (for example, pollen) 66

לא רלוונטי 2020 Impact of gene flow Not studied • Gene flow will maintain genetic diversity within two populations (when viewed together) • Gene flow will decrease variation between two populations. • The latter acts against speciation and separation of the two populations 67

Not studied לא רלוונטי 2020 Research examples 68

לא רלוונטי 2020 Archaic humans Not studied • We are not alone (or rather were not alone) • There are estimates of 15 -20 different human species once living in Africa 69

לא רלוונטי 2020 Out of Africa Not studied • Neanderthals and Denisovians came out of Africa before our Homo sapiens ancestors did 70

לא רלוונטי 2020 Out of Africa Not studied 71

לא רלוונטי 2020 Human migrations Not studied • The “Out of Africa” and subsequent migration models were originally supported by extensive fossil data 72

לא רלוונטי 2020 Human migrations Not studied • The “Out of Africa” and subsequent migration models are strongly supported by genetic data, which also show population bottlenecks and reduction in genetic diversity 73

A genetic tree based on genetic variation לא רלוונטי 2020 Not studied 74

Not studied לא רלוונטי 2020 Gene flow & selection 75

לא רלוונטי 2020 Not studied 76

Neanderthals & humans shared genes לא רלוונטי 2020 Not studied • “Neanderthals shared more genetic variants with present-day humans in Eurasia than with. present-day humans in sub-Saharan Africa, suggesting that gene flow from Neanderthals into the ancestors of non-Africans occurred before the divergence of Eurasian groups from each other” 77

לא רלוונטי 2020 Keratin gene Not studied • Genes affecting Keratin (skin & hair color) were have shown to have undergone gene flow from Neanderthals into modern humans • May have allowed adaptation to non-African environments 78

לא רלוונטי 2020 Not studied 79

לא רלוונטי 2020 Adaptation to altitude Not studied • Tibetans are adapted to high climate & low oxygen • Most people – produce more hemoglobin, which may become toxic • Tibetans don’t • An allele of the transcription factor EPAS 1 is known to be involved in adaptation to high altitude 80

לא רלוונטי 2020 Gene flow + selection Not studied • The study showed introgression (a form of gene flow): • An allele of EPAS 1 was shown to be derived from a Denisovian archaic human • This allele was likely adaptive and hence reached high frequency in the Tibetan population 81

Summary • Evolution occurs when allele frequencies change • HW equation predicts what happens when no evolution • Three major mechanisms that drive evolution are natural selection, genetic drift, gene flow • Only natural selection consistently leads to adaptation to the environment 82

Reading material • All of chapter 23, except : • - sexual selection • - balancing selection 83
- Slides: 83