MICROECONOMIC FOUNDATIONS OF COSTBENEFIT ANALYSIS Townley Chapter 4

MICROECONOMIC FOUNDATIONS OF COST-BENEFIT ANALYSIS Townley, Chapter 4

Review of Basic Microeconomics • Slides cover the following topics from textbook: – Input markets. – Decision making on the margin. – Pricing mechanisms. – Opportunity cost

Competitive Markets • • Assume inputs are bought in input markets. Some projects will also produce goods that are sold in output markets. Assume both of these markets are perfectly competitive, this requires: Good or service is homogenous. There are many firms producing the good or service so no firm can dominate the market (firms are price takers, i. e. no monopolists). Households, firms, and consumers are price takers (i. e. no one dominates demand, so no monopsonist). No barriers to entry and firms earn zero economic profits in LR equilibrium.

– Total revenue for quantity of good sold in the market is TR=P*Q – Economists summarize sensitivity of quantity to changes in price with elasticities: • If elasticity of demand curve >1, then demand is elastic and a fall in the price increases TR. • If elasticity of demand curve <1, then demand curve is inelastic and a fall in prices reduces TR. • If elasticity =1, no change in TR if prices change. – Elasticities also tell us about slopes of demand (as well as supply curve).

• Elastic demand curves are flatter. • Inelastic demand curves are steeper.

Supply, Marginal Cost and Opportunity Cost: •

Opportunity Cost •

– Cost of producing units is measured by the area under the supply curve. – The difference between the maximum consumers are willing to pay and minimum firms are willing to accept for producing than is given by RET, called the social surplus.
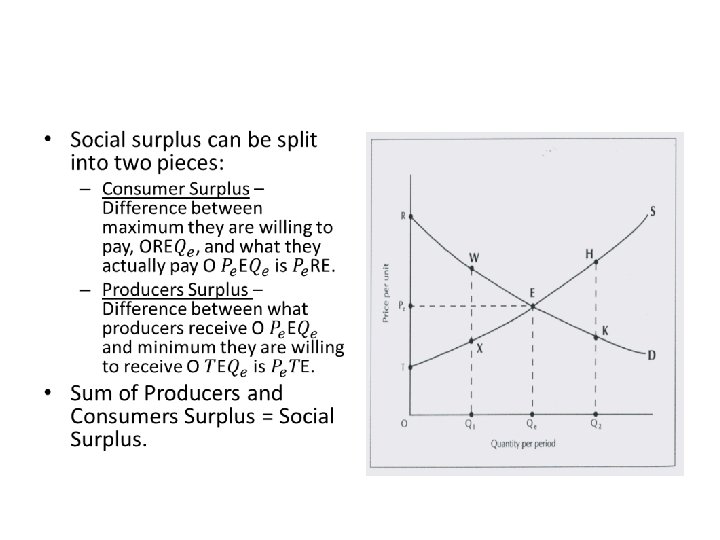

• Competitive markets maximize the sum of producer and consumer surpluses. • Competitive markets maximize social surplus because they accommodate all transactions that are mutually advantageous and reject any that are not. • In other words, competitive equilibrium is optimal. • Alternatively, equilibrium exhibits allocative efficiency or it is efficient. An allocation of resources is Pareto optimal (efficient) if it is impossible to find another allocation (level of output) such that at least one economic agent is made better off and no economic agent is made worse off.
 and")
• The above analysis applies to both output market (for finished goods) and input markets (labour). • Market equilibrium reflects market clearing at a particular point in time, but sometimes factors affect equilibrium.

Demand Shifts • Population may have increased. • Government may require more of an input. • Price of a substitute good may have decreased / increased. • Price of a complementary good may have decreased / increased. • Consumer’s preferences may have changed. • If a normal good, demand increases if income increases. • If an inferior good, demand decreases if income increases.

Supply Shifts • Increase in number of firms, attracted by positive profits. • Increases in supply may have been produced by a newly constructed government project. • Price of a product that is a substitute in production may have decreased. • Government may legislate subsidies or taxes. • Technology changes. • Agricultural products (change in climate).

• SR economic profits can be positive or negative. • In LR economic profits are zero, firms enter and leave market.

Market Failure • Markets don’t always work properly. • Might be monopolies who produce less than optimal amount of output. • Might also be problems with information, insurers may not always be able to judge risks associated with someone who wants insurance. • More specific problems.

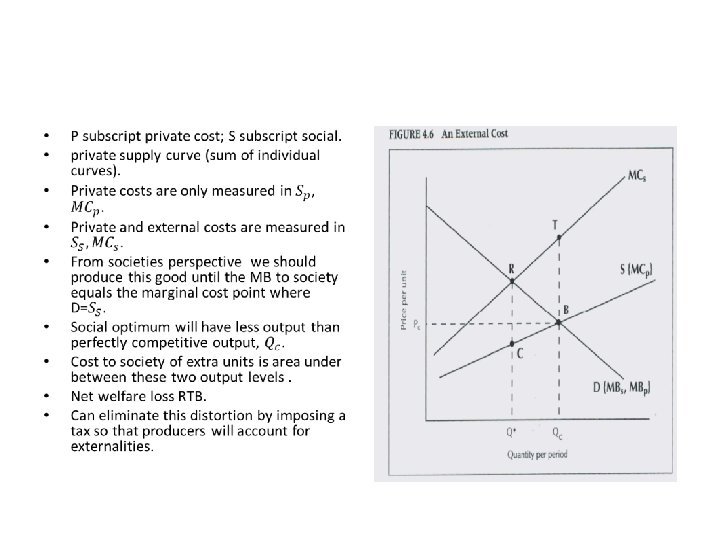
Externalities • Consumers purchase additional units of a good as long as their private marginal benefits exceed the price they pay. • People are motivated by their self-interest only; they don’t care if their consumption makes someone worse off. E. g. smoking – negative effects on non-smokers; gardens – positive effects on all. • In producer markets, pollution may be an issue. • Why do externalities make a difference? • The classic example is the firm that pollutes.

Public Goods • Some goods have benefits which can only be consumed by one person other goods may have benefits which don’t exclude multiple economic agents from consuming it, e. g. street lights, national defence. • For a public good produce it as long as the marginal benefit society derives from it exceeds marginal cost or producing it. • Coming up with demand curves is different.
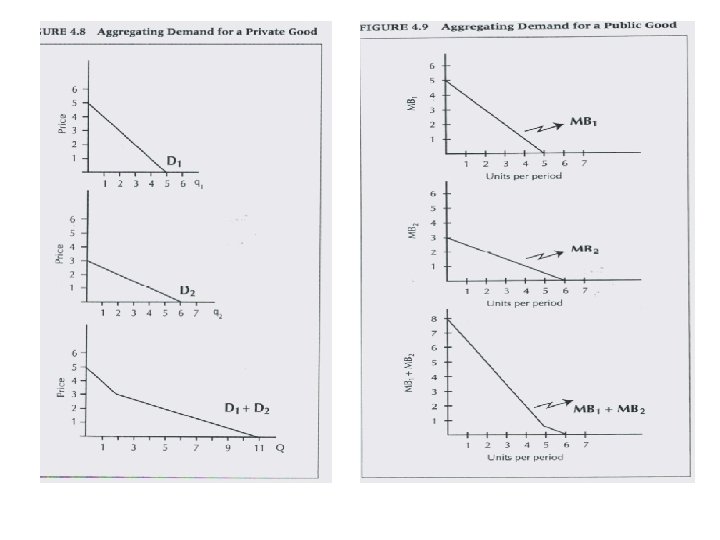

• Why is it different? • Public goods are non-rival. Just because I consume it does not take any away from you. • Take vertical sum, not horizontal sum.
- Slides: 21