Microarray Technology Introduction Microarrays are extremely powerful ways


- Slides: 12
Microarray Technology
Introduction – Microarrays are extremely powerful ways to analyze gene expression. – Using a microarray, it is possible to examine the expression level of thousands of genes in one experiment – Microarrays can be used to compare the expression of many genes under different conditions (cancer cells vs. normal cells, skin cells vs. organ cells, rapidly growing cells vs. quiescent cells, etc. )
Types of Microarrays – Microarrays can be classified into two general types. • c. DNA arrays consist of c. DNA copies of m. RNA spotted onto a glass slide. • oligo arrays consist of strands of oligonucleotides either spotted onto a glass slide or lithographed onto a solid surface.
Oligonucleotide Array
Microarray experiments – A typical microarray experiment consists of extracting RNA from the cells or tissue being examined, converting the RNA to c. DNA, labelling the c. DNA with fluorescent dyes and allowing the labelled c. DNA to hybridize with the material (c. DNA or oligonucleotide) on the microarray slide.
Microarray experiments – In some experiments, the control and subject RNAs are synthesized with different fluorescent dyes and mixed on the same slide. Other protocols use separate slides for the subject and control RNAs.
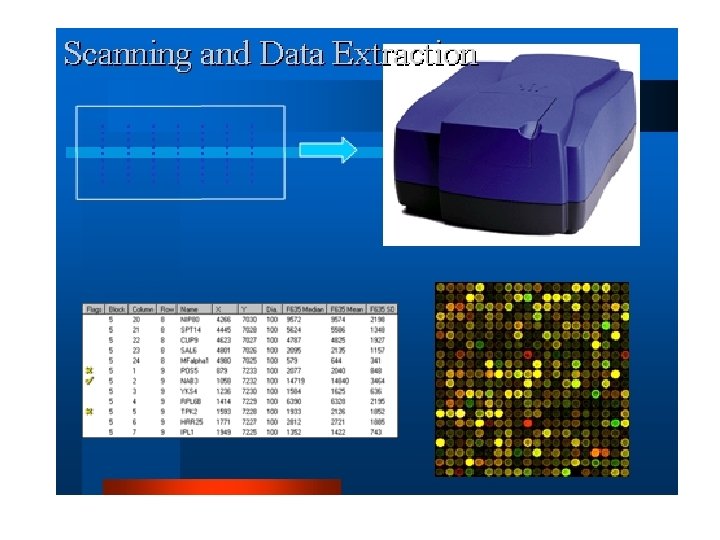
– After hybridization, the slides are scanned using a laser device to determine the amount of fluorescent label that is attached to each c. DNA on the slide. – The amount of fluorescence is displayed as a spot on a matrix corresponding to the original slide.
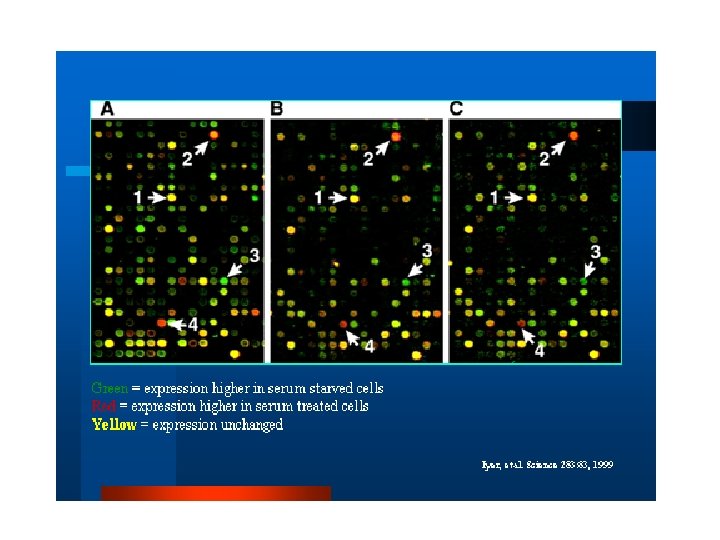
– The intensity images are colored according to a standard where a higher level of fluorescent label in the subject (enhanced gene expression) is colored red. A lower level (repressed level of gene expression) is colored green. Equal levels are yellow.