Microarray Analysis Software Ricardo Verdugo ECS 289 A


")
")


![Affymetrix Data [CEL] Version=3 [HEADER] Cols=640 Rows=640 Total. X=640 Total. Y=640 Offset. X=0 Offset.](https://slidetodoc.com/presentation_image_h2/f1ae57299efaf909a60fff02bab4d0ca/image-18.jpg "Affymetrix Data [CEL] Version=3 [HEADER] Cols=640 Rows=640 Total. X=640 Total. Y=640 Offset. X=0 Offset.")


- Slides: 26
Microarray Analysis Software Ricardo Verdugo ECS 289 A – Winter 2003 University of California, Davis
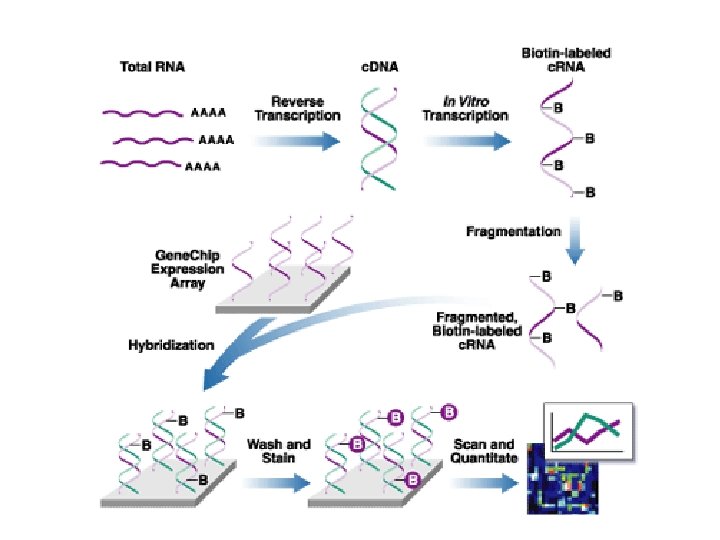
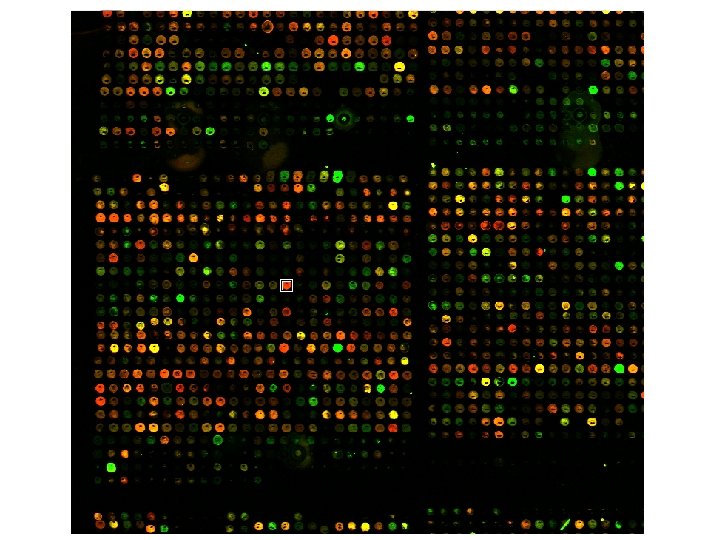
Classes of software 1. Array experiment image analysis I. III. IV. V. VI. Load image (. SCN , TIFF , others) Select channels Select parameter Normalization Gridding Reading 2. Statistical analysis of raw data ? ? 3. Discovery tools (you name it)
Array. Maker Version 2 (Free for Academics)
Array. Maker Version 2 (Free for Academics)
It is worth to take a look
Reading Radioactive signal
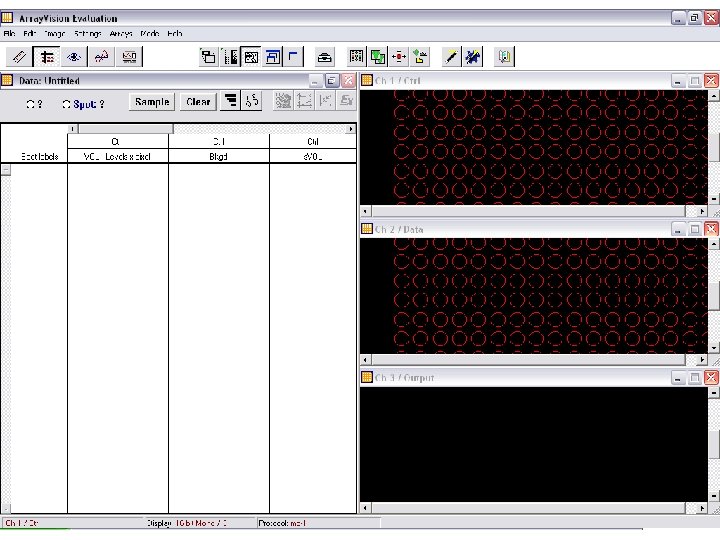
Some available software • Commercial Sources Program Web address Types of functions Array Vision www. imagingresearch. com Image viewing, normalization, data extraction Gene. Spring 5. 0 www. sigenetics. com t-test, hierarchical clustering, k-means, SOM, PCA, class predictor, experiment tree Data Mining Tool (DMT) 3. 0 www. affymetrix. xom T-test, Mann-Whitney test, SOM, modified Pearson’s correlation coefficient Gene. Sight 3 www. biodiscovery. com t-test, k-means, hierarchical clustering, SOM, PCA, pattern similarity search, non-linear normalization
Some available software • Web-based sources Program Web address Types of functions Gene Maths www. applied-maths. com Hierarchical clustering, kmeans, SOM, PCA, discrimination analysis with or without variance EPCLUST/ Means Expression Profiler www. ebi. ac. uk/microarray Hierarchical clustering, kmeans and finding nearest neighbors
Some available software • Freeware sources Program Web address Types of functions J-Express www. molmine. com Hierarchical clustering, kmeans, PCA, SOM, profile similarity search Scan. Alyze Cluster Tree View http: //rana. lbl. gov/Eisen. Soft ware. htm T-test, Mann-Whitney test, SOM, modified Pearson’s correlation coefficient
Scan. Alyse
Scan. Alyse
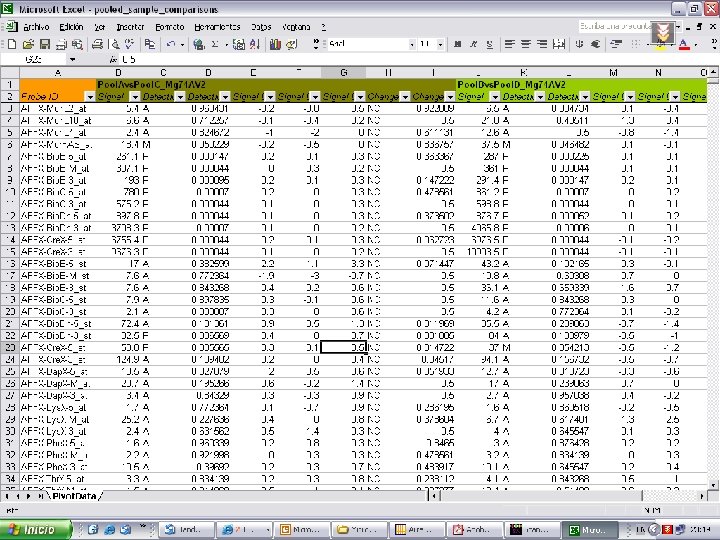
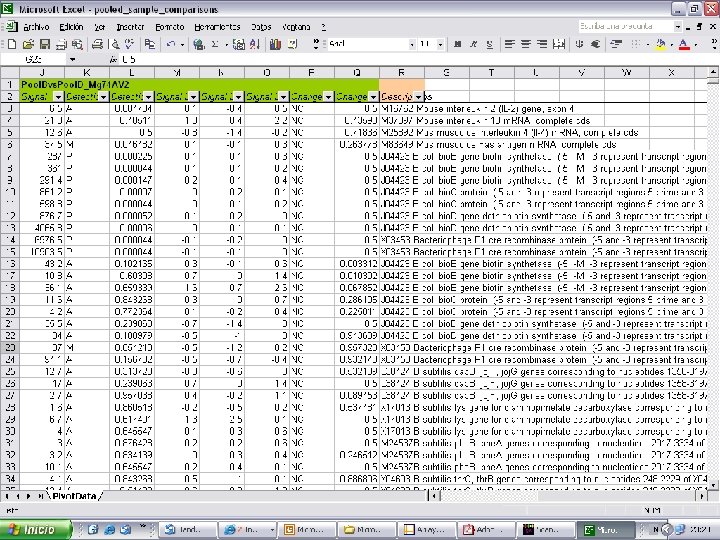
Affymetrix Data [CEL] Version=3 [HEADER] Cols=640 Rows=640 Total. X=640 Total. Y=640 Offset. X=0 Offset. Y=0 Grid. Corner. UL=227 235 Grid. Corner. UR=4495 248 Grid. Corner. LR=4462 4514 Grid. Corner. LL=194 4500 Axis-invert. X=0 Axis. Invert. Y=0 swap. XY=0 Dat. Header=[0. . 46136] Pool. A_Mg 74 AV 2: CLS=4733 RWS=4733 XIN=3 YIN=3 VE=17 2. 0 03/21/02 12: 20: 00 MG_U 74 Av 2. 1 sq Algorithm=Percentile Algorithm. Parameters=Percentile: 75; Cell. Margin: 2; Outlier. High: 1. 500; Outlier. Low: 1. 004 [INTENSITY] Number. Cells=409600 Cell. Header=X Y 0 0 111. 0 10116. 5 2 0 130. 0 3 0 9843. 0 4 0 72. 5 5 0 93. 0 6 0 9556. 0 7 0 105. 0 8 0 9213. 0 9 0 132. 0 10 0 9685. 3 11 0 115. 0 12 0 9346. 0 13 0 114. 0 14 0 8730. 0 MEAN 21. 3 1543. 4 183. 6 1893. 8 25. 0 12. 8 1746. 1 19. 1 2078. 4 47. 5 1357. 6 130. 3 1612. 0 27. 3 1991. 5 STDV 25 20 25 25 20 25 NPIXELS
Affymetrix Data
Gene. String 5. 0 • Data Normalization
Gene. String 5. 0 • Data Clustering
Gene. String 5. 0 • 3 D Data Visualization
Gene. String 5. 0 • Pathway Views
Gene. String 5. 0 • Scripting