Mhendislik Fakltesi Kimya Mhendislii Blm KMB 236 Mesleki

Mühendislik Fakültesi Kimya Mühendisliği Bölümü KMB 236 -Mesleki İngilizce Dr. Öğr. Üyesi, İsa DEĞİRMENCİ

Statistics KMB 236 -Mesleki İngilizce Hafta-12

Statistics is a branch of mathematics dealing with the collection, analysis, interpretation, presentation, and organization of data. Statistics deals with all aspects of data including the planning of data collection in terms of the design of surveys and experiments.

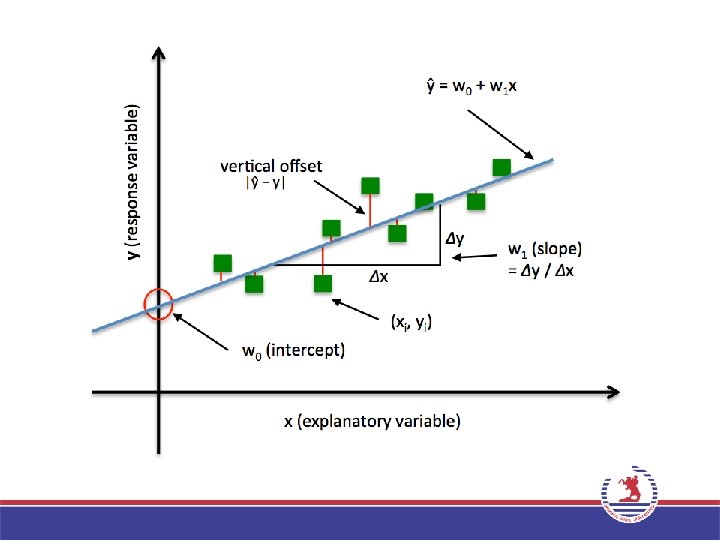
What is Simple Linear Regression? Simple linear regression is a statistical method that allows us to summarize and study relationships between two continuous (quantitative) variables: • One variable, denoted x, is regarded as the predictor or independent variable. • The other variable, denoted y, is regarded as the response, outcome, or dependent variable. Because the other terms are used less frequently today, we'll use the "predictor" and "response" terms to refer to the variables encountered https: //onlinecourses. science. psu. edu/stat 501/node/251

Statistics is interested in statistical relationships, in which the relationship between the variables is not perfect.

Here is an example of a statistical relationship. The response variable y is the mortality due to skin cancer (number of deaths per 10 million people) and the predictor variable x is the latitude (degrees North) at the center of each of 49 states in the U. S. https: //onlinecourses. science. psu. edu/stat 501/node/251

You might anticipate that if you lived in the higher latitudes of the northern U. S. , the less exposed you'd be to the harmful rays of the sun, and therefore, the less risk you'd have of death due to skin cancer. The scatter plot supports such a hypothesis. There appears to be a negative linear relationship between latitude and mortality due to skin cancer, but the relationship is not perfect. Indeed, the plot exhibits some "trend, " but it also exhibits some "scatter. " Therefore, it is a statistical relationship, not a deterministic one.

What is the "Best Fitting Line"? Since we are interested in summarizing the trend between two quantitative variables, the natural question arises — "what is the best fitting line? " Looking at the plot ebove, which line - the solid line or the dashed line - do you think best summarizes the trend between height and weight?

Least Square Regression Line Equation Least Square Regression Line method is the accurate way of finding the 'line of best fit'. Line of best fit is the straight line that is best approximation of the given set of data. It helps in finding the relationship between two variables on a two dimensional plane. It can also be defined as 'In the results of every single equation, the overall solution minimizes the sum of the squares of the errors. Least square regression is a method for finding a line that summarizes the relationship between the two variables.
 of a set of data")
Mean Absolute Deviation • The Mean Absolute Deviation (MAD) of a set of data is the average distance between each data value and the mean. The steps to find the MAD include: 1. find the mean (average) 2. find the difference between each data value and the mean 3. take the absolute value of each difference 4. find the mean (average) of these difference
 distribution is a very common")
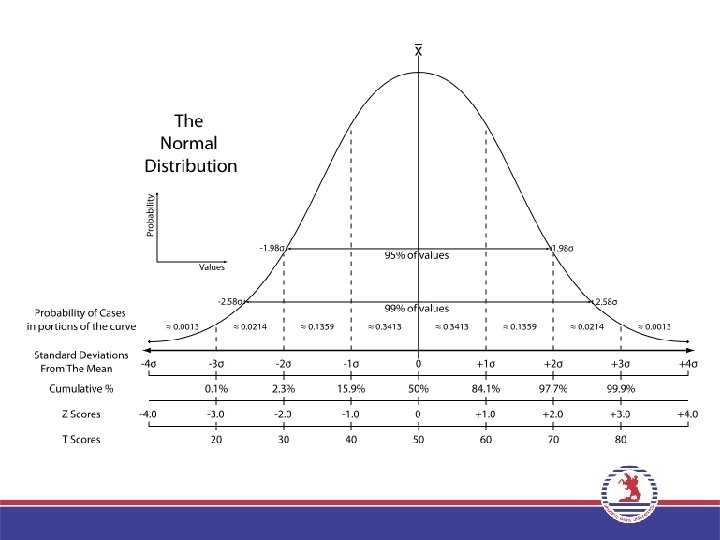
Normal distribution In probability theory, the normal (or Gaussian) distribution is a very common continuous probability distribution. Normal distributions are important in statistics and are often used in the natural and social sciences to represent real-valued random variables whose distributions are not known. A plot of normal distribution (or bell-shaped curve) where each band has a width of 1 standard deviation. (68– 95– 99. 7 rule)

Example of samples from two populations with the same mean but different standard deviations. Red population has mean 100 and SD 10; blue population has mean 100 and SD 50.

Standard deviation In statistics, the standard deviation (SD, also represented by the Greek letter sigma σ or the Latin letter s) is a measure that is used to quantify the amount of variation or dispersion of a set of data values.

• For a finite set of numbers, the standard deviation is found by taking the square root of the average of the squared deviations of the values from their average value. • For example, the marks of a class of eight students are the following eight values: 2 , 4 , 4 , 5 , 7 , 9.
 of 5. First, calculate the deviations")
These eight data points have the mean (average) of 5. First, calculate the deviations of each data point from the mean, and square the result of each:

The variance is the mean of these values: and the population standard deviation is equal to the square root of the variance:

Application examples • The practical value of understanding the standard deviation of a set of values is in appreciating how much variation there is from the average (mean).

Weather As a simple example, consider the average daily maximum temperatures for two cities, one inland one on the coast. It is helpful to understand that the range of daily maximum temperatures for cities near the coast is smaller than for cities inland. Thus, while these two cities may each have the same average maximum temperature, the standard deviation of the daily maximum temperature for the coastal city will be less than that of the inland city as, on any particular day, the actual maximum temperature is more likely to be farther from the average maximum temperature for the inland city than for the coastal one.
- Slides: 20