Metropolitans SWP Supply Forecasting and Optimal Scheduling CWEMF


- Slides: 21
Metropolitan’s SWP Supply Forecasting and Optimal Scheduling CWEMF Annual Meeting February 27, 2007 Peter Louie Metropolitan Water District of So. California
Objectives • Improve short-term water management decision-making and scheduling for MWD • Allow varying levels of risk to be considered in decision-making • Utilize optimization to mimic water supply, water quality, and cost preferences
MWD Water Operations Regional water supply to 6 counties n n n n n 26 Member Agencies Supply 18 million people Supply 1. 5 billion gallons of water/day 1, 072 miles of pipelines, tunnels, & canals 5 treatment plants 17 reservoirs 16 hydroelectric power plants 45 major control structures 5 pumping plants on the CRA Ø SWP entitlement: 1. 9 MAF (2006) Ø CRA entitlement: 652 TAF
Dry-Year Portfolio Sacramento Valley transfers & DWR Drought Bank n Surface Reservoirs n Multi-Year Programs (Ground water) San Luis Reservoir Semitropic W. S. D. San Joaquin Valley transfers n Single-Year Options (Transfers) Kern Delta W. D. Arvin-Edison W. S. D. Mojave W. A. San Bernardino Castaic Valley. Lake M. W. D. Hayfield Lake Perris Basin Lake Mathews Arizona Banking Diamond Valley Lake Coachella Valley Skinner W. D. Reservoir Palo Verde I. D. Imperial I. D.
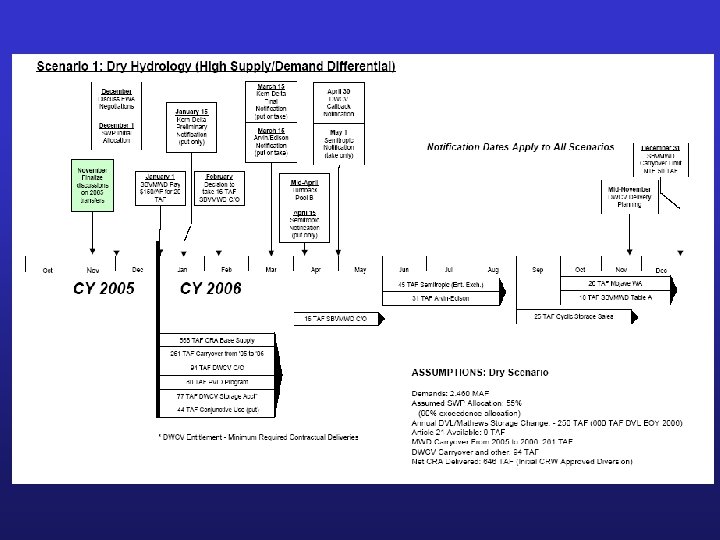
WSDM Action Timeline EWA Negotiations SWP initial Allocation Kern Delta Notification For Put only Final Kern Delta Notification Put/Take Arvin Edison Notification Put/Take DWCV Callback Notification Semitropic SWP Notification Final Put Allocaton Turnback Semitropic Pool B Notification Take SBVMWD Transfers Notification Dec 2005 Jan 2006 Feb Mar Apr May Decision to take SBVMWD Transfers Nov Dec DWCV Deliveries Set Carryover Limits
SWP Forecasts WQ, WS Allocation and storage conditions wq characteristics Transfers North of Delta Ops System Models Integra And Optimization Sche Availability of quantity, timing and wq characteristics Transfers South of Delta WQCP/ESA/EWA/b 2 and other Delta regulations and requirements Availability of quantity, timing and wq characteristics Aqd. /Res. Model Tracking wq Optimization Procedure MWD Dist. System Model LP/DP approach to determine the desirable combination of SWP/CRA/ EWA/Transfers/MWD storage ops in meeting both the ws/wq objectives. CRA Forecasts WQ, WS Allocation and storage conditions wq characteristics Res. ops/ wq targets for treatment plants/ consumptive use/seasonal storage
Overall Analytical Approach
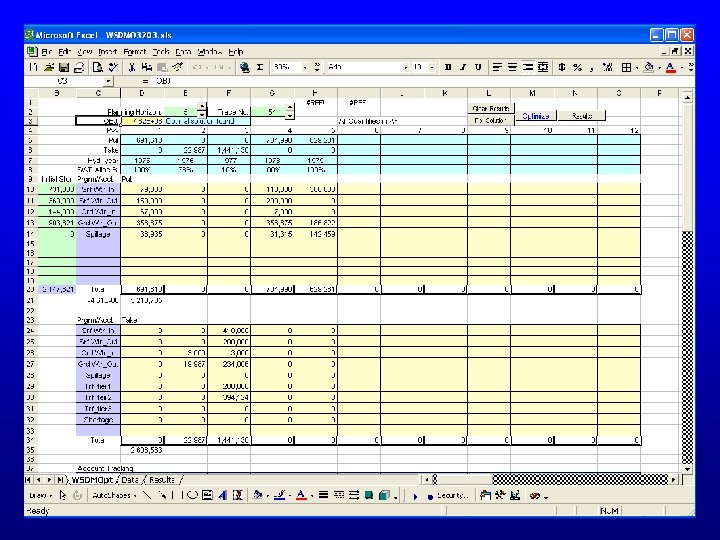
SWP Allocation Forecasting Tool Source Data CAM Input Runtime Control/ Data Setup
Projections under Poor/No Forecast • Period of greatest uncertainty: October – January • Critical information – Risk of spill of carryover storage – Initial allocation – Positional Analysis provides broad sampling of possible hydrologic conditions – Monte-Carlo simulation with uniform sampling of historic hydrology • Climate indicators may indicate skewness from the uniform sampling – Reshaping of Position Analysis inputs – As forecast becomes available, CAM stand-alone may be used in conjunction with PA-CAM
Projections with Available Forecast • Improving forecasts: February – May • Critical information – Delivery reliability – Storage conditions • P 25, P 50, P 75, P 90, P 99 forecasts provide traces of possible hydrologic conditions • CAM stand-alone study provides delivery and storage estimates • Longer term assessed with CAM-PA simulations
SWP Allocation Forecasting Tool Source Data CAM Input Runtime Control/ Data Setup
Method for developing revised inflow distributions Updated Inflow Distribution Official B-120 Forecast + Precipitation Indices = Ranked Inflow Distribution Historical Inflow Traces + Precipitation or Climate Indices =
Proposed Monte Carlo simulation method
Summary • Forecast-Optimization approach shows promise for improving MWD water management • Consideration of uncertainty allows MWD decision-makers/operators to assess internal risk • Optimization approaches are actively being used in SWP and MWD systems • Future work will consider continuously-updated adjustments to forecasts • Prototype for MWD’s SWP-side supplies may be expanded