Metropolitan Transformation and Polycentric Structure in Mexico City


- Slides: 27
Metropolitan Transformation and Polycentric Structure in Mexico City. Identification of Urban Subcenters, 1989 -2009 Adrian Guillermo Aguilar and Josefina Hernández Lozano Institute of Geography, UNAM IGU Urban Commission Meeting, 14 -20 August 2011, Canterbury U. K.
Main Questions: To what extent the metropolitan space of Mexico City presents a policentric structure regarding the spatial distribution of employment? What are the main changes on spatial patterns of urban subcenters in the period 1989 -2009? What are the differences in the spatial dynamic by economic sectors? What areas are winning or losing jobs and what factors seem to explain that situation?
I. Policentrism and Metropolitan Transformation The spatial dynamic indicates a movement of activities from the city center to the periphery that tends to form a “concentrated deconcentration” pattern. Urban subcenters function as nodes articulating space with a relevant employment density and concentration. The urban form of the new clusters change the landscape: corridors, compact subcenters, dispersed activities areas, high rise buldings, etc.
Agglomeration economies play a fundamenal role. The benefits of being close to other activities creates a cluster of bussiness activities that favour each other. A main difficulty is to define a threshold that indicates a significative number of jobs to constitute a subcenter. The traditional CBD normally is still very important. This is valid particularly for activities that need “face to face” contact: financial, commercial, public administration.
II. Urban Expansion in Mexico City. Recent Trends A depopulation of the city center with a dominant tertiarization. A revitalization around: new housing, corporate offices, tourism, commercial activities, etc. A deindustrialization of urban economy with manufacturing spreading towards peripheral locations. Peripheral expansion with high population growth rates, but low and very dispersed employment concentrations.
Figure 2. ZMCM: Employment Growth by Metropolitan Rings, 19892009 14. 00 12. 00 10. 00 Growth Rates 8. 00 COMMERCE 6. 00 MANUFACTURING 4. 00 SERVICES POPULATION 2. 00 0. 00 Central City First Second -2. 00 -4. 00 Metropolitan Rings Third Fourth
700, 000 Figure 1. ZMCM: Employment Growth by Metropolitan Rings, 1989 -2009 600, 000 500, 000 Employment 400, 000 300, 000 200, 000 100, 000 0 CENTRAL CITY FIRST SECOND THIRD -100, 000 -200, 000 COMMERCE Metropolitan Rings SERVICES MANUFACTURING FOURTH
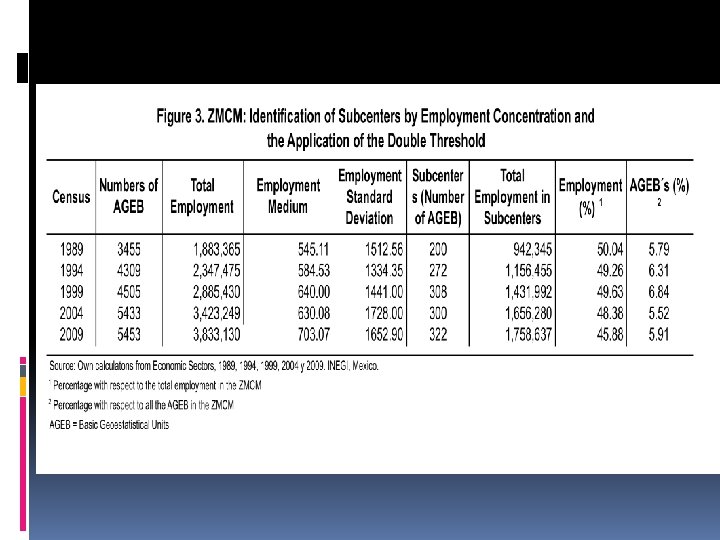
III. Identification of Urban Subcenters The Economic Census was used in the period 19892009; the spatial unit used was the basic geostatistical area (AGEB); data were processed for economic sectors and subsectors. To identify urban subcenters a double threshold method was selected. The AGEBs classified as urban subcenters had to comply to the following criteria: - A concentration of employment superior to the city mean, plus a standard deviation.
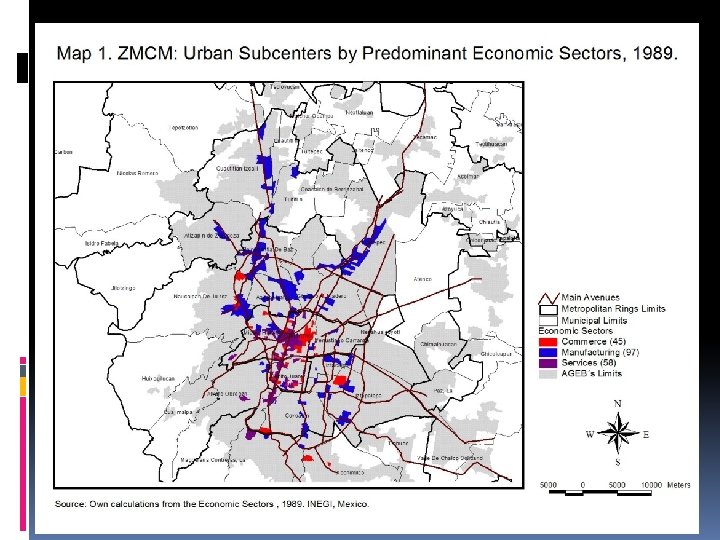
The Central Business District In the period this area concentrated the highest number of subcenters and employment in the city (45%). The presence of services is outstanding in this zone. Employment on services predominates in 66% of the subcenters. Commercial activities show a slow growth; and manufacturing continues to move away from the central city.
The First Ring The first ring had a constant increase of employment, with 41% of all the employment of the identified subcenters. This ring has the most important concentration of manufacturing employment in the city. A marked dispersion trend of services employment to the south of the ring is relevant: Periferico Sur, Insurgentes Ave. Santa Fe.
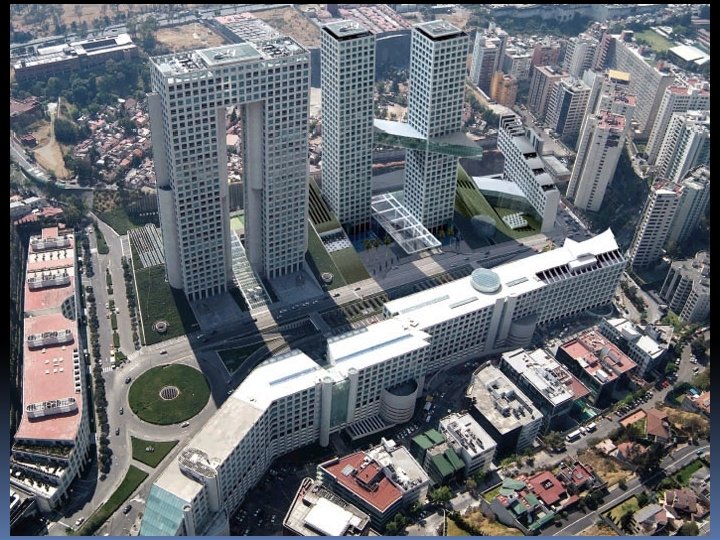
Santa Fe
The Second Ring Employment in the second ring also has an increasing trend, but only contains 10% of all jobs in the city. Manufacturing jobs predominate in number, and subcenters show stability in the north of the city. Service and commercial activities show a similar number but a slow concentration.
Tultitlán Vía Morelos
Plaza Chalco
500, 000 Figure 4. Mexico City Subcenters: Employment Difference by Metropolitan Rings, 1989 -2009 400, 000 200, 000 100, 000 CENTRAL CITY G SE RV IC ES CO M M ER AN CI O UF AC TU RA SE RV IC IO CO M M M AN ER UF CE AC TU RI N G SE RV IC ES UR IN AC T ER CE AN UF CO M M CE S G RV I SE UR IN AC T M AN -100, 000 UF CO M M ER CE 0 M EMPLOYMENT 300, 000 FIRST SECOND THIRD -200, 000 SECTORS AND METROPOLITAN RINGS FOURTH
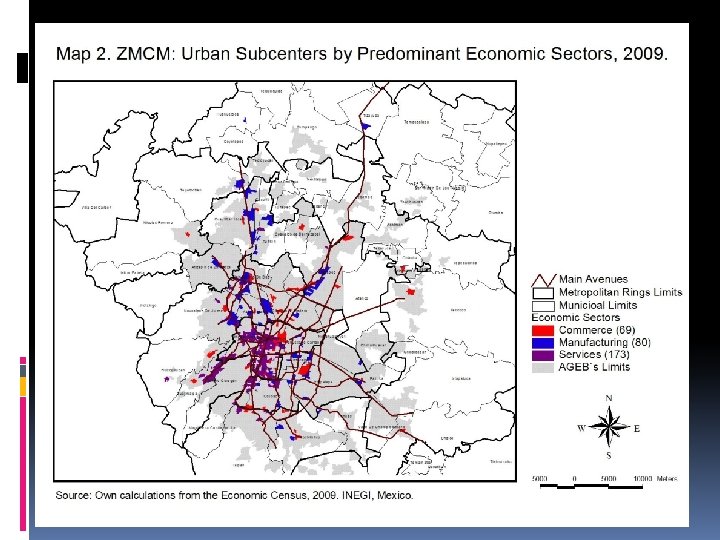
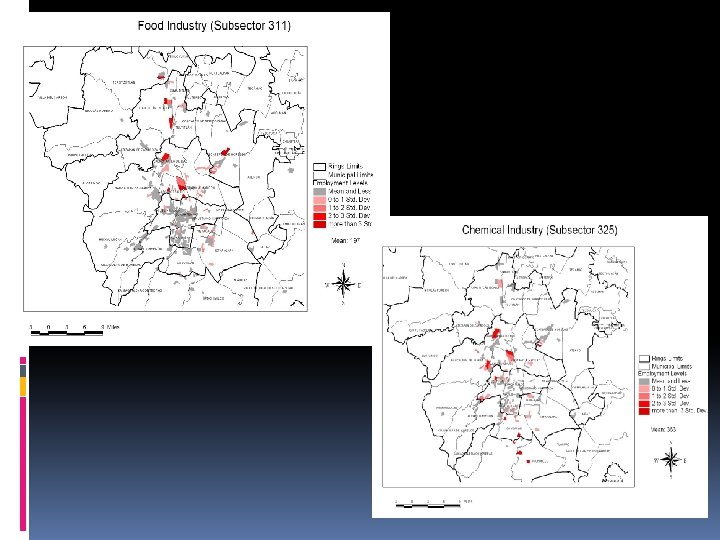
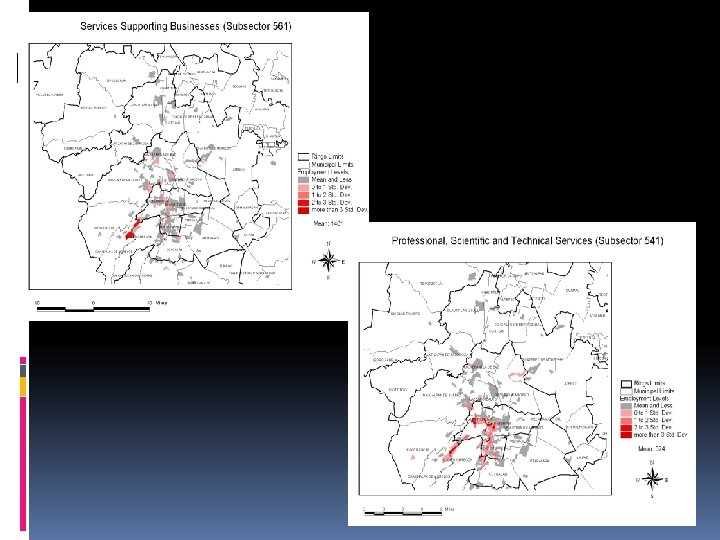
ZMCM: Main Subsectors in Subcenters, 2009 MANUFACTURING 325 Chemical Industry 311 Food Industry 326 Plastic and Rubber Industry TOTAL 68, 650 57, 335 33, 580 393, 230 % 17. 46 14. 58 8. 54 40. 58 SERVICES 561 Services Supporting Businesses 541 Professional, Scientific and Technical Services 722 Services to Prepare Food Beverages TOTAL 461, 314 156, 251 117, 110 1, 060, 150 % 43. 51 14. 74 11. 05 69. 30 COMMERCE 462 Retail in Supermarkets and Departamental Stores Retail of Textiles, Jewellery, Clothes and Shoes 463 Products 461 Retail of Groceries, Food, Beverage, Ice and Tobacco. TOTAL % 64, 187 14. 05 58, 055 12. 71 48, 351 10. 58 456, 865 37. 34
Torre Mayor
Conclusions In the last 25 years there has been a gradual formation of urban subcenters with a “concentrated deconcentration” in compact subcenters and corridors. However this structure is highly restricted: it is relevant for the city center, 1 st and 2 nd rings. But in the 3 rd and 4 th rings the presence of these subcenters is almost unexistant. The central city is still the largest concentration of employment (46%) despite the loss of resident population.
The central city shows a proliferation of subcenters leading to spatial widening of the concentration of activities with larger subcenters. The city centrality of employment has experienced a displacement towards the western and southern zones, with larger areas in each subcenter. The lack of important peripheral economic concentrations shows a lack of balance and equity in the distribution of jobs for the poorer neighborhoods to the northern and eastern areas.