
Metode Harga Pokok Proses I PERTEMUAN IV Dr

- Slides: 152
Metode Harga Pokok Proses I PERTEMUAN IV Dr Rilla Gantino, SE. , Ak. , MM Program Studi Akuntansi - FEB
KEMAMPUAN AKHIR YANG DIHARAPKAN • Mampu menjelaskan dan mengimplementasikan perhitungan harga pokok produk yang dihasilkan secara massa jika diolah melalui satu dan beberapa departemen produksi.
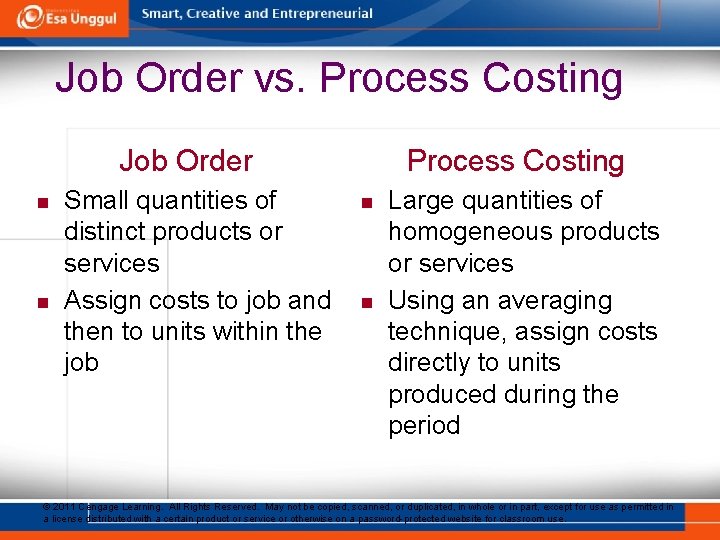
Job Order vs. Process Costing Job Order n n Small quantities of distinct products or services Assign costs to job and then to units within the job Process Costing n n Large quantities of homogeneous products or services Using an averaging technique, assign costs directly to units produced during the period © 2011 Cengage Learning. All Rights Reserved. May not be copied, scanned, or duplicated, in whole or in part, except for use as permitted in a license distributed with a certain product or service or otherwise on a password-protected website for classroom use.
Process Costing n Averaging technique to assign costs to units produced Unit Cost = Production Costs Production Quantity © 2011 Cengage Learning. All Rights Reserved. May not be copied, scanned, or duplicated, in whole or in part, except for use as permitted in a license distributed with a certain product or service or otherwise on a password-protected website for classroom use.
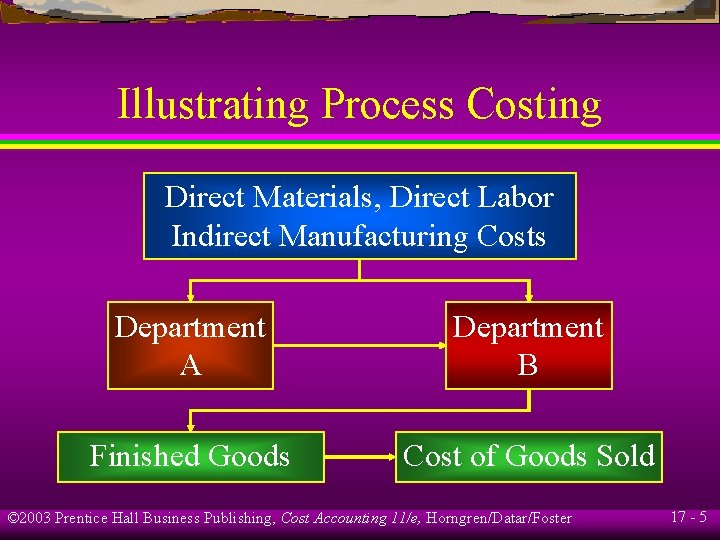
Illustrating Process Costing Direct Materials, Direct Labor Indirect Manufacturing Costs Department A Department B Finished Goods Cost of Goods Sold © 2003 Prentice Hall Business Publishing, Cost Accounting 11/e, Horngren/Datar/Foster 17 - 5
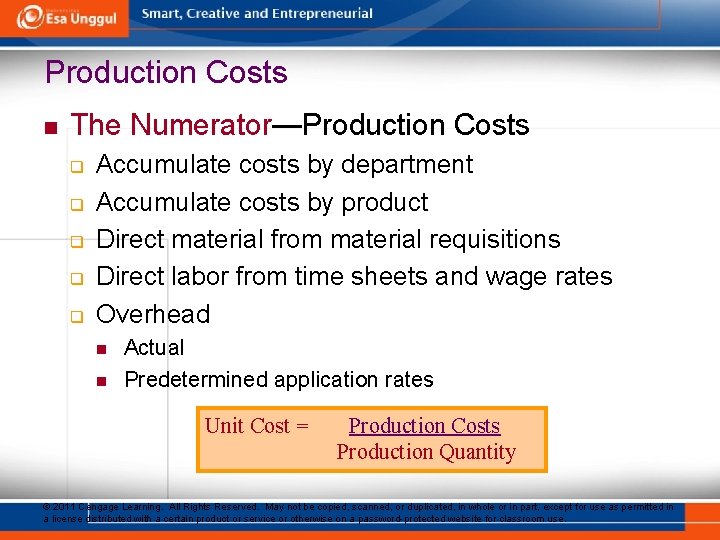
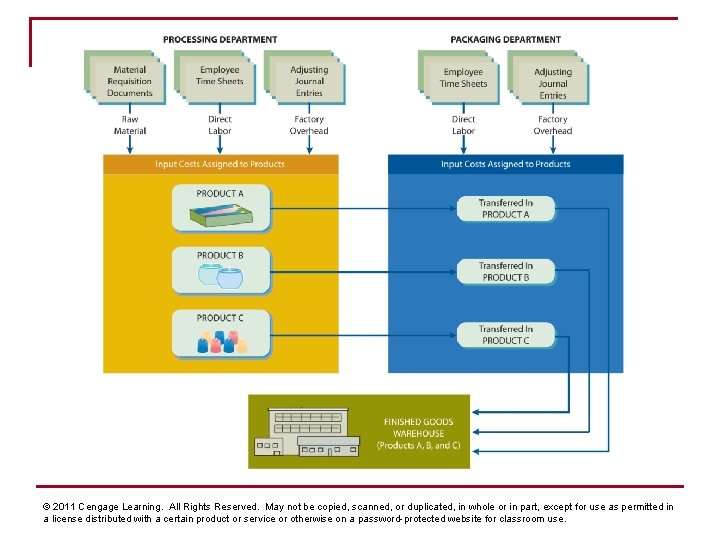
Production Costs n The Numerator—Production Costs q q q Accumulate costs by department Accumulate costs by product Direct material from material requisitions Direct labor from time sheets and wage rates Overhead n n Actual Predetermined application rates Unit Cost = Production Costs Production Quantity © 2011 Cengage Learning. All Rights Reserved. May not be copied, scanned, or duplicated, in whole or in part, except for use as permitted in a license distributed with a certain product or service or otherwise on a password-protected website for classroom use.
© 2011 Cengage Learning. All Rights Reserved. May not be copied, scanned, or duplicated, in whole or in part, except for use as permitted in a license distributed with a certain product or service or otherwise on a password-protected website for classroom use.
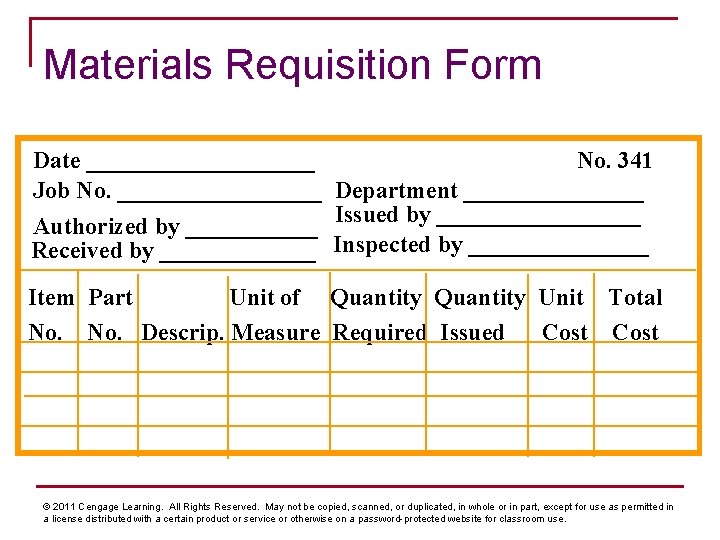
Materials Requisition Form Date __________ No. 341 Job No. _________ Department ________ Authorized by ______ Issued by _________ Received by _______ Inspected by ________ Item Part Unit of Quantity Unit Total No. Descrip. Measure Required Issued Cost © 2011 Cengage Learning. All Rights Reserved. May not be copied, scanned, or duplicated, in whole or in part, except for use as permitted in a license distributed with a certain product or service or otherwise on a password-protected website for classroom use.
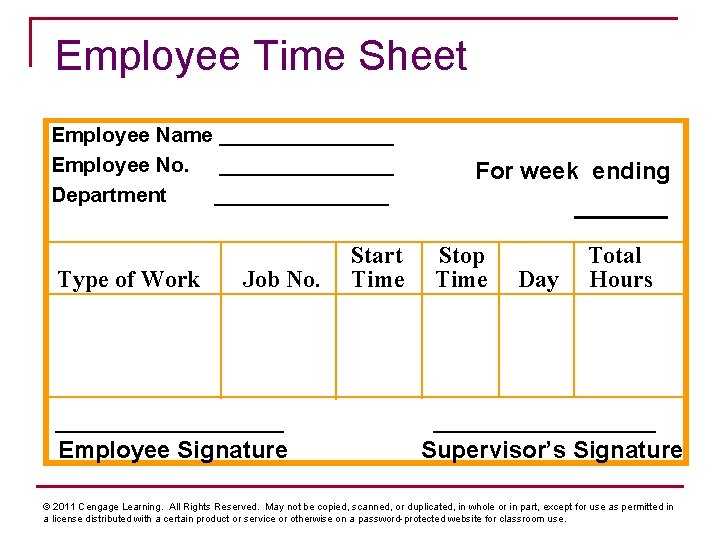
Employee Time Sheet Employee Name ________ Employee No. ________ Department ________ Type of Work Job No. Employee Signature Start Time For week ending _______ Stop Time Day Total Hours Supervisor’s Signature © 2011 Cengage Learning. All Rights Reserved. May not be copied, scanned, or duplicated, in whole or in part, except for use as permitted in a license distributed with a certain product or service or otherwise on a password-protected website for classroom use.
Units Produced n n The Denominator—Units Produced Complicated by work in process q q n Units started last period and completed this period Units started this period and not completed Convert partially completed units to equivalent whole units Unit Cost = Production Costs Production Quantity © 2011 Cengage Learning. All Rights Reserved. May not be copied, scanned, or duplicated, in whole or in part, except for use as permitted in a license distributed with a certain product or service or otherwise on a password-protected website for classroom use.
Equivalent Units of Production n n Approximation of the number of whole units of output that could have been produced from the actual effort expended Includes units q q q n Started last period and finished this period Started this period and not finished Assumes FIFO physical flow through the production department © 2011 Cengage Learning. All Rights Reserved. May not be copied, scanned, or duplicated, in whole or in part, except for use as permitted in a license distributed with a certain product or service or otherwise on a password-protected website for classroom use.
© 2011 Cengage Learning. All Rights Reserved. May not be copied, scanned, or duplicated, in whole or in part, except for use as permitted in a license distributed with a certain product or service or otherwise on a password-protected website for classroom use.
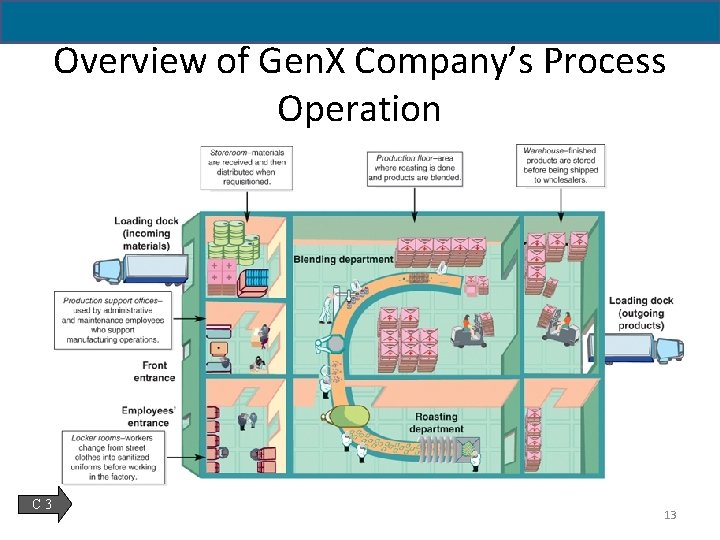
Overview of Gen. X Company’s Process Operation C 3 13
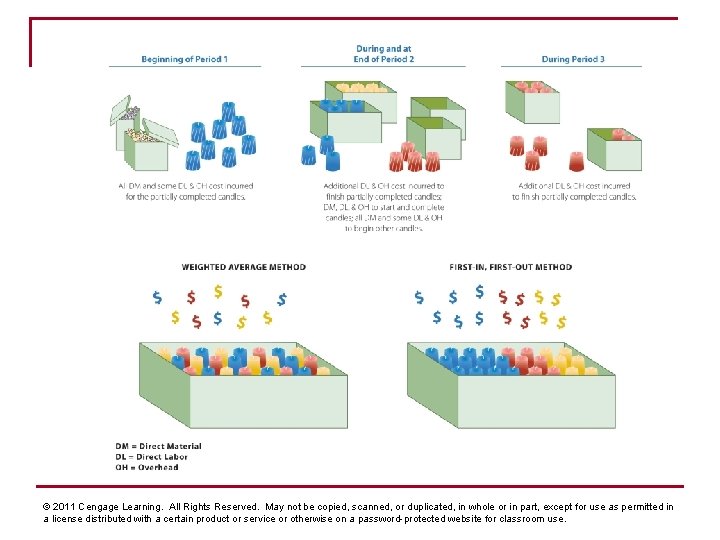
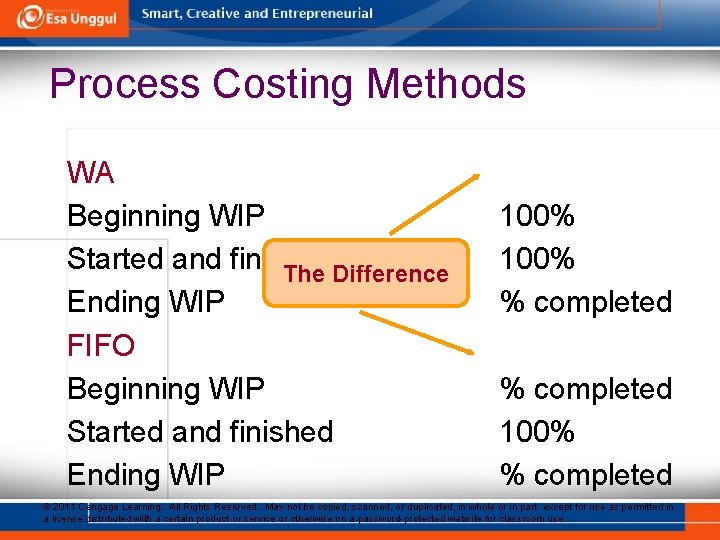
Process Costing Methods WA Beginning WIP Started and finished The Difference Ending WIP FIFO Beginning WIP Started and finished Ending WIP 100% % completed © 2011 Cengage Learning. All Rights Reserved. May not be copied, scanned, or duplicated, in whole or in part, except for use as permitted in a license distributed with a certain product or service or otherwise on a password-protected website for classroom use.
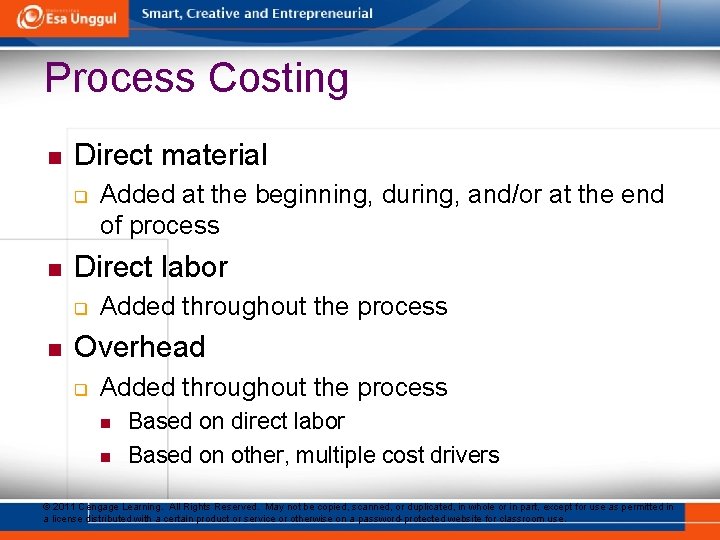
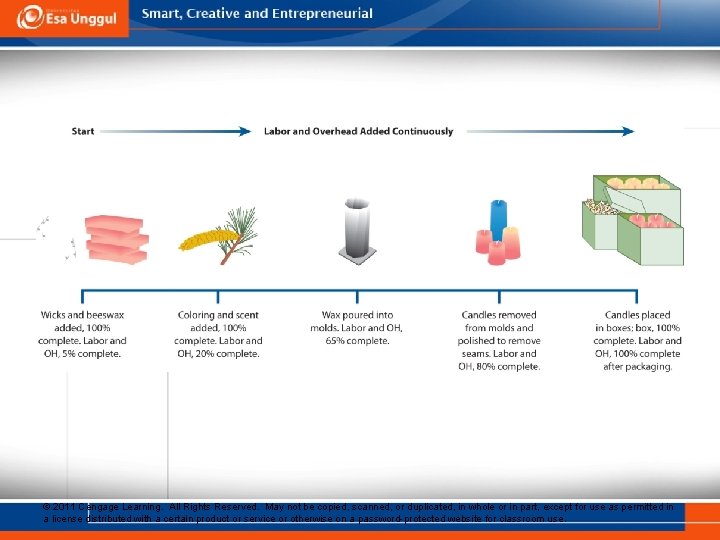
Process Costing n Direct material q n Direct labor q n Added at the beginning, during, and/or at the end of process Added throughout the process Overhead q Added throughout the process n n Based on direct labor Based on other, multiple cost drivers © 2011 Cengage Learning. All Rights Reserved. May not be copied, scanned, or duplicated, in whole or in part, except for use as permitted in a license distributed with a certain product or service or otherwise on a password-protected website for classroom use.
© 2011 Cengage Learning. All Rights Reserved. May not be copied, scanned, or duplicated, in whole or in part, except for use as permitted in a license distributed with a certain product or service or otherwise on a password-protected website for classroom use.
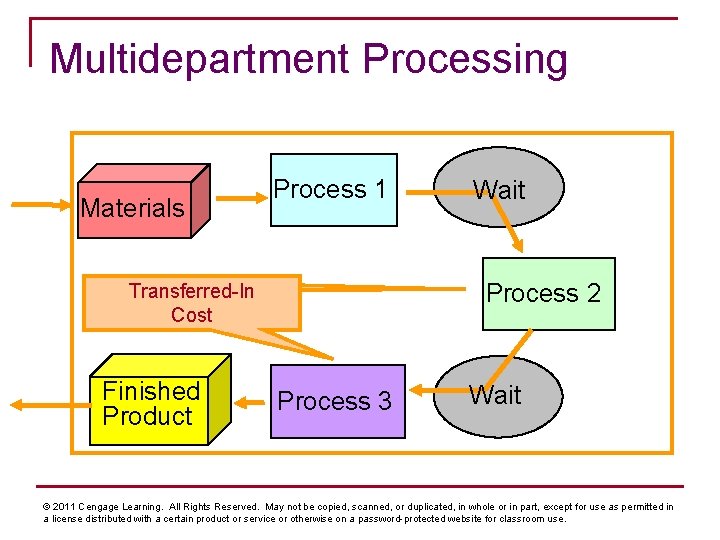
Multidepartment Processing Materials Process 1 Process 2 Transferred-In Cost Finished Product Wait Process 3 Wait © 2011 Cengage Learning. All Rights Reserved. May not be copied, scanned, or duplicated, in whole or in part, except for use as permitted in a license distributed with a certain product or service or otherwise on a password-protected website for classroom use.
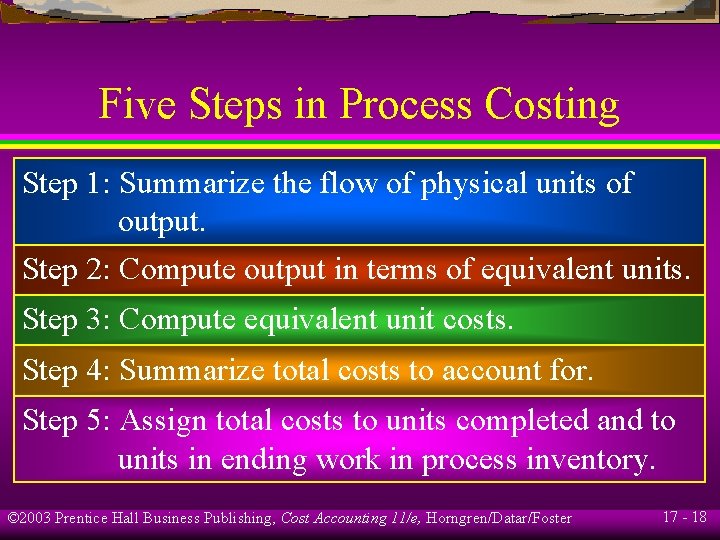
Five Steps in Process Costing Step 1: Summarize the flow of physical units of output. Step 2: Compute output in terms of equivalent units. Step 3: Compute equivalent unit costs. Step 4: Summarize total costs to account for. Step 5: Assign total costs to units completed and to units in ending work in process inventory. © 2003 Prentice Hall Business Publishing, Cost Accounting 11/e, Horngren/Datar/Foster 17 - 18
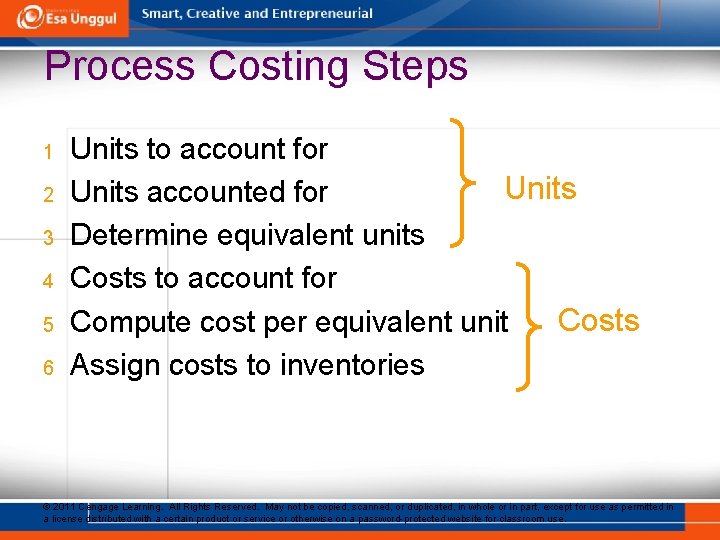
Process Costing Steps 1 2 3 4 5 6 Units to account for Units accounted for Determine equivalent units Costs to account for Costs Compute cost per equivalent unit Assign costs to inventories © 2011 Cengage Learning. All Rights Reserved. May not be copied, scanned, or duplicated, in whole or in part, except for use as permitted in a license distributed with a certain product or service or otherwise on a password-protected website for classroom use.
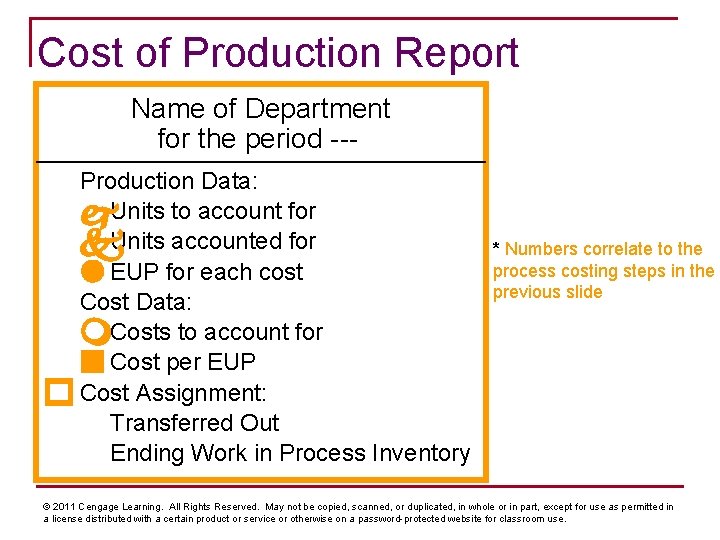
Cost of Production Report Name of Department for the period --Production Data: Units to account for Units accounted for EUP for each cost Cost Data: Costs to account for Cost per EUP Cost Assignment: Transferred Out Ending Work in Process Inventory * Numbers correlate to the process costing steps in the previous slide © 2011 Cengage Learning. All Rights Reserved. May not be copied, scanned, or duplicated, in whole or in part, except for use as permitted in a license distributed with a certain product or service or otherwise on a password-protected website for classroom use.
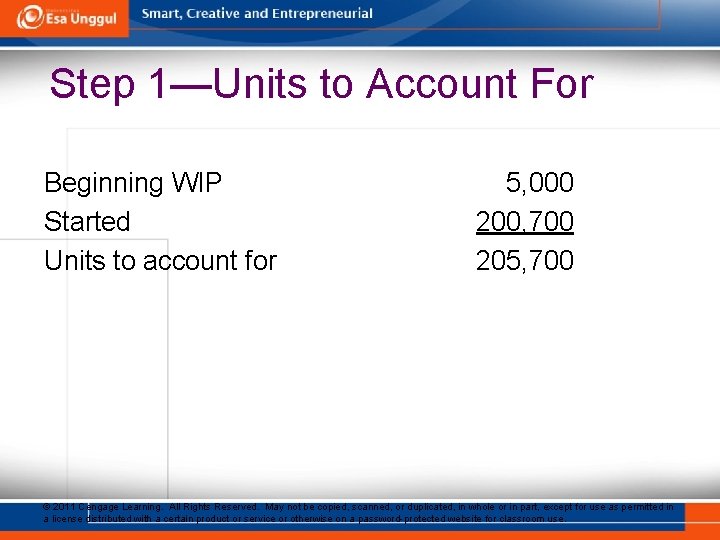
Step 1—Units to Account For Beginning WIP Started Units to account for 5, 000 200, 700 205, 700 © 2011 Cengage Learning. All Rights Reserved. May not be copied, scanned, or duplicated, in whole or in part, except for use as permitted in a license distributed with a certain product or service or otherwise on a password-protected website for classroom use.
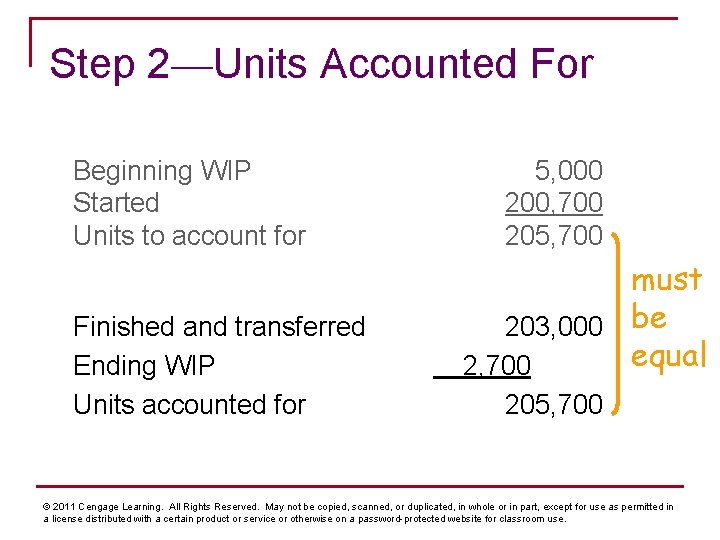
Step 2—Units Accounted For Beginning WIP Started Units to account for Finished and transferred Ending WIP Units accounted for 5, 000 200, 700 205, 700 must 203, 000 be equal 2, 700 205, 700 © 2011 Cengage Learning. All Rights Reserved. May not be copied, scanned, or duplicated, in whole or in part, except for use as permitted in a license distributed with a certain product or service or otherwise on a password-protected website for classroom use.
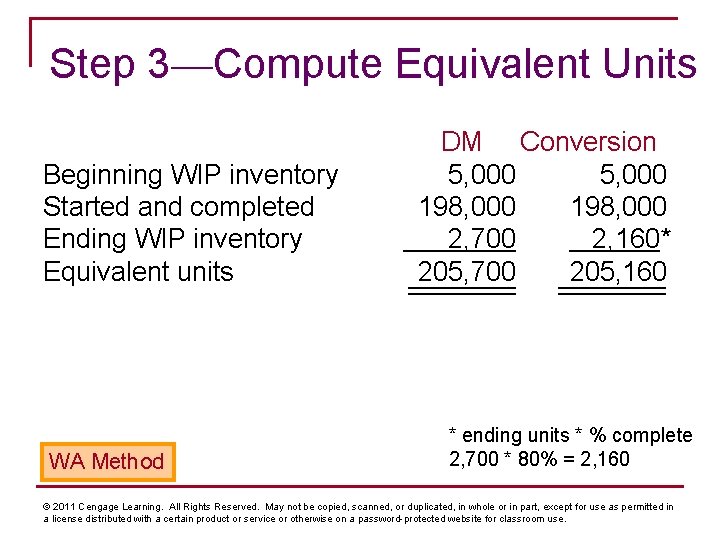
Step 3—Compute Equivalent Units Beginning WIP inventory Started and completed Ending WIP inventory Equivalent units WA Method DM Conversion 5, 000 198, 000 2, 700 2, 160* 205, 700 205, 160 * ending units * % complete 2, 700 * 80% = 2, 160 © 2011 Cengage Learning. All Rights Reserved. May not be copied, scanned, or duplicated, in whole or in part, except for use as permitted in a license distributed with a certain product or service or otherwise on a password-protected website for classroom use.
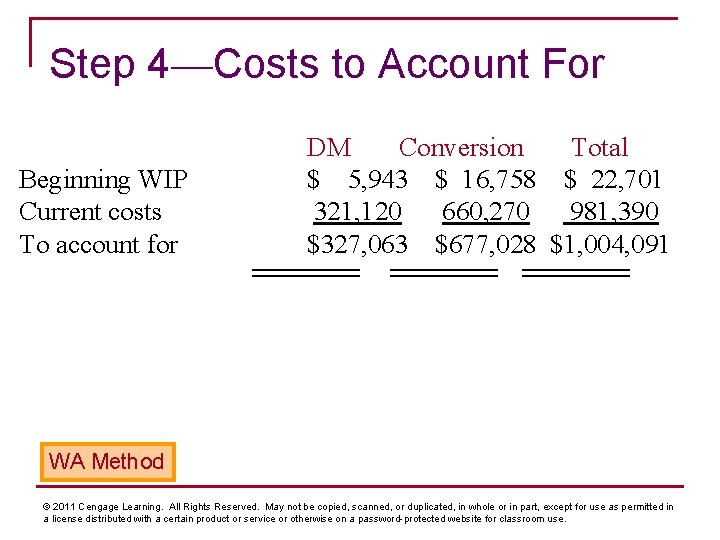
Step 4—Costs to Account For Beginning WIP Current costs To account for DM Conversion Total $ 5, 943 $ 16, 758 $ 22, 701 321, 120 660, 270 981, 390 $327, 063 $677, 028 $1, 004, 091 WA Method © 2011 Cengage Learning. All Rights Reserved. May not be copied, scanned, or duplicated, in whole or in part, except for use as permitted in a license distributed with a certain product or service or otherwise on a password-protected website for classroom use.
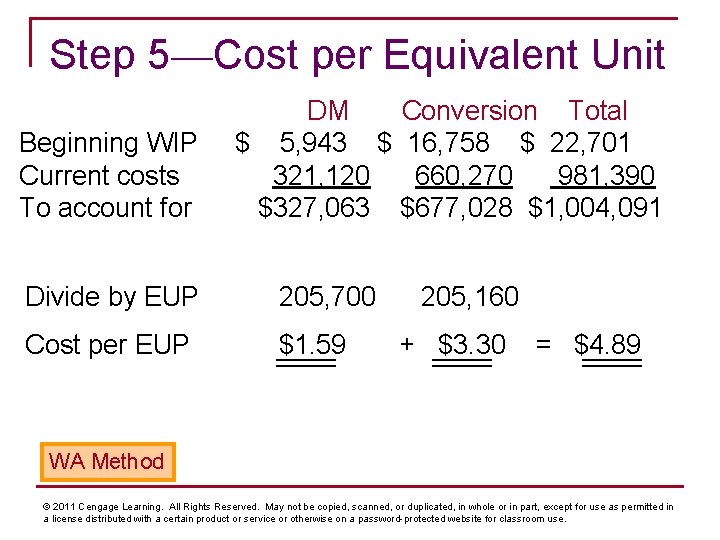
Step 5—Cost per Equivalent Unit Beginning WIP Current costs To account for DM Conversion Total $ 5, 943 $ 16, 758 $ 22, 701 321, 120 660, 270 981, 390 $327, 063 $677, 028 $1, 004, 091 Divide by EUP 205, 700 Cost per EUP $1. 59 205, 160 + $3. 30 = $4. 89 WA Method © 2011 Cengage Learning. All Rights Reserved. May not be copied, scanned, or duplicated, in whole or in part, except for use as permitted in a license distributed with a certain product or service or otherwise on a password-protected website for classroom use.
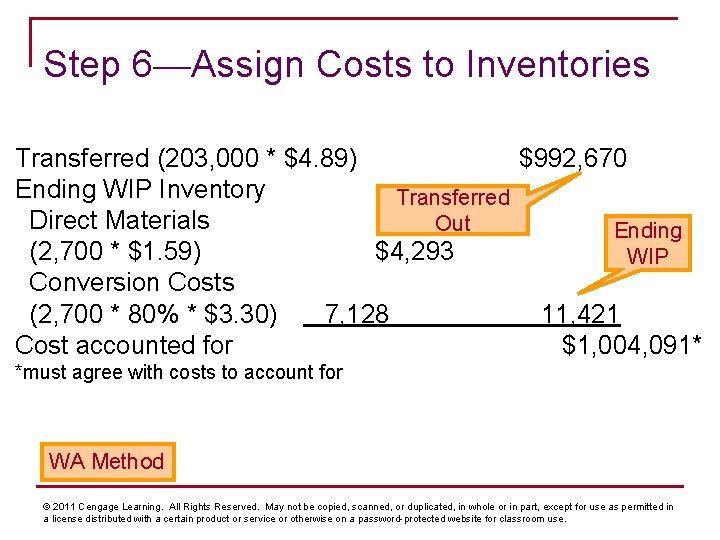
Step 6—Assign Costs to Inventories Transferred (203, 000 * $4. 89) $992, 670 Ending WIP Inventory Transferred Direct Materials Out Ending (2, 700 * $1. 59) $4, 293 WIP Conversion Costs (2, 700 * 80% * $3. 30) 7, 128 11, 421 Cost accounted for $1, 004, 091* *must agree with costs to account for WA Method © 2011 Cengage Learning. All Rights Reserved. May not be copied, scanned, or duplicated, in whole or in part, except for use as permitted in a license distributed with a certain product or service or otherwise on a password-protected website for classroom use.
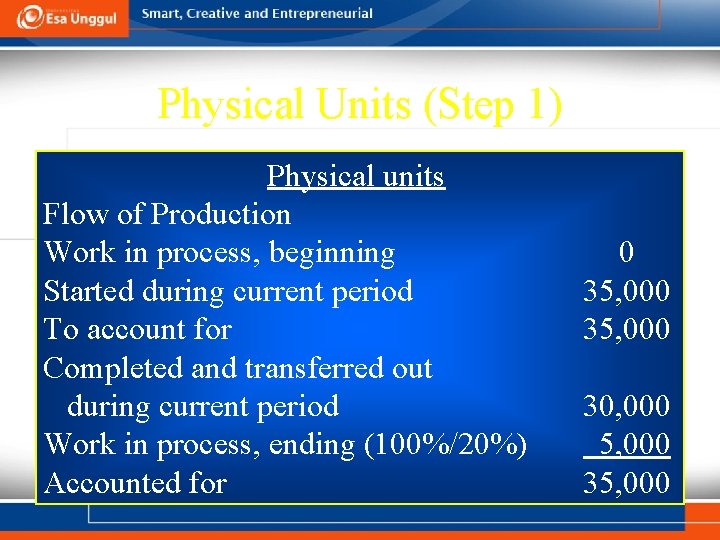
Physical Units (Step 1) Physical units Flow of Production Work in process, beginning Started during current period To account for Completed and transferred out during current period Work in process, ending (100%/20%) Accounted for © 2003 Prentice Hall Business Publishing, Cost Accounting 11/e, Horngren/Datar/Foster 0 35, 000 30, 000 5, 000 35, 000 17 - 27
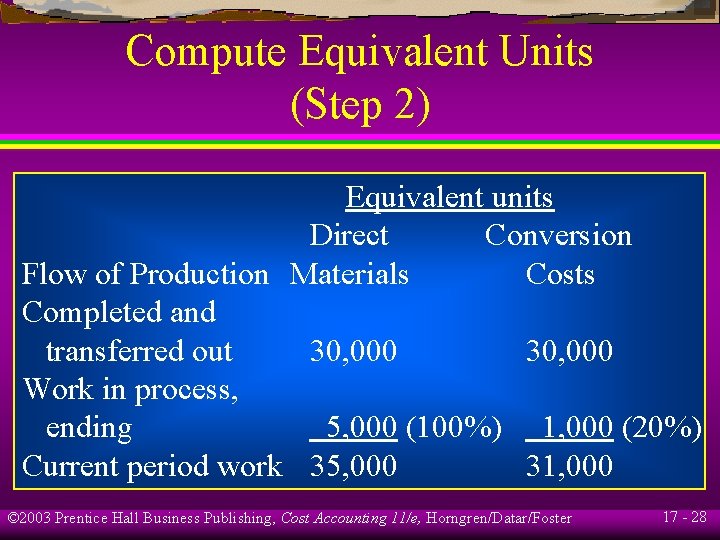
Compute Equivalent Units (Step 2) Equivalent units Direct Conversion Flow of Production Materials Costs Completed and transferred out 30, 000 Work in process, ending 5, 000 (100%) 1, 000 (20%) Current period work 35, 000 31, 000 © 2003 Prentice Hall Business Publishing, Cost Accounting 11/e, Horngren/Datar/Foster 17 - 28
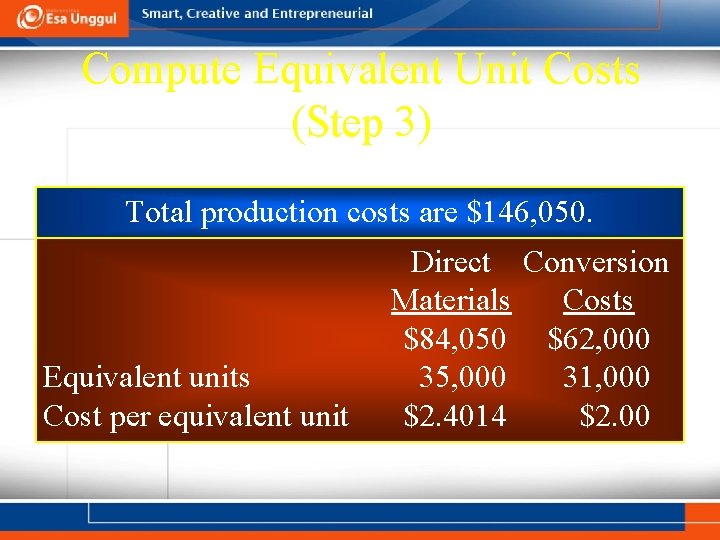
Compute Equivalent Unit Costs (Step 3) Total production costs are $146, 050. Equivalent units Cost per equivalent unit Direct Conversion Materials Costs $84, 050 $62, 000 35, 000 31, 000 $2. 4014 $2. 00 © 2003 Prentice Hall Business Publishing, Cost Accounting 11/e, Horngren/Datar/Foster 17 - 29
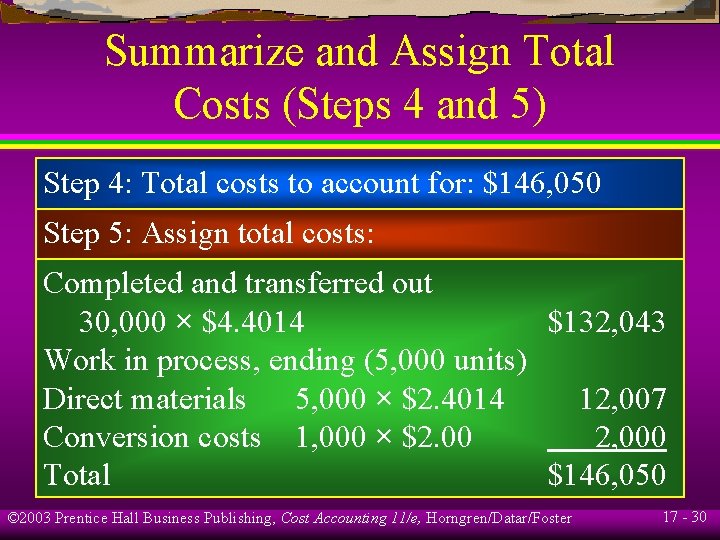
Summarize and Assign Total Costs (Steps 4 and 5) Step 4: Total costs to account for: $146, 050 Step 5: Assign total costs: Completed and transferred out 30, 000 × $4. 4014 $132, 043 Work in process, ending (5, 000 units) Direct materials 5, 000 × $2. 4014 12, 007 Conversion costs 1, 000 × $2. 00 2, 000 Total $146, 050 © 2003 Prentice Hall Business Publishing, Cost Accounting 11/e, Horngren/Datar/Foster 17 - 30
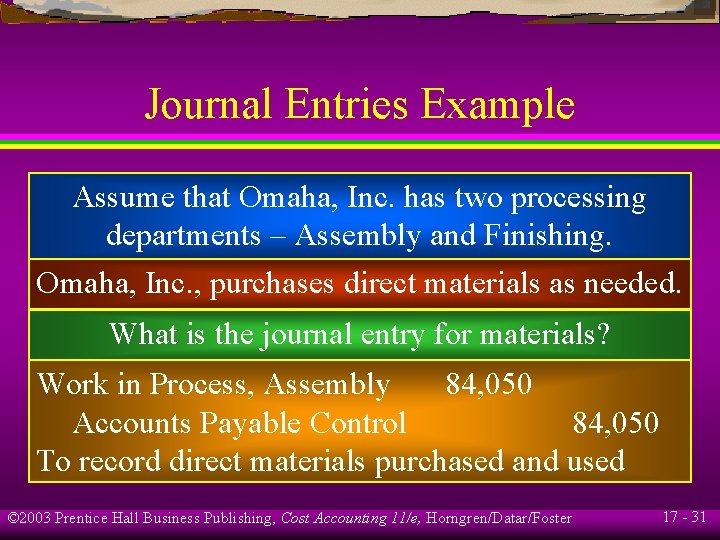
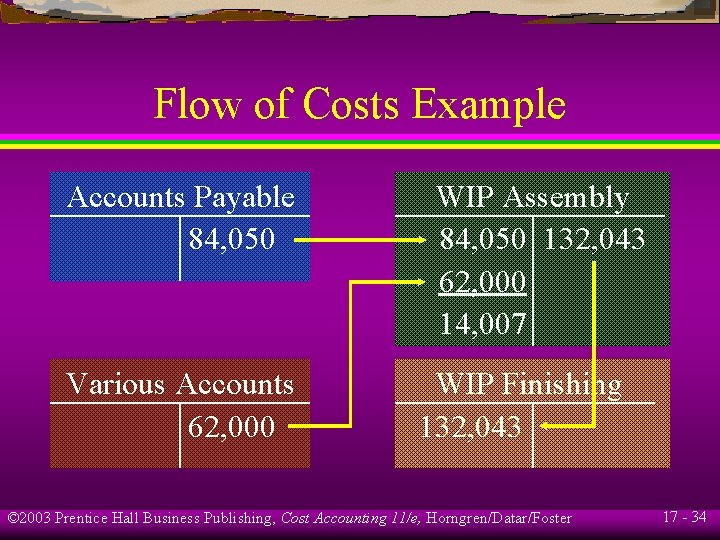
Journal Entries Example Assume that Omaha, Inc. has two processing departments – Assembly and Finishing. Omaha, Inc. , purchases direct materials as needed. What is the journal entry for materials? Work in Process, Assembly 84, 050 Accounts Payable Control 84, 050 To record direct materials purchased and used © 2003 Prentice Hall Business Publishing, Cost Accounting 11/e, Horngren/Datar/Foster 17 - 31
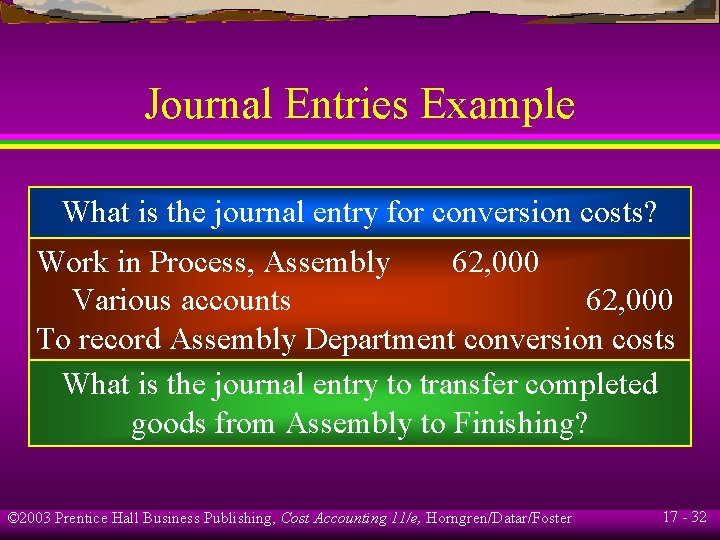
Journal Entries Example What is the journal entry for conversion costs? Work in Process, Assembly 62, 000 Various accounts 62, 000 To record Assembly Department conversion costs What is the journal entry to transfer completed goods from Assembly to Finishing? © 2003 Prentice Hall Business Publishing, Cost Accounting 11/e, Horngren/Datar/Foster 17 - 32
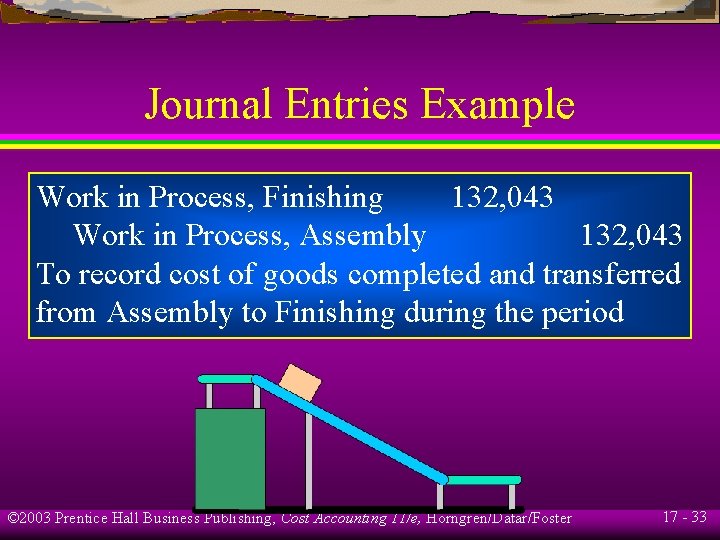
Journal Entries Example Work in Process, Finishing 132, 043 Work in Process, Assembly 132, 043 To record cost of goods completed and transferred from Assembly to Finishing during the period © 2003 Prentice Hall Business Publishing, Cost Accounting 11/e, Horngren/Datar/Foster 17 - 33
Flow of Costs Example Accounts Payable 84, 050 Various Accounts 62, 000 WIP Assembly 84, 050 132, 043 62, 000 14, 007 WIP Finishing 132, 043 © 2003 Prentice Hall Business Publishing, Cost Accounting 11/e, Horngren/Datar/Foster 17 - 34
Learning Objective 5 Use the weighted-average method of process costing. © 2003 Prentice Hall Business Publishing, Cost Accounting 11/e, Horngren/Datar/Foster 17 - 35
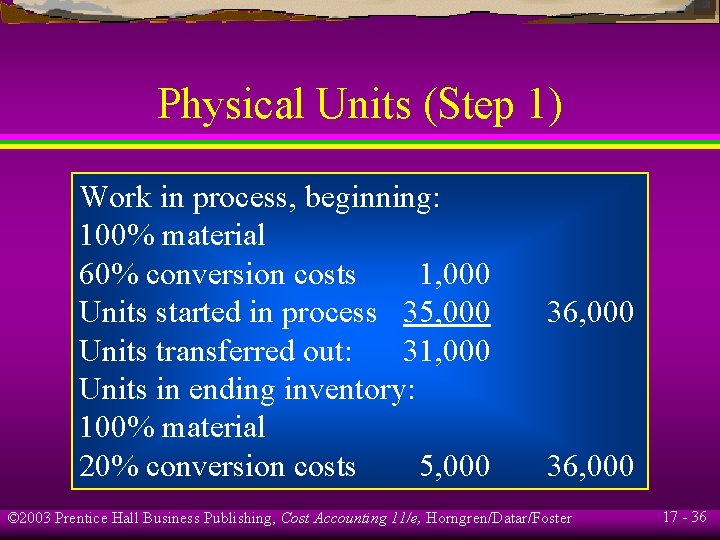
Physical Units (Step 1) Work in process, beginning: 100% material 60% conversion costs 1, 000 Units started in process 35, 000 Units transferred out: 31, 000 Units in ending inventory: 100% material 20% conversion costs 5, 000 36, 000 © 2003 Prentice Hall Business Publishing, Cost Accounting 11/e, Horngren/Datar/Foster 17 - 36
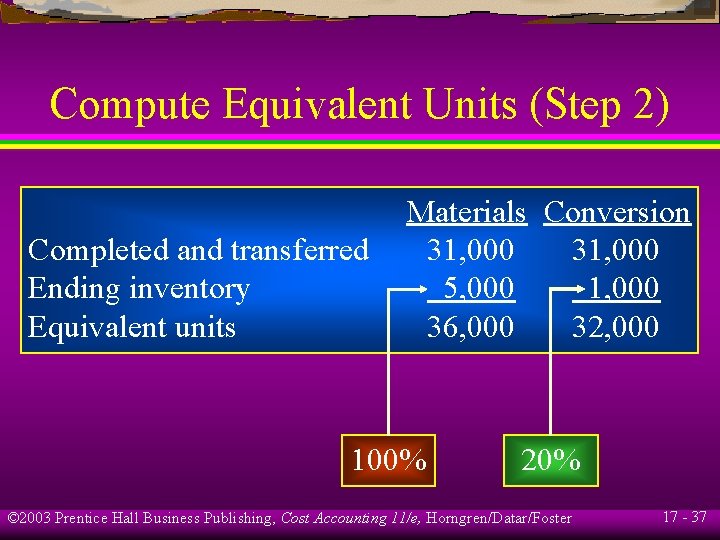
Compute Equivalent Units (Step 2) Completed and transferred Ending inventory Equivalent units Materials Conversion 31, 000 5, 000 1, 000 36, 000 32, 000 100% 20% © 2003 Prentice Hall Business Publishing, Cost Accounting 11/e, Horngren/Datar/Foster 17 - 37
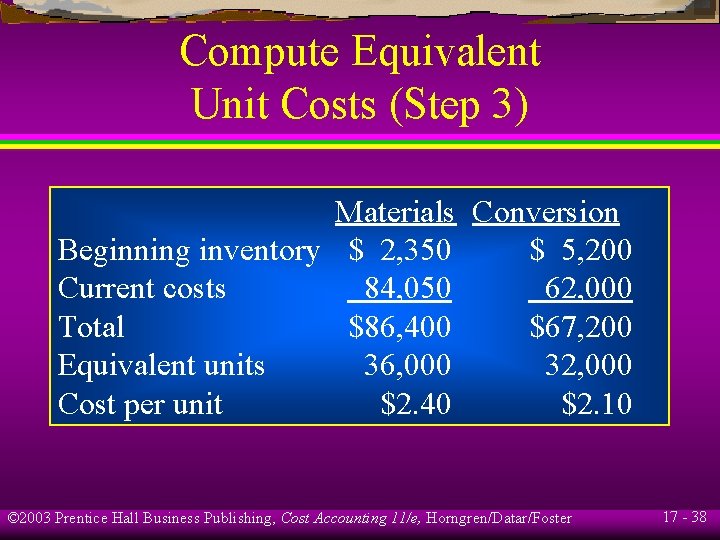
Compute Equivalent Unit Costs (Step 3) Materials Conversion Beginning inventory $ 2, 350 $ 5, 200 Current costs 84, 050 62, 000 Total $86, 400 $67, 200 Equivalent units 36, 000 32, 000 Cost per unit $2. 40 $2. 10 © 2003 Prentice Hall Business Publishing, Cost Accounting 11/e, Horngren/Datar/Foster 17 - 38
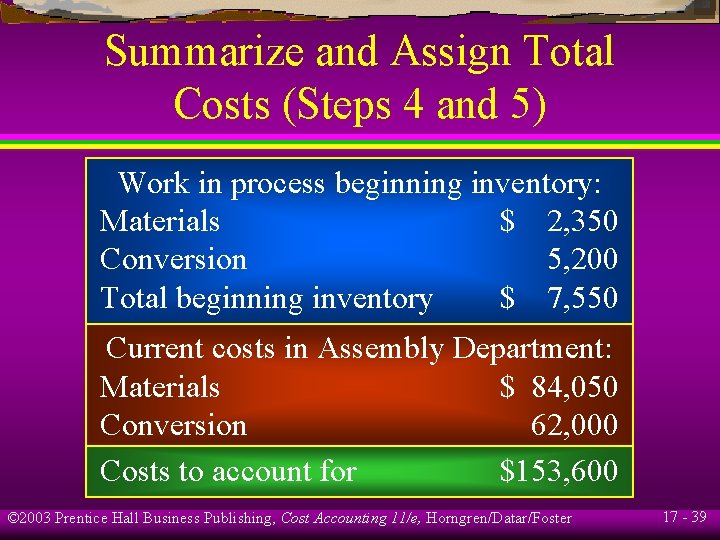
Summarize and Assign Total Costs (Steps 4 and 5) Work in process beginning inventory: Materials $ 2, 350 Conversion 5, 200 Total beginning inventory $ 7, 550 Current costs in Assembly Department: Materials $ 84, 050 Conversion 62, 000 Costs to account for $153, 600 © 2003 Prentice Hall Business Publishing, Cost Accounting 11/e, Horngren/Datar/Foster 17 - 39
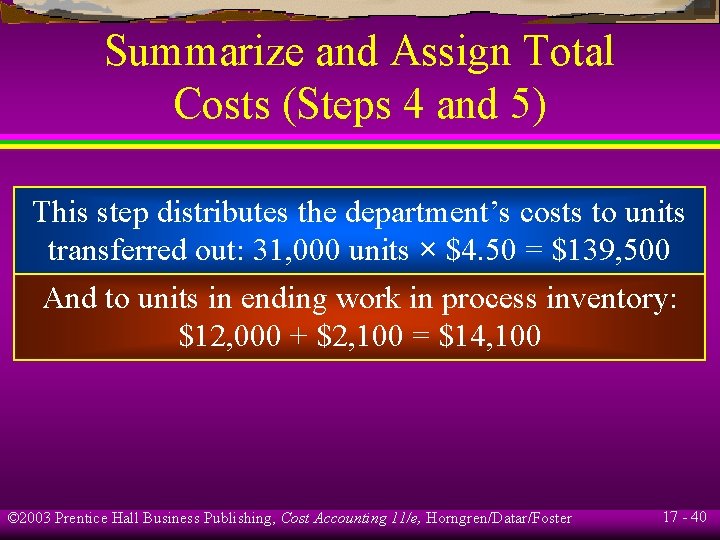
Summarize and Assign Total Costs (Steps 4 and 5) This step distributes the department’s costs to units transferred out: 31, 000 units × $4. 50 = $139, 500 And to units in ending work in process inventory: $12, 000 + $2, 100 = $14, 100 © 2003 Prentice Hall Business Publishing, Cost Accounting 11/e, Horngren/Datar/Foster 17 - 40
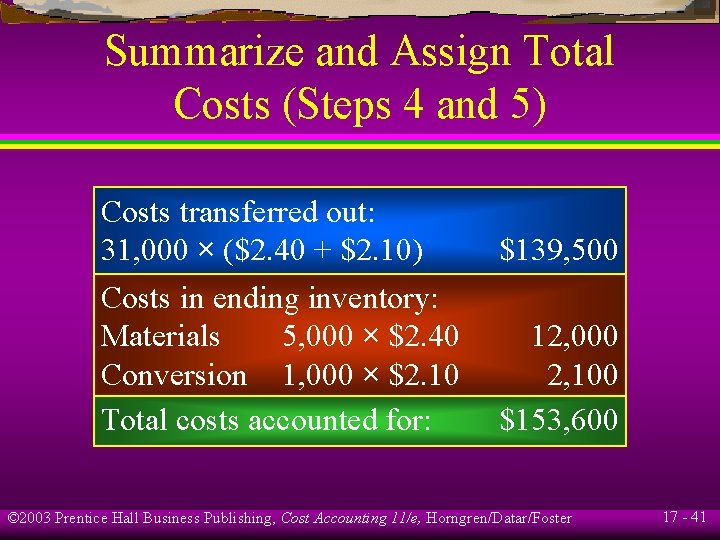
Summarize and Assign Total Costs (Steps 4 and 5) Costs transferred out: 31, 000 × ($2. 40 + $2. 10) Costs in ending inventory: Materials 5, 000 × $2. 40 Conversion 1, 000 × $2. 10 Total costs accounted for: $139, 500 12, 000 2, 100 $153, 600 © 2003 Prentice Hall Business Publishing, Cost Accounting 11/e, Horngren/Datar/Foster 17 - 41
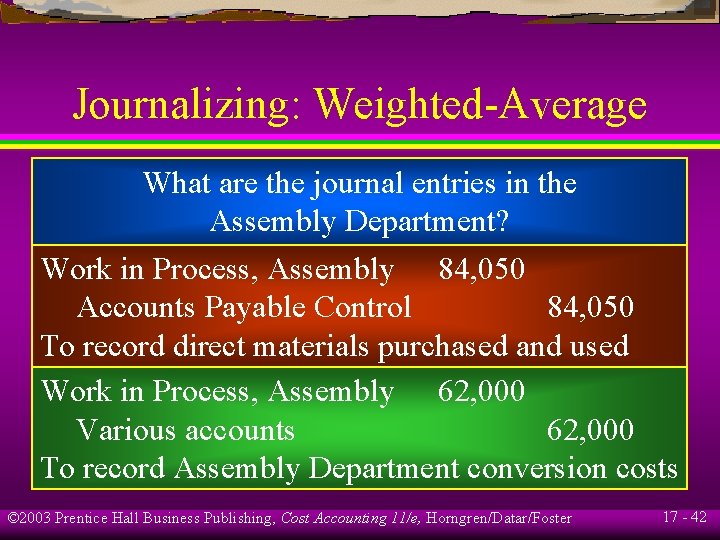
Journalizing: Weighted-Average What are the journal entries in the Assembly Department? Work in Process, Assembly 84, 050 Accounts Payable Control 84, 050 To record direct materials purchased and used Work in Process, Assembly 62, 000 Various accounts 62, 000 To record Assembly Department conversion costs © 2003 Prentice Hall Business Publishing, Cost Accounting 11/e, Horngren/Datar/Foster 17 - 42
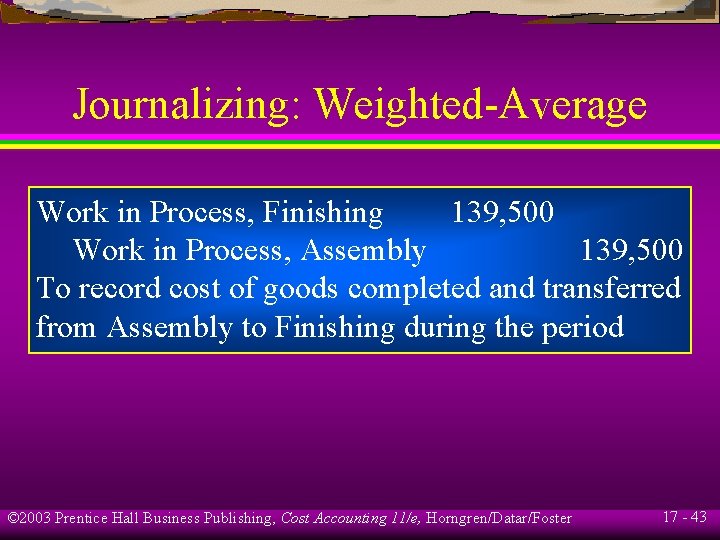
Journalizing: Weighted-Average Work in Process, Finishing 139, 500 Work in Process, Assembly 139, 500 To record cost of goods completed and transferred from Assembly to Finishing during the period © 2003 Prentice Hall Business Publishing, Cost Accounting 11/e, Horngren/Datar/Foster 17 - 43
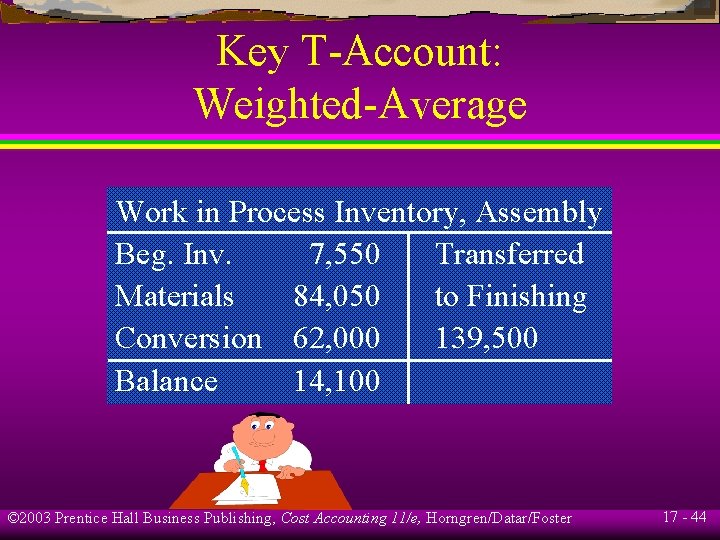
Key T-Account: Weighted-Average Work in Process Inventory, Assembly Beg. Inv. 7, 550 Transferred Materials 84, 050 to Finishing Conversion 62, 000 139, 500 Balance 14, 100 © 2003 Prentice Hall Business Publishing, Cost Accounting 11/e, Horngren/Datar/Foster 17 - 44
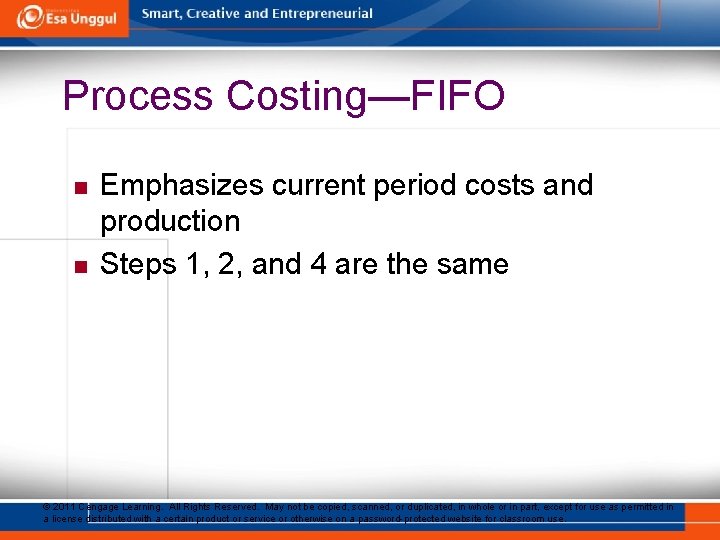
Process Costing—FIFO n n Emphasizes current period costs and production Steps 1, 2, and 4 are the same © 2011 Cengage Learning. All Rights Reserved. May not be copied, scanned, or duplicated, in whole or in part, except for use as permitted in a license distributed with a certain product or service or otherwise on a password-protected website for classroom use.
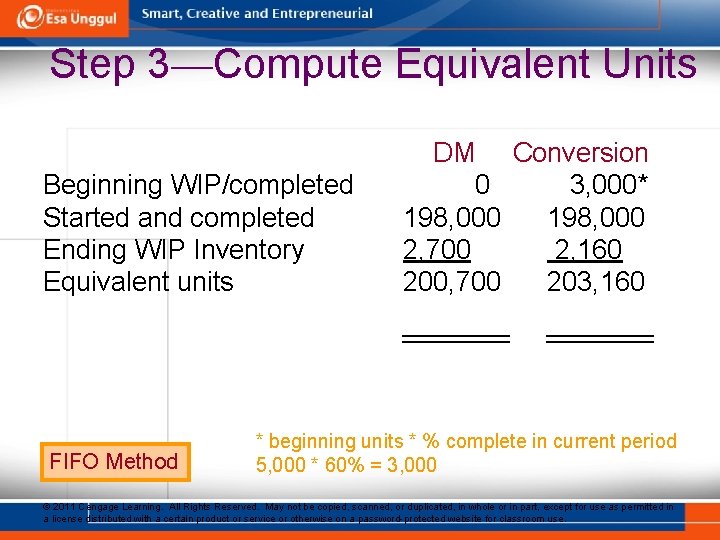
Step 3—Compute Equivalent Units DM Beginning WIP/completed Started and completed Ending WIP Inventory Equivalent units FIFO Method Conversion 0 3, 000* 198, 000 2, 700 2, 160 200, 700 203, 160 * beginning units * % complete in current period 5, 000 * 60% = 3, 000 © 2011 Cengage Learning. All Rights Reserved. May not be copied, scanned, or duplicated, in whole or in part, except for use as permitted in a license distributed with a certain product or service or otherwise on a password-protected website for classroom use.
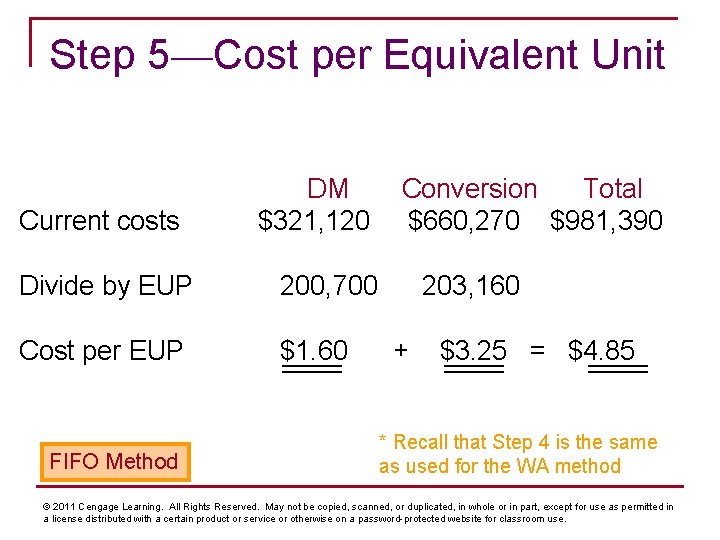
Step 5—Cost per Equivalent Unit Current costs DM $321, 120 Divide by EUP 200, 700 Cost per EUP $1. 60 FIFO Method Conversion Total $660, 270 $981, 390 203, 160 + $3. 25 = $4. 85 * Recall that Step 4 is the same as used for the WA method © 2011 Cengage Learning. All Rights Reserved. May not be copied, scanned, or duplicated, in whole or in part, except for use as permitted in a license distributed with a certain product or service or otherwise on a password-protected website for classroom use.
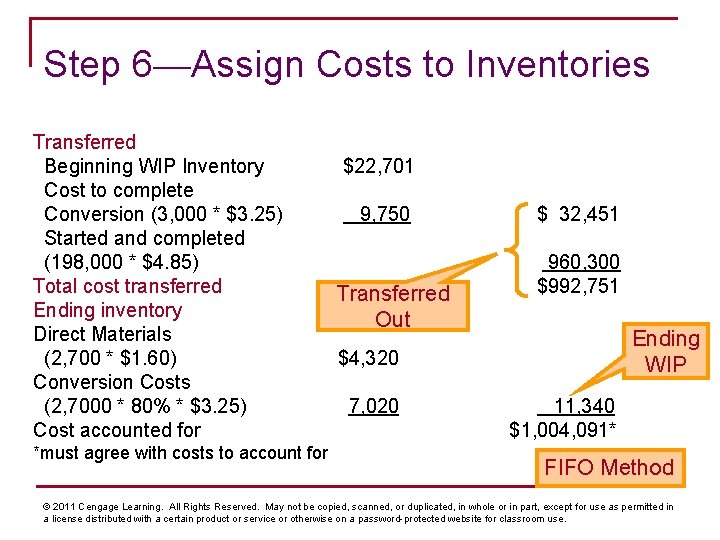
Step 6—Assign Costs to Inventories Transferred Beginning WIP Inventory Cost to complete Conversion (3, 000 * $3. 25) Started and completed (198, 000 * $4. 85) Total cost transferred Ending inventory Direct Materials (2, 700 * $1. 60) Conversion Costs (2, 7000 * 80% * $3. 25) Cost accounted for *must agree with costs to account for $22, 701 9, 750 Transferred Out $ 32, 451 960, 300 $992, 751 Ending WIP $4, 320 7, 020 11, 340 $1, 004, 091* FIFO Method © 2011 Cengage Learning. All Rights Reserved. May not be copied, scanned, or duplicated, in whole or in part, except for use as permitted in a license distributed with a certain product or service or otherwise on a password-protected website for classroom use.
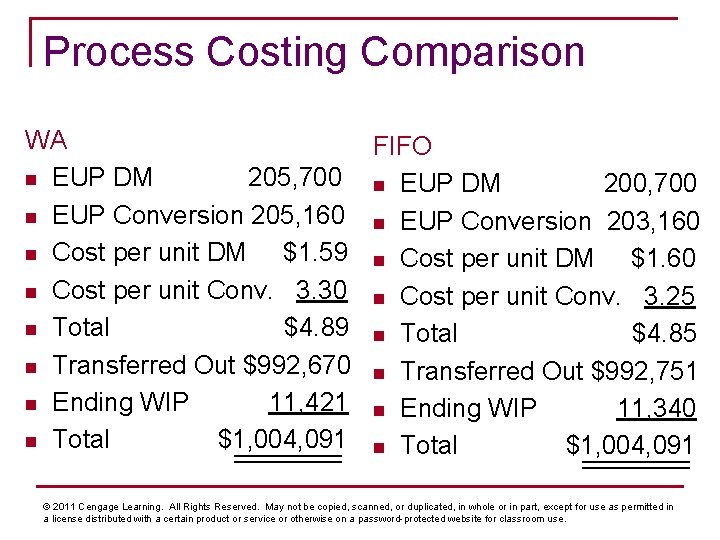
Process Costing Comparison WA FIFO n EUP DM 205, 700 n EUP DM 200, 700 n EUP Conversion 205, 160 n EUP Conversion 203, 160 n Cost per unit DM $1. 59 n Cost per unit DM $1. 60 n Cost per unit Conv. 3. 30 n Cost per unit Conv. 3. 25 n Total $4. 89 n Total $4. 85 n Transferred Out $992, 670 n Transferred Out $992, 751 n Ending WIP 11, 421 n Ending WIP 11, 340 n Total $1, 004, 091 © 2011 Cengage Learning. All Rights Reserved. May not be copied, scanned, or duplicated, in whole or in part, except for use as permitted in a license distributed with a certain product or service or otherwise on a password-protected website for classroom use.
Learning Objective 6 Use the first-in, first-out (FIFO) method of process costing. © 2003 Prentice Hall Business Publishing, Cost Accounting 11/e, Horngren/Datar/Foster 17 - 50
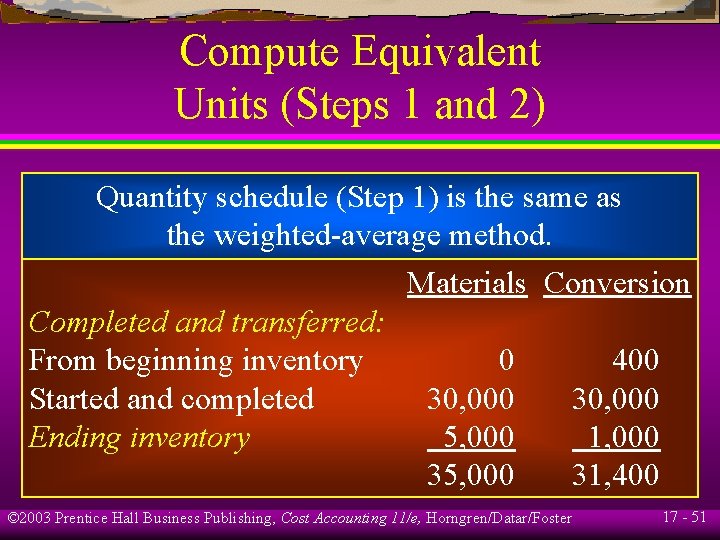
Compute Equivalent Units (Steps 1 and 2) Quantity schedule (Step 1) is the same as the weighted-average method. Materials Conversion Completed and transferred: From beginning inventory 0 400 Started and completed 30, 000 Ending inventory 5, 000 1, 000 35, 000 31, 400 © 2003 Prentice Hall Business Publishing, Cost Accounting 11/e, Horngren/Datar/Foster 17 - 51
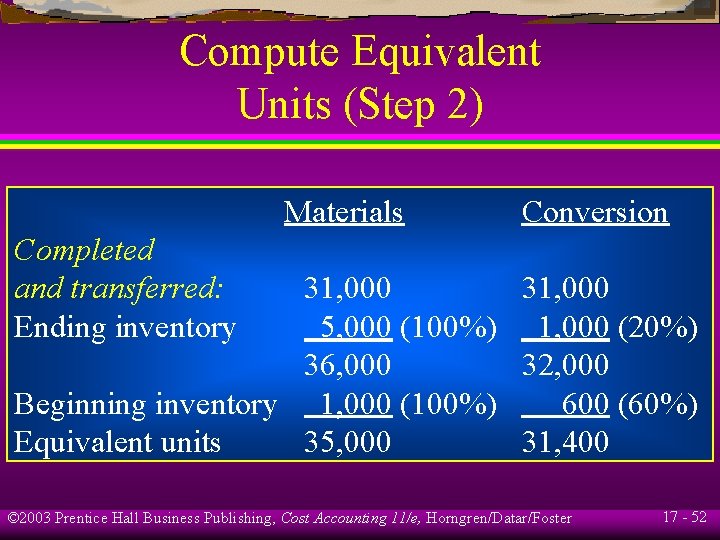
Compute Equivalent Units (Step 2) Materials Conversion Completed and transferred: Ending inventory 31, 000 5, 000 (100%) 1, 000 (20%) 36, 000 32, 000 Beginning inventory 1, 000 (100%) 600 (60%) Equivalent units 35, 000 31, 400 © 2003 Prentice Hall Business Publishing, Cost Accounting 11/e, Horngren/Datar/Foster 17 - 52
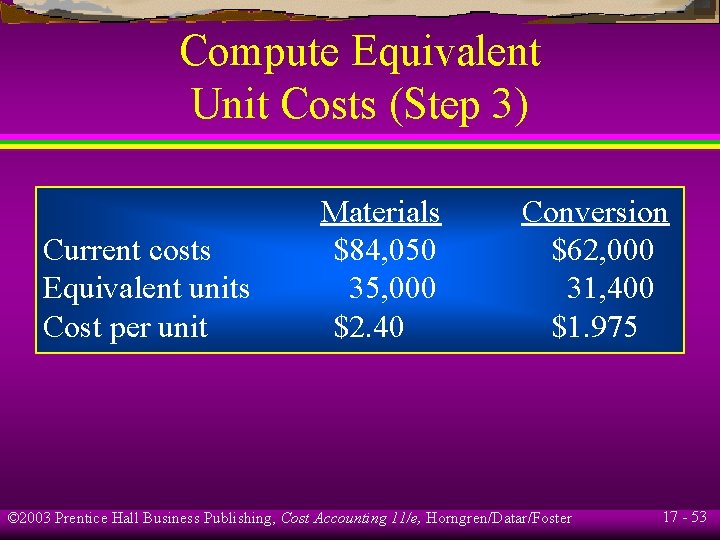
Compute Equivalent Unit Costs (Step 3) Current costs Equivalent units Cost per unit Materials $84, 050 35, 000 $2. 40 Conversion $62, 000 31, 400 $1. 975 © 2003 Prentice Hall Business Publishing, Cost Accounting 11/e, Horngren/Datar/Foster 17 - 53
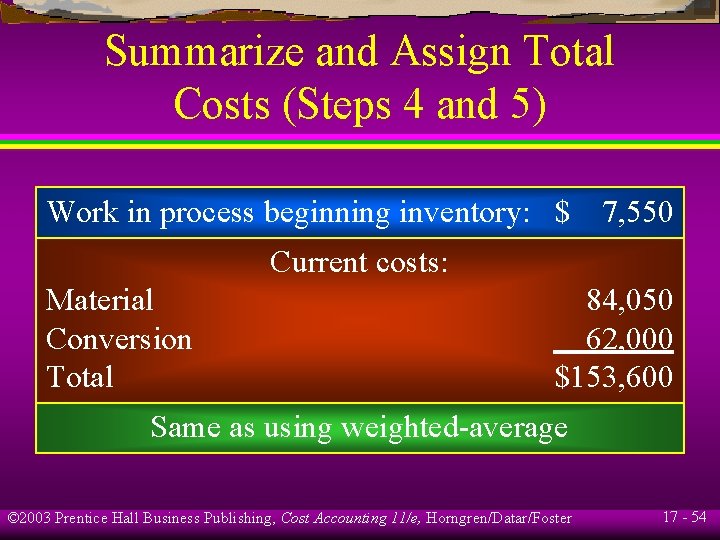
Summarize and Assign Total Costs (Steps 4 and 5) Work in process beginning inventory: $ 7, 550 Current costs: Material Conversion Total 84, 050 62, 000 $153, 600 Same as using weighted-average © 2003 Prentice Hall Business Publishing, Cost Accounting 11/e, Horngren/Datar/Foster 17 - 54
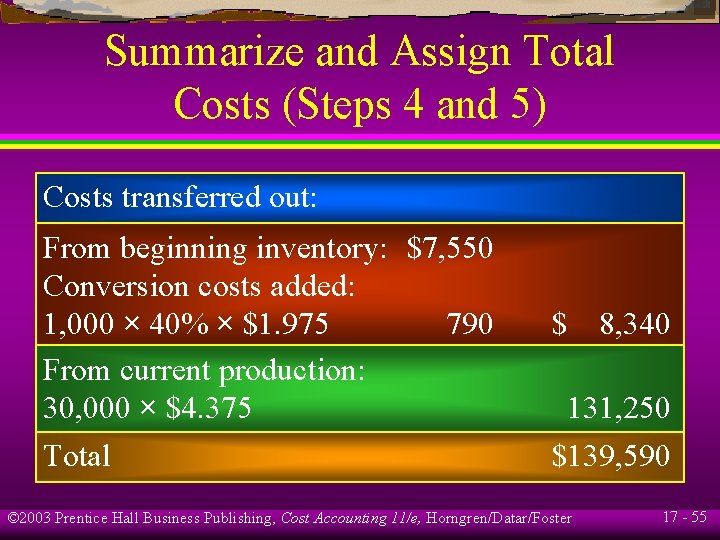
Summarize and Assign Total Costs (Steps 4 and 5) Costs transferred out: From beginning inventory: $7, 550 Conversion costs added: 1, 000 × 40% × $1. 975 790 From current production: 30, 000 × $4. 375 Total $ 8, 340 131, 250 $139, 590 © 2003 Prentice Hall Business Publishing, Cost Accounting 11/e, Horngren/Datar/Foster 17 - 55
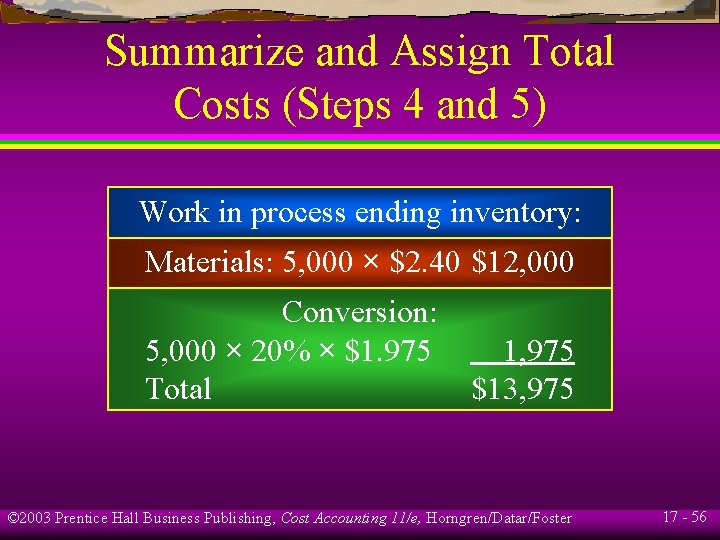
Summarize and Assign Total Costs (Steps 4 and 5) Work in process ending inventory: Materials: 5, 000 × $2. 40 $12, 000 Conversion: 5, 000 × 20% × $1. 975 Total 1, 975 $13, 975 © 2003 Prentice Hall Business Publishing, Cost Accounting 11/e, Horngren/Datar/Foster 17 - 56
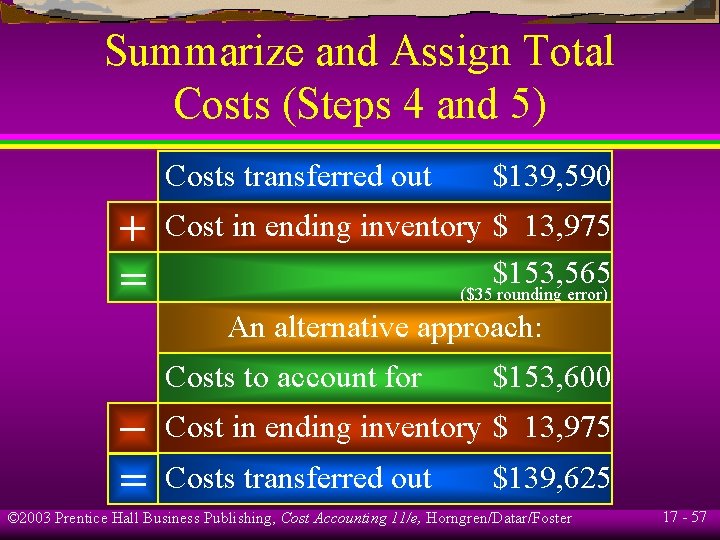
Summarize and Assign Total Costs (Steps 4 and 5) Costs transferred out + = $139, 590 Cost in ending inventory $ 13, 975 $153, 565 ($35 rounding error) An alternative approach: Costs to account for – = $153, 600 Cost in ending inventory $ 13, 975 Costs transferred out $139, 625 © 2003 Prentice Hall Business Publishing, Cost Accounting 11/e, Horngren/Datar/Foster 17 - 57
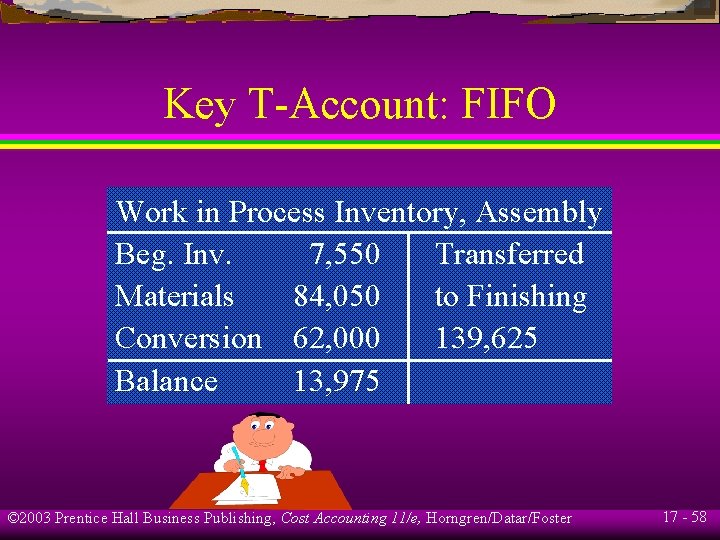
Key T-Account: FIFO Work in Process Inventory, Assembly Beg. Inv. 7, 550 Transferred Materials 84, 050 to Finishing Conversion 62, 000 139, 625 Balance 13, 975 © 2003 Prentice Hall Business Publishing, Cost Accounting 11/e, Horngren/Datar/Foster 17 - 58
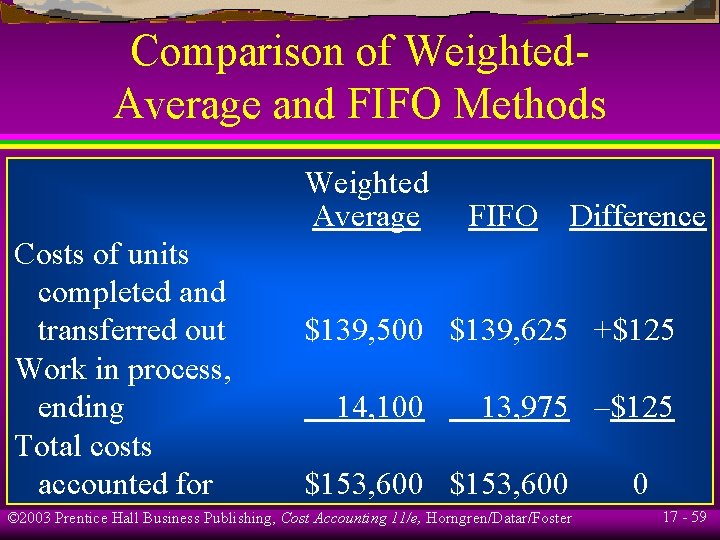
Comparison of Weighted. Average and FIFO Methods Weighted Average Costs of units completed and transferred out Work in process, ending Total costs accounted for FIFO Difference $139, 500 $139, 625 +$125 14, 100 13, 975 –$125 $153, 600 © 2003 Prentice Hall Business Publishing, Cost Accounting 11/e, Horngren/Datar/Foster 0 17 - 59
Learning Objective 8 Apply process-costing methods to cases with transferred-in costs. © 2003 Prentice Hall Business Publishing, Cost Accounting 11/e, Horngren/Datar/Foster 17 - 60
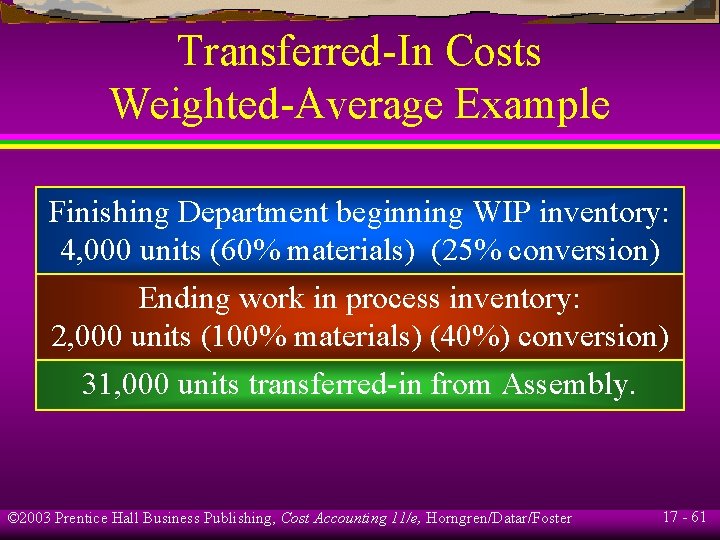
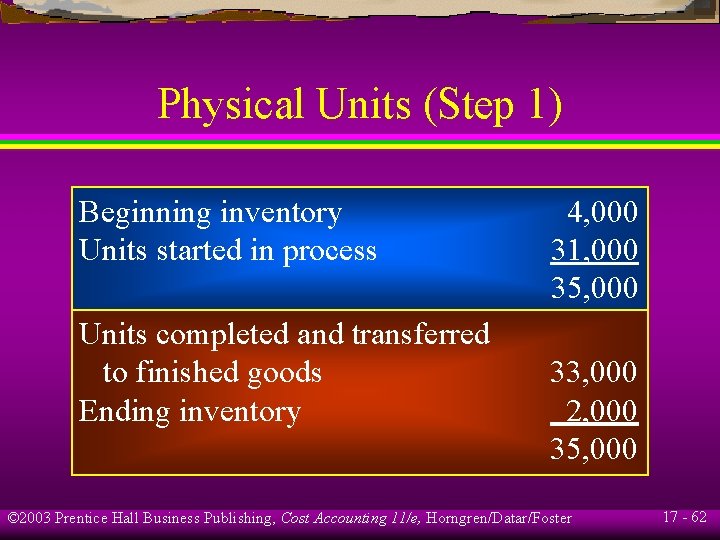
Transferred-In Costs Weighted-Average Example Finishing Department beginning WIP inventory: 4, 000 units (60% materials) (25% conversion) Ending work in process inventory: 2, 000 units (100% materials) (40%) conversion) 31, 000 units transferred-in from Assembly. © 2003 Prentice Hall Business Publishing, Cost Accounting 11/e, Horngren/Datar/Foster 17 - 61
Physical Units (Step 1) Beginning inventory Units started in process Units completed and transferred to finished goods Ending inventory 4, 000 31, 000 35, 000 33, 000 2, 000 35, 000 © 2003 Prentice Hall Business Publishing, Cost Accounting 11/e, Horngren/Datar/Foster 17 - 62
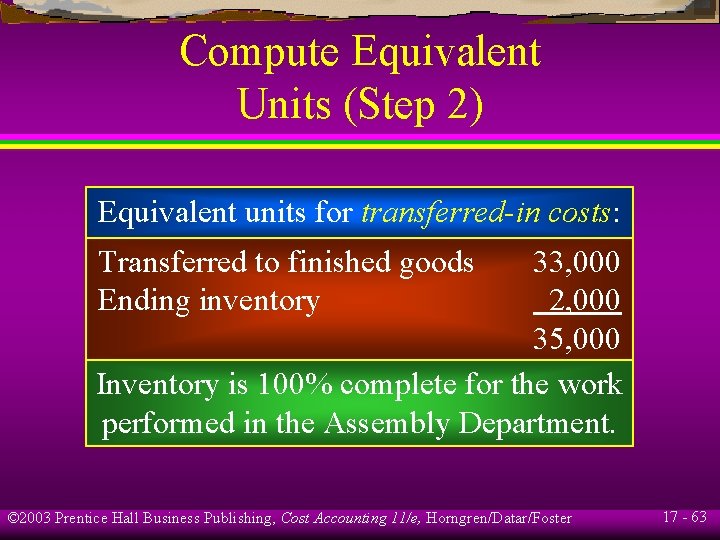
Compute Equivalent Units (Step 2) Equivalent units for transferred-in costs: Transferred to finished goods Ending inventory 33, 000 2, 000 35, 000 Inventory is 100% complete for the work performed in the Assembly Department. © 2003 Prentice Hall Business Publishing, Cost Accounting 11/e, Horngren/Datar/Foster 17 - 63
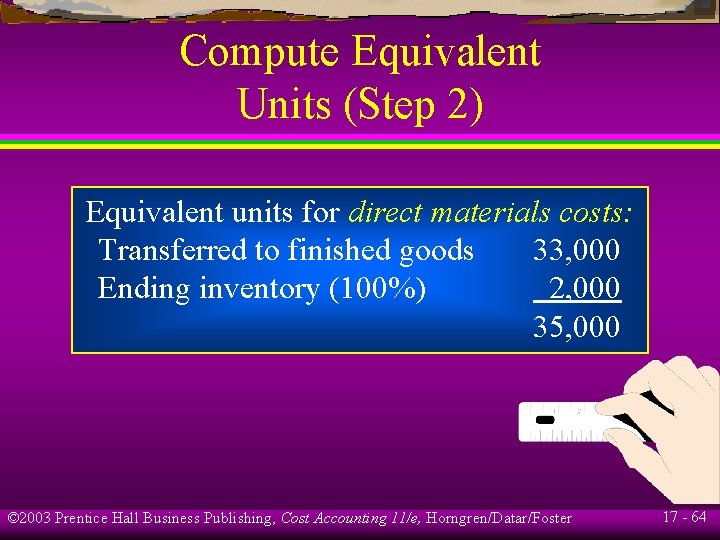
Compute Equivalent Units (Step 2) Equivalent units for direct materials costs: Transferred to finished goods 33, 000 Ending inventory (100%) 2, 000 35, 000 © 2003 Prentice Hall Business Publishing, Cost Accounting 11/e, Horngren/Datar/Foster 17 - 64
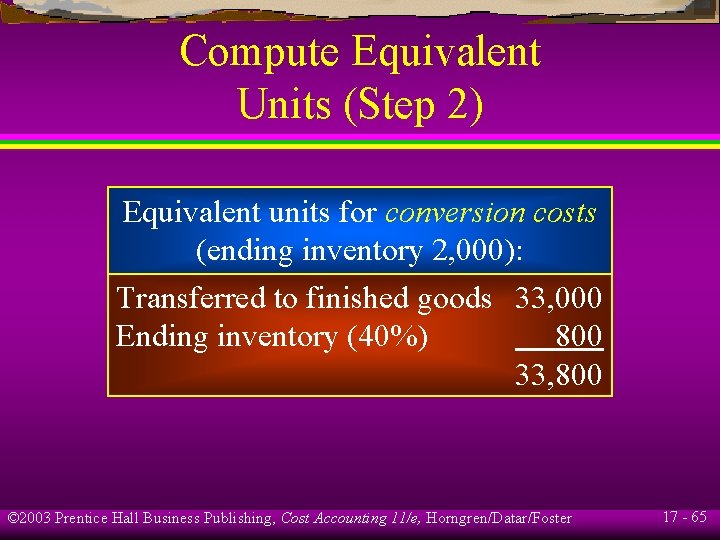
Compute Equivalent Units (Step 2) Equivalent units for conversion costs (ending inventory 2, 000): Transferred to finished goods 33, 000 Ending inventory (40%) 800 33, 800 © 2003 Prentice Hall Business Publishing, Cost Accounting 11/e, Horngren/Datar/Foster 17 - 65
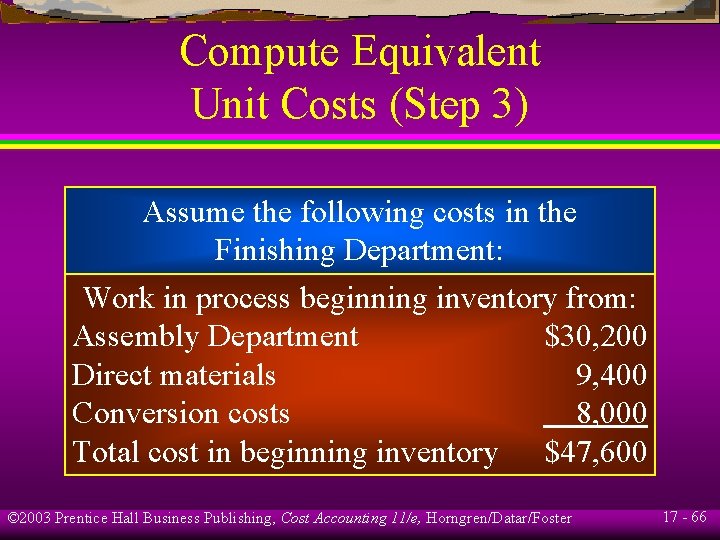
Compute Equivalent Unit Costs (Step 3) Assume the following costs in the Finishing Department: Work in process beginning inventory from: Assembly Department $30, 200 Direct materials 9, 400 Conversion costs 8, 000 Total cost in beginning inventory $47, 600 © 2003 Prentice Hall Business Publishing, Cost Accounting 11/e, Horngren/Datar/Foster 17 - 66
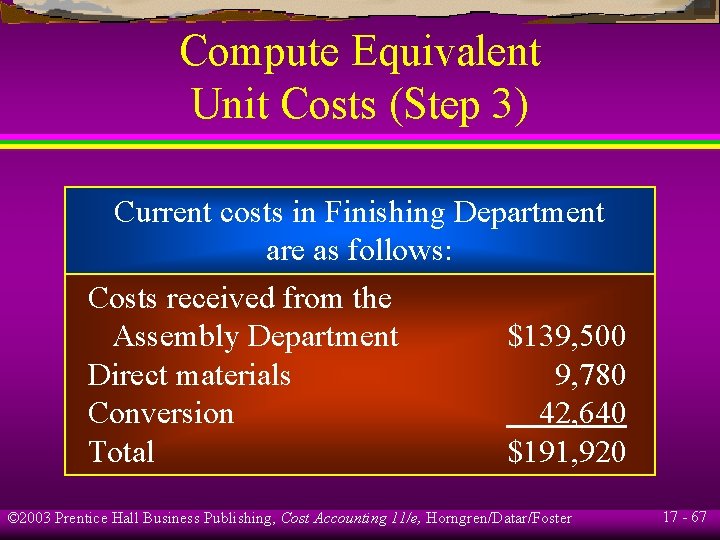
Compute Equivalent Unit Costs (Step 3) Current costs in Finishing Department are as follows: Costs received from the Assembly Department $139, 500 Direct materials 9, 780 Conversion 42, 640 Total $191, 920 © 2003 Prentice Hall Business Publishing, Cost Accounting 11/e, Horngren/Datar/Foster 17 - 67
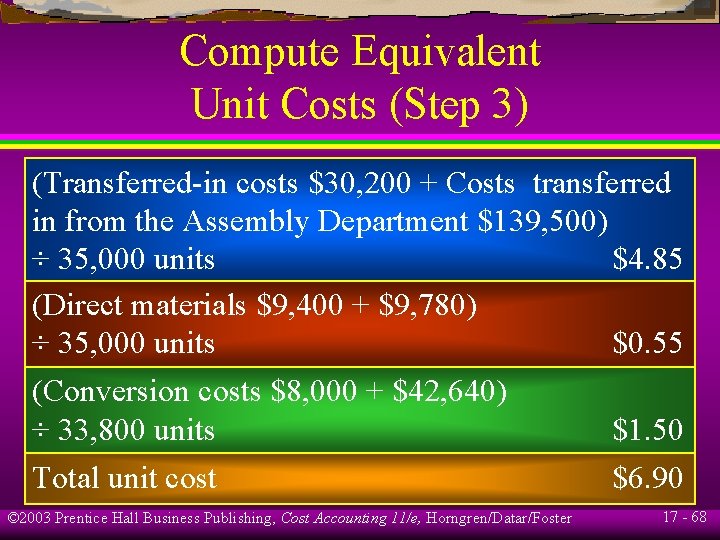
Compute Equivalent Unit Costs (Step 3) (Transferred-in costs $30, 200 + Costs transferred in from the Assembly Department $139, 500) ÷ 35, 000 units $4. 85 (Direct materials $9, 400 + $9, 780) ÷ 35, 000 units $0. 55 (Conversion costs $8, 000 + $42, 640) ÷ 33, 800 units $1. 50 Total unit cost $6. 90 © 2003 Prentice Hall Business Publishing, Cost Accounting 11/e, Horngren/Datar/Foster 17 - 68
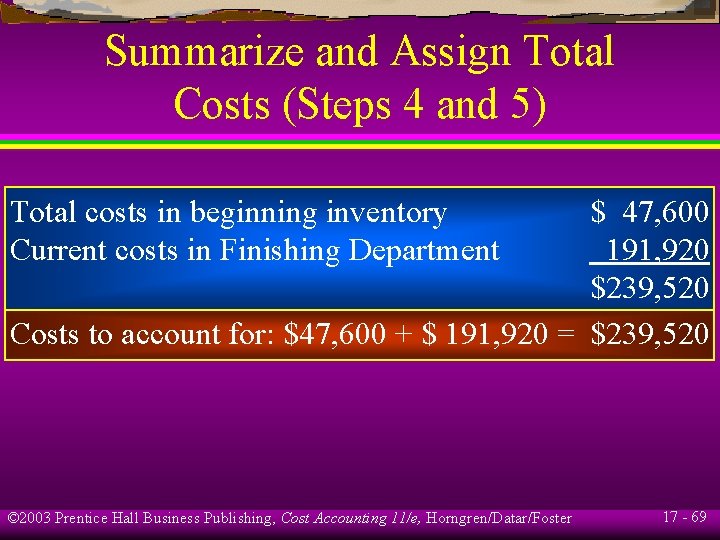
Summarize and Assign Total Costs (Steps 4 and 5) Total costs in beginning inventory Current costs in Finishing Department $ 47, 600 191, 920 $239, 520 Costs to account for: $47, 600 + $ 191, 920 = $239, 520 © 2003 Prentice Hall Business Publishing, Cost Accounting 11/e, Horngren/Datar/Foster 17 - 69
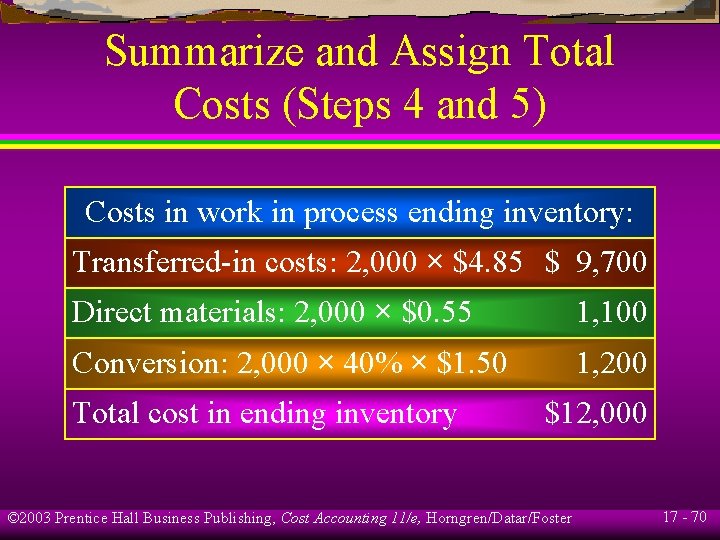
Summarize and Assign Total Costs (Steps 4 and 5) Costs in work in process ending inventory: Transferred-in costs: 2, 000 × $4. 85 $ 9, 700 Direct materials: 2, 000 × $0. 55 1, 100 Conversion: 2, 000 × 40% × $1. 50 1, 200 Total cost in ending inventory $12, 000 © 2003 Prentice Hall Business Publishing, Cost Accounting 11/e, Horngren/Datar/Foster 17 - 70
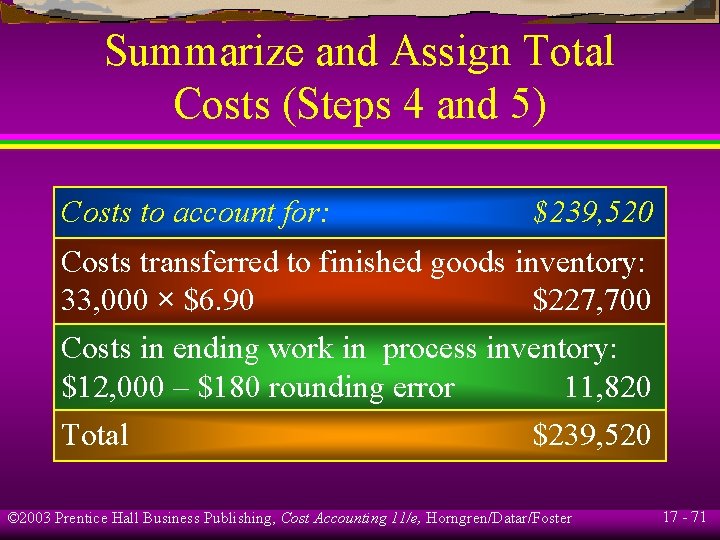
Summarize and Assign Total Costs (Steps 4 and 5) Costs to account for: $239, 520 Costs transferred to finished goods inventory: 33, 000 × $6. 90 $227, 700 Costs in ending work in process inventory: $12, 000 – $180 rounding error 11, 820 Total $239, 520 © 2003 Prentice Hall Business Publishing, Cost Accounting 11/e, Horngren/Datar/Foster 17 - 71
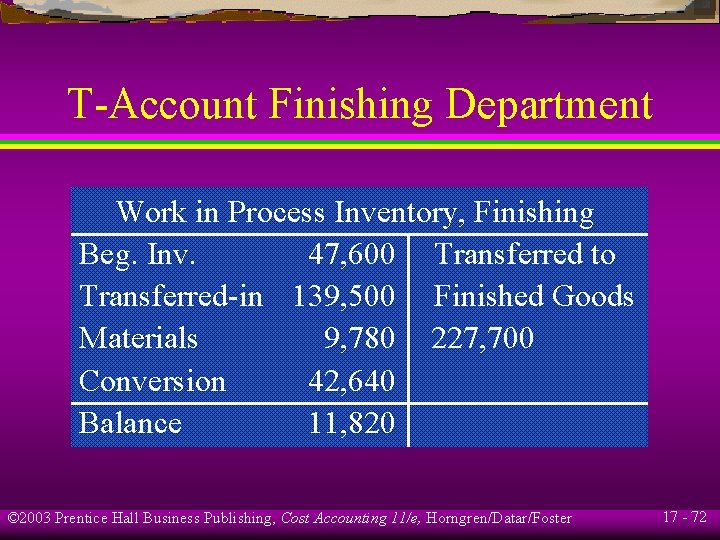
T-Account Finishing Department Work in Process Inventory, Finishing Beg. Inv. 47, 600 Transferred to Transferred-in 139, 500 Finished Goods Materials 9, 780 227, 700 Conversion 42, 640 Balance 11, 820 © 2003 Prentice Hall Business Publishing, Cost Accounting 11/e, Horngren/Datar/Foster 17 - 72
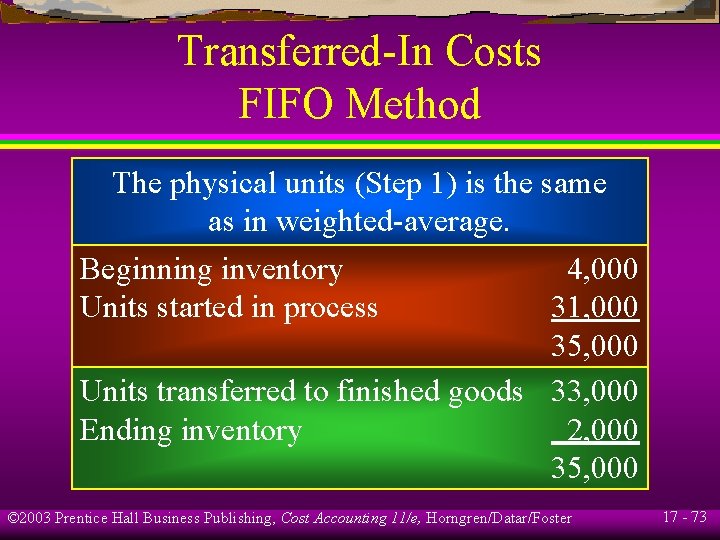
Transferred-In Costs FIFO Method The physical units (Step 1) is the same as in weighted-average. Beginning inventory 4, 000 Units started in process 31, 000 35, 000 Units transferred to finished goods 33, 000 Ending inventory 2, 000 35, 000 © 2003 Prentice Hall Business Publishing, Cost Accounting 11/e, Horngren/Datar/Foster 17 - 73
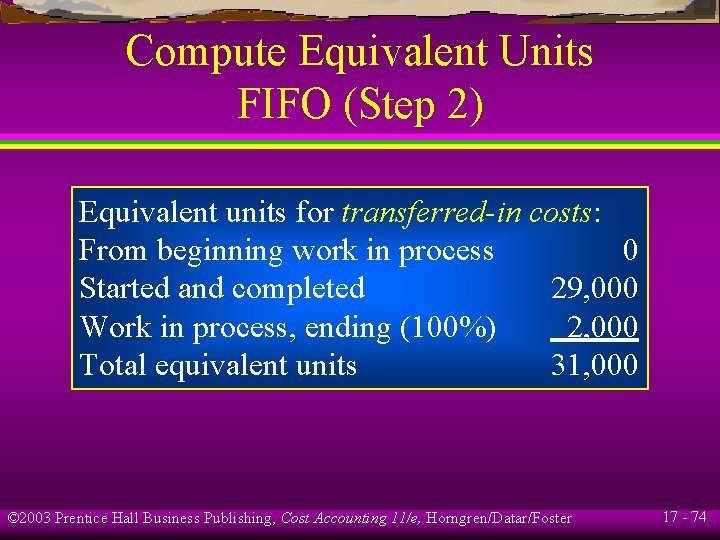
Compute Equivalent Units FIFO (Step 2) Equivalent units for transferred-in costs: From beginning work in process 0 Started and completed 29, 000 Work in process, ending (100%) 2, 000 Total equivalent units 31, 000 © 2003 Prentice Hall Business Publishing, Cost Accounting 11/e, Horngren/Datar/Foster 17 - 74
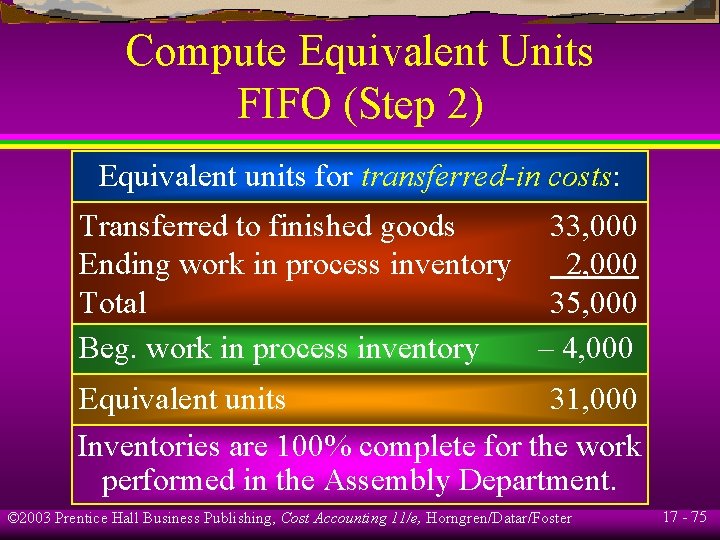
Compute Equivalent Units FIFO (Step 2) Equivalent units for transferred-in costs: Transferred to finished goods 33, 000 Ending work in process inventory 2, 000 Total 35, 000 Beg. work in process inventory – 4, 000 Equivalent units 31, 000 Inventories are 100% complete for the work performed in the Assembly Department. © 2003 Prentice Hall Business Publishing, Cost Accounting 11/e, Horngren/Datar/Foster 17 - 75
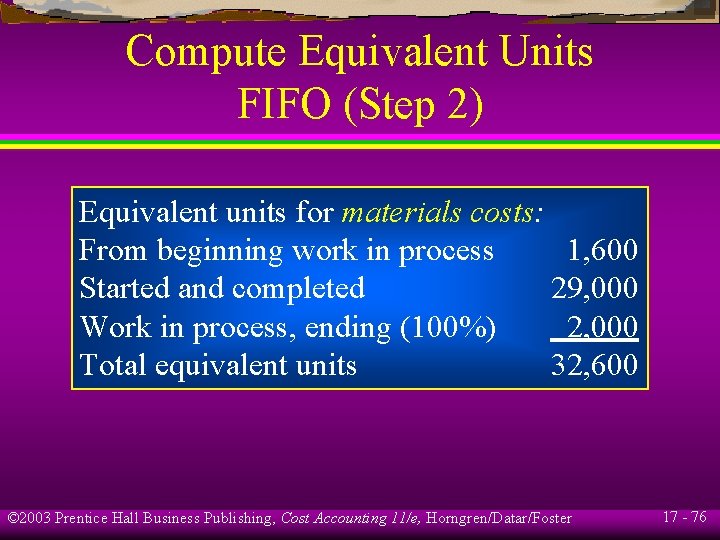
Compute Equivalent Units FIFO (Step 2) Equivalent units for materials costs: From beginning work in process 1, 600 Started and completed 29, 000 Work in process, ending (100%) 2, 000 Total equivalent units 32, 600 © 2003 Prentice Hall Business Publishing, Cost Accounting 11/e, Horngren/Datar/Foster 17 - 76
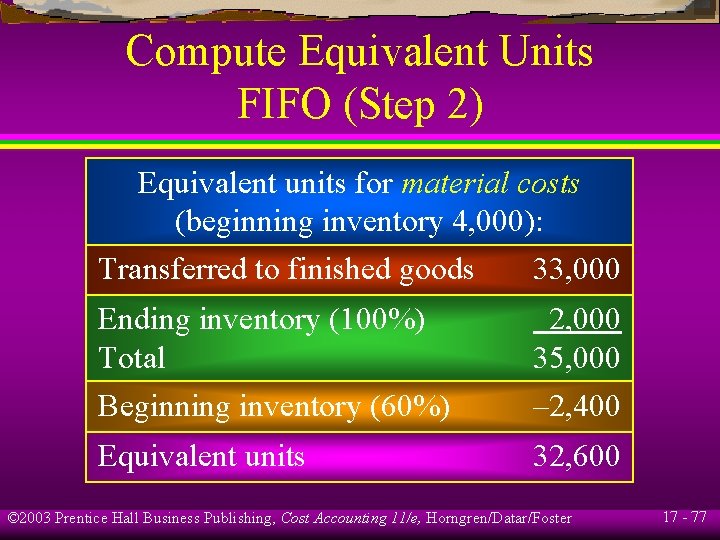
Compute Equivalent Units FIFO (Step 2) Equivalent units for material costs (beginning inventory 4, 000): Transferred to finished goods 33, 000 Ending inventory (100%) Total Beginning inventory (60%) 2, 000 35, 000 – 2, 400 Equivalent units 32, 600 © 2003 Prentice Hall Business Publishing, Cost Accounting 11/e, Horngren/Datar/Foster 17 - 77
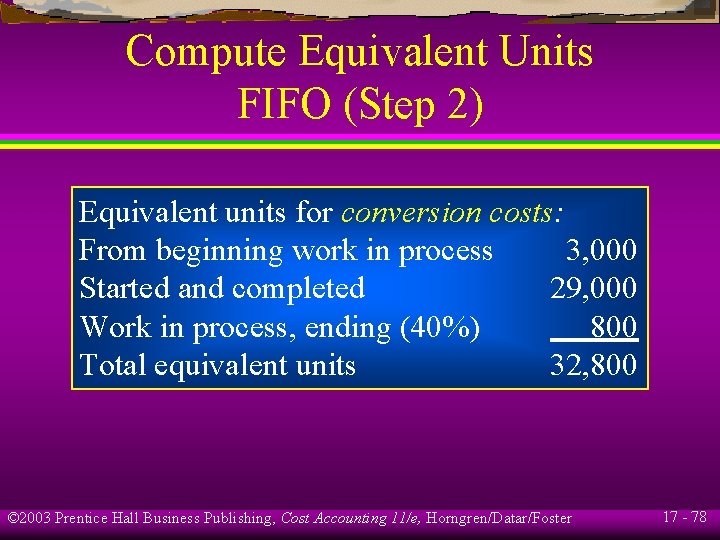
Compute Equivalent Units FIFO (Step 2) Equivalent units for conversion costs: From beginning work in process 3, 000 Started and completed 29, 000 Work in process, ending (40%) 800 Total equivalent units 32, 800 © 2003 Prentice Hall Business Publishing, Cost Accounting 11/e, Horngren/Datar/Foster 17 - 78
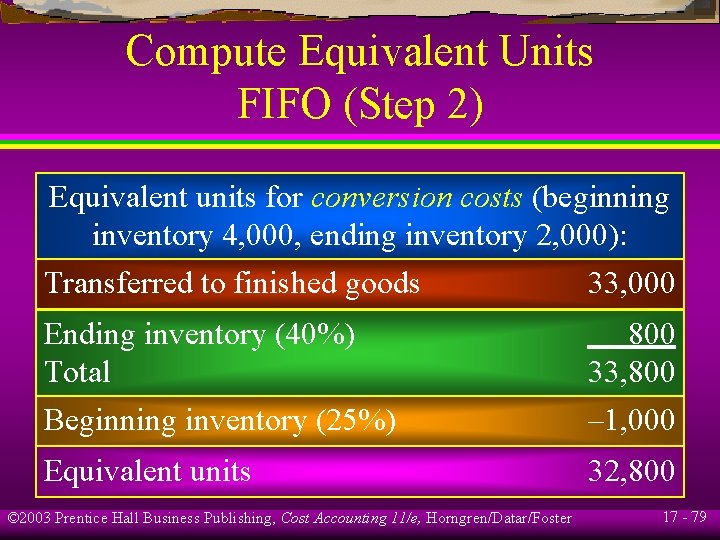
Compute Equivalent Units FIFO (Step 2) Equivalent units for conversion costs (beginning inventory 4, 000, ending inventory 2, 000): Transferred to finished goods 33, 000 Ending inventory (40%) Total Beginning inventory (25%) 800 33, 800 – 1, 000 Equivalent units 32, 800 © 2003 Prentice Hall Business Publishing, Cost Accounting 11/e, Horngren/Datar/Foster 17 - 79
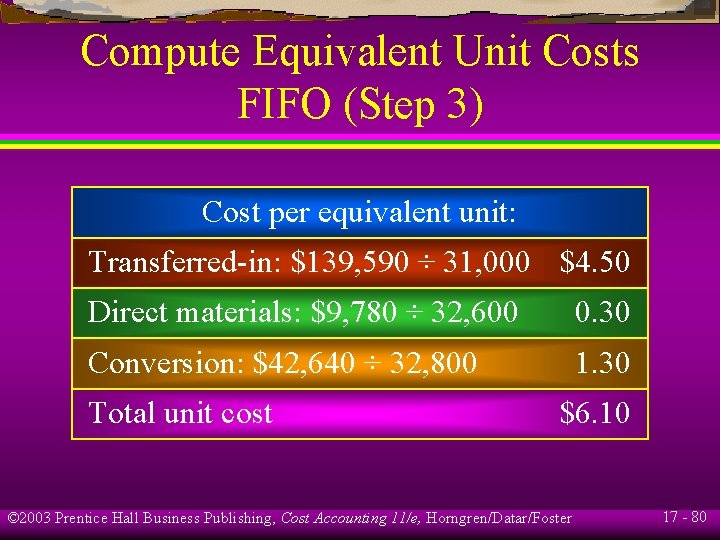
Compute Equivalent Unit Costs FIFO (Step 3) Cost per equivalent unit: Transferred-in: $139, 590 ÷ 31, 000 $4. 50 Direct materials: $9, 780 ÷ 32, 600 0. 30 Conversion: $42, 640 ÷ 32, 800 1. 30 Total unit cost $6. 10 © 2003 Prentice Hall Business Publishing, Cost Accounting 11/e, Horngren/Datar/Foster 17 - 80
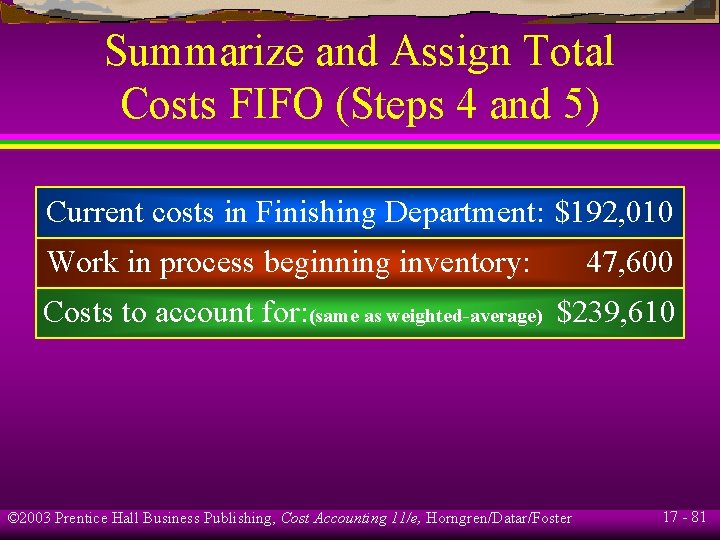
Summarize and Assign Total Costs FIFO (Steps 4 and 5) Current costs in Finishing Department: $192, 010 Work in process beginning inventory: 47, 600 Costs to account for: (same as weighted-average) $239, 610 © 2003 Prentice Hall Business Publishing, Cost Accounting 11/e, Horngren/Datar/Foster 17 - 81
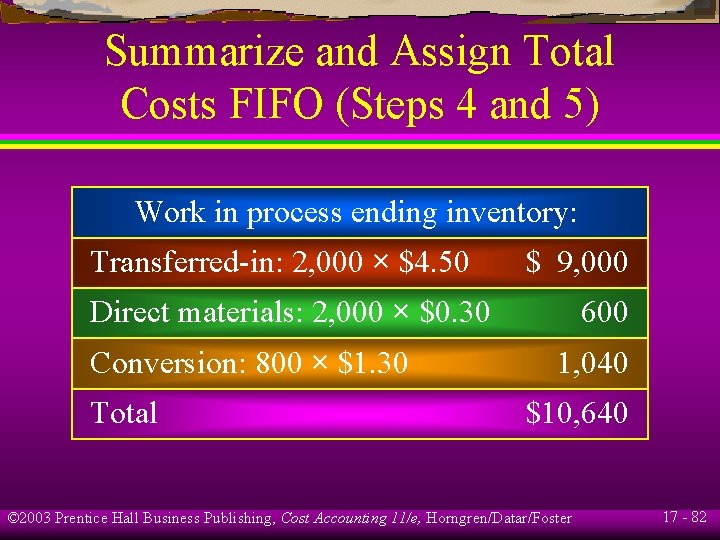
Summarize and Assign Total Costs FIFO (Steps 4 and 5) Work in process ending inventory: Transferred-in: 2, 000 × $4. 50 $ 9, 000 Direct materials: 2, 000 × $0. 30 Conversion: 800 × $1. 30 Total 600 1, 040 $10, 640 © 2003 Prentice Hall Business Publishing, Cost Accounting 11/e, Horngren/Datar/Foster 17 - 82
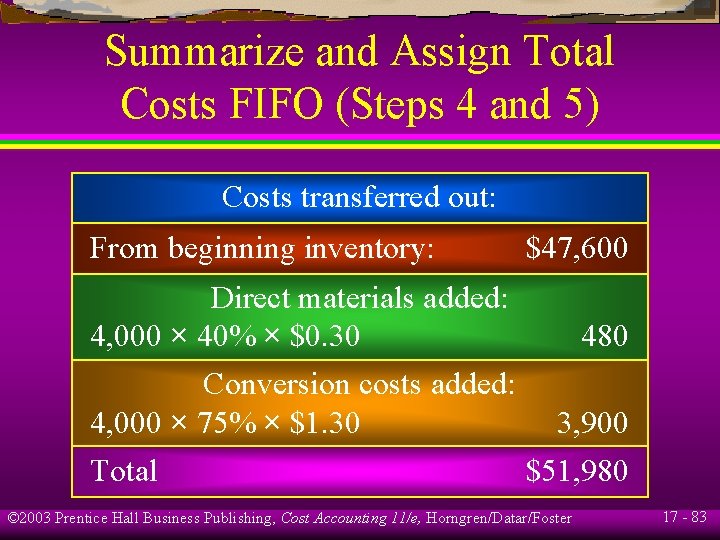
Summarize and Assign Total Costs FIFO (Steps 4 and 5) Costs transferred out: From beginning inventory: $47, 600 Direct materials added: 4, 000 × 40% × $0. 30 480 Conversion costs added: 4, 000 × 75% × $1. 30 3, 900 Total $51, 980 © 2003 Prentice Hall Business Publishing, Cost Accounting 11/e, Horngren/Datar/Foster 17 - 83
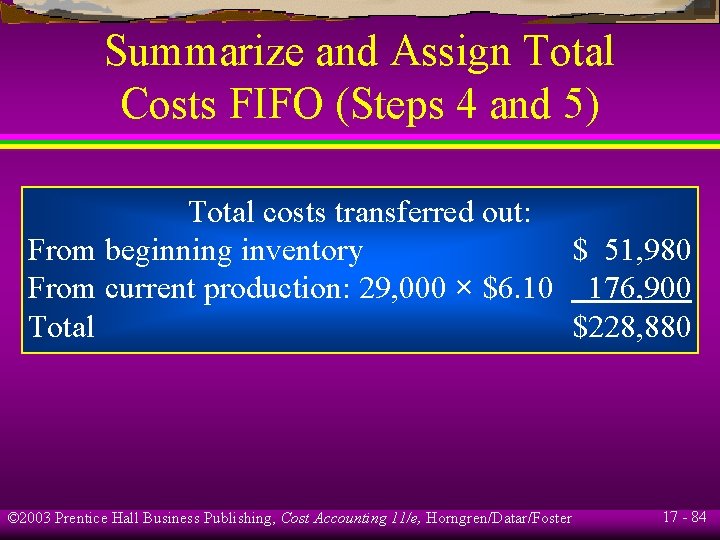
Summarize and Assign Total Costs FIFO (Steps 4 and 5) Total costs transferred out: From beginning inventory $ 51, 980 From current production: 29, 000 × $6. 10 176, 900 Total $228, 880 © 2003 Prentice Hall Business Publishing, Cost Accounting 11/e, Horngren/Datar/Foster 17 - 84
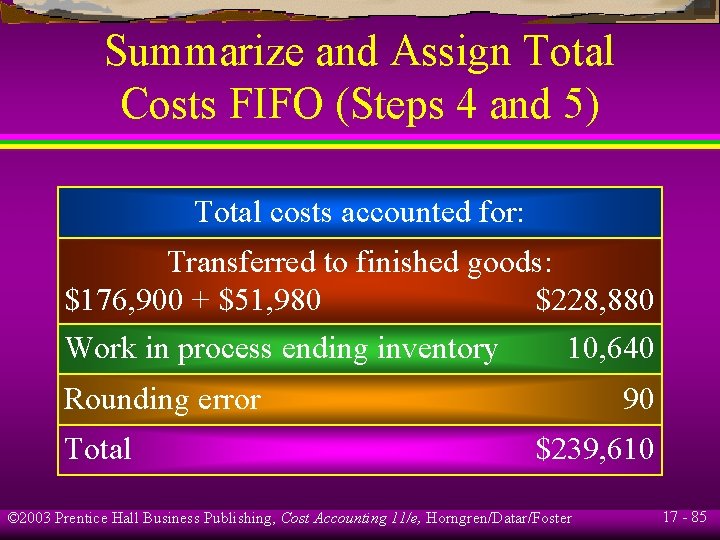
Summarize and Assign Total Costs FIFO (Steps 4 and 5) Total costs accounted for: Transferred to finished goods: $176, 900 + $51, 980 $228, 880 Work in process ending inventory 10, 640 Rounding error Total 90 $239, 610 © 2003 Prentice Hall Business Publishing, Cost Accounting 11/e, Horngren/Datar/Foster 17 - 85
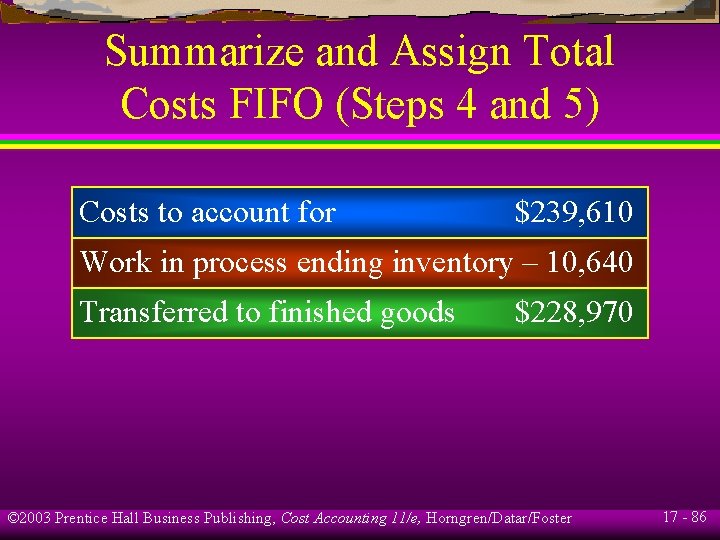
Summarize and Assign Total Costs FIFO (Steps 4 and 5) Costs to account for $239, 610 Work in process ending inventory – 10, 640 Transferred to finished goods $228, 970 © 2003 Prentice Hall Business Publishing, Cost Accounting 11/e, Horngren/Datar/Foster 17 - 86
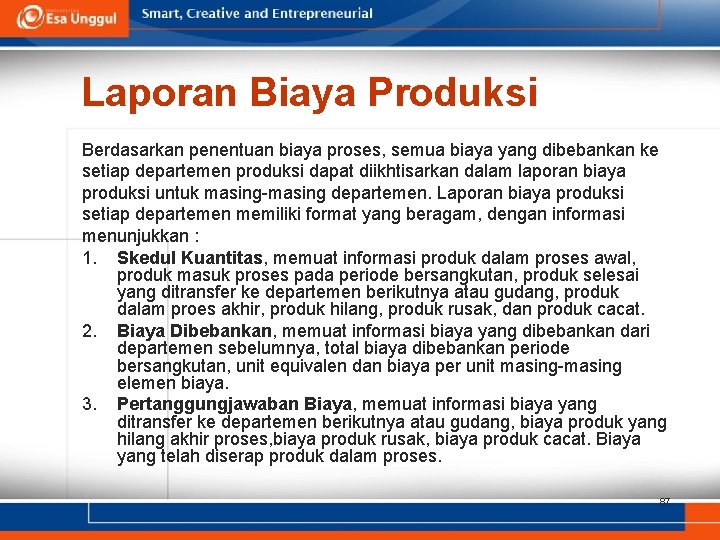
Laporan Biaya Produksi Berdasarkan penentuan biaya proses, semua biaya yang dibebankan ke setiap departemen produksi dapat diikhtisarkan dalam laporan biaya produksi untuk masing-masing departemen. Laporan biaya produksi setiap departemen memiliki format yang beragam, dengan informasi menunjukkan : 1. Skedul Kuantitas, memuat informasi produk dalam proses awal, produk masuk proses pada periode bersangkutan, produk selesai yang ditransfer ke departemen berikutnya atau gudang, produk dalam proes akhir, produk hilang, produk rusak, dan produk cacat. 2. Biaya Dibebankan, memuat informasi biaya yang dibebankan dari departemen sebelumnya, total biaya dibebankan periode bersangkutan, unit equivalen dan biaya per unit masing-masing elemen biaya. 3. Pertanggungjawaban Biaya, memuat informasi biaya yang ditransfer ke departemen berikutnya atau gudang, biaya produk yang hilang akhir proses, biaya produk rusak, biaya produk cacat. Biaya yang telah diserap produk dalam proses. 87
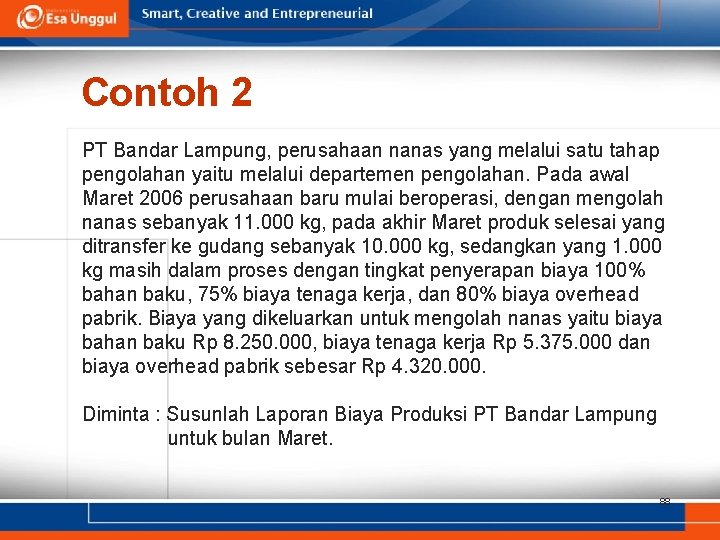
Contoh 2 PT Bandar Lampung, perusahaan nanas yang melalui satu tahap pengolahan yaitu melalui departemen pengolahan. Pada awal Maret 2006 perusahaan baru mulai beroperasi, dengan mengolah nanas sebanyak 11. 000 kg, pada akhir Maret produk selesai yang ditransfer ke gudang sebanyak 10. 000 kg, sedangkan yang 1. 000 kg masih dalam proses dengan tingkat penyerapan biaya 100% bahan baku, 75% biaya tenaga kerja, dan 80% biaya overhead pabrik. Biaya yang dikeluarkan untuk mengolah nanas yaitu biaya bahan baku Rp 8. 250. 000, biaya tenaga kerja Rp 5. 375. 000 dan biaya overhead pabrik sebesar Rp 4. 320. 000. Diminta : Susunlah Laporan Biaya Produksi PT Bandar Lampung untuk bulan Maret. 88
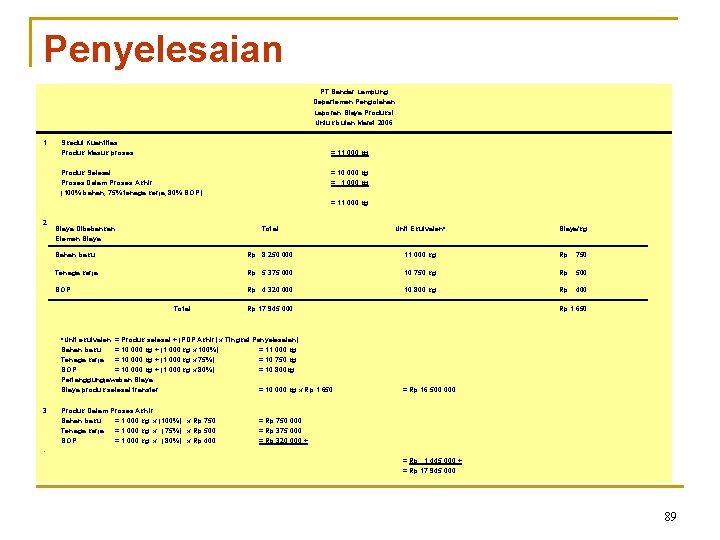
Penyelesaian PT Bandar Lampung Departemen Pengolahan Laporan Biaya Produksi Untuk bulan Maret 2006 1. Skedul Kuantitas Produk Masuk proses = 11. 000 kg Produk Selesai Proses Dalam Proses Akhir (100% bahan, 75% tenaga kerja, 80% BOP) = 10. 000 kg = 11. 000 kg 2. Biaya Dibebankan Elemen Biaya Total Unit Ekuivalen* Bahan baku Rp 8. 250. 000 11. 000 kg Rp 750 Tenaga kerja Rp 5. 375. 000 10. 750 kg Rp 500 BOP Rp 4. 320. 000 10. 800 kg Rp 400 Total Rp 17. 945. 000 *Unit ekuivalen = Produk selesai + (PDP Akhir) x Tingkat Penyelesaian) Bahan baku = 10. 000 kg + (1. 000 kg x 100%) = 11. 000 kg Tenaga kerja = 10. 000 kg + (1. 000 kg x 75%) = 10. 750 kg BOP = 10. 000 kg + (1. 000 kg x 80%) = 10. 800 kg Pertanggungjawaban Biaya produk selesai transfer = 10. 000 kg x Rp 1. 650 3. Produk Dalam Proses Akhir Bahan baku = 1. 000 kg x (100%) x Rp 750 Tenaga kerja = 1. 000 kg x (75%) x Rp 500 BOP = 1. 000 kg x (80%) x Rp 400 Biaya/kg Rp 1. 650 = Rp 16. 500. 000 = Rp 750. 000 = Rp 375. 000 = Rp 320. 000 + • = Rp 1. 445. 000 + = Rp 17. 945. 000 89
Penambahan Bahan Pada Departemen Lanjutan Penambahan biaya bahan pada departemen lanjutan dapat mempengaruhi : 1. Kenaikan unit yang dihasilkan. 2. Kenaikan biaya per unit, tetapi unit yang dihasilkan tidak mengalami perubahan. 3. Kenaikan biaya per unit dan unit yang dihasilkan. 90
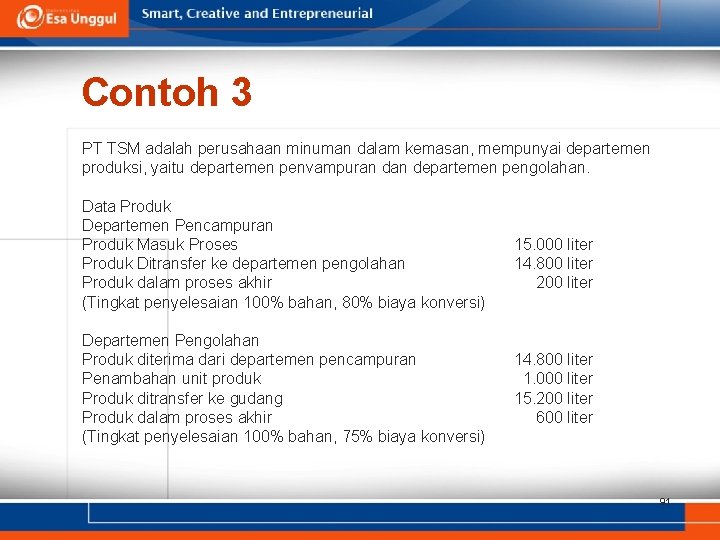
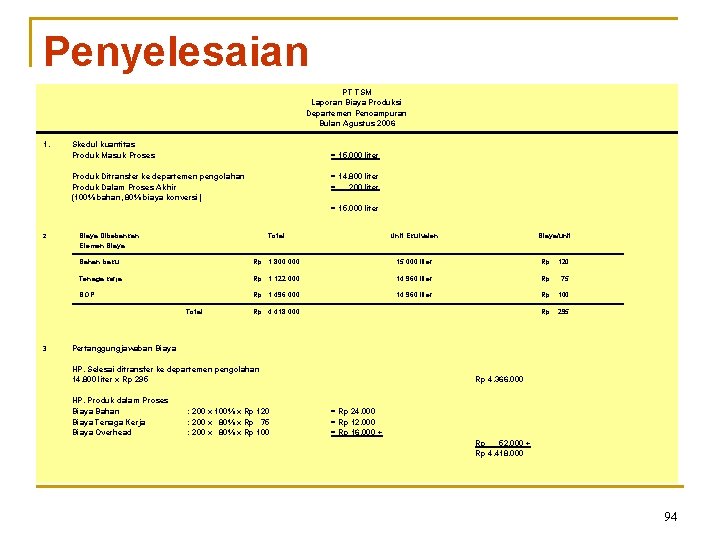
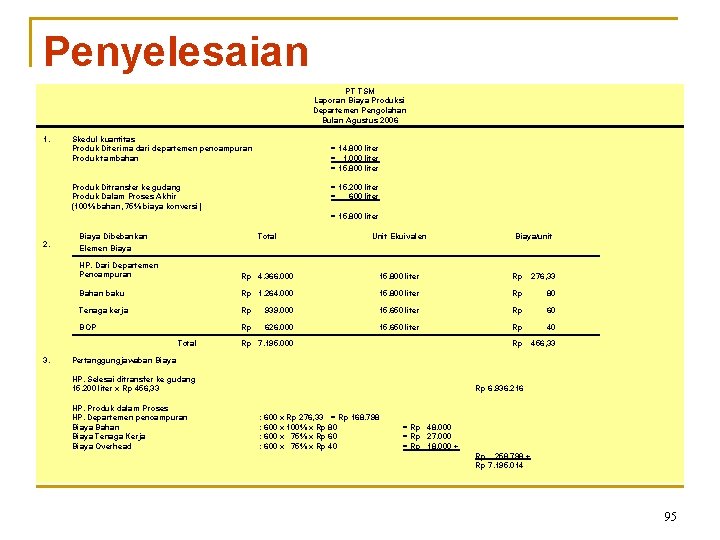
Contoh 3 PT TSM adalah perusahaan minuman dalam kemasan, mempunyai departemen produksi, yaitu departemen penvampuran departemen pengolahan. Data Produk Departemen Pencampuran Produk Masuk Proses Produk Ditransfer ke departemen pengolahan Produk dalam proses akhir (Tingkat penyelesaian 100% bahan, 80% biaya konversi) Departemen Pengolahan Produk diterima dari departemen pencampuran Penambahan unit produk Produk ditransfer ke gudang Produk dalam proses akhir (Tingkat penyelesaian 100% bahan, 75% biaya konversi) 15. 000 liter 14. 800 liter 200 liter 14. 800 liter 1. 000 liter 15. 200 liter 600 liter 91
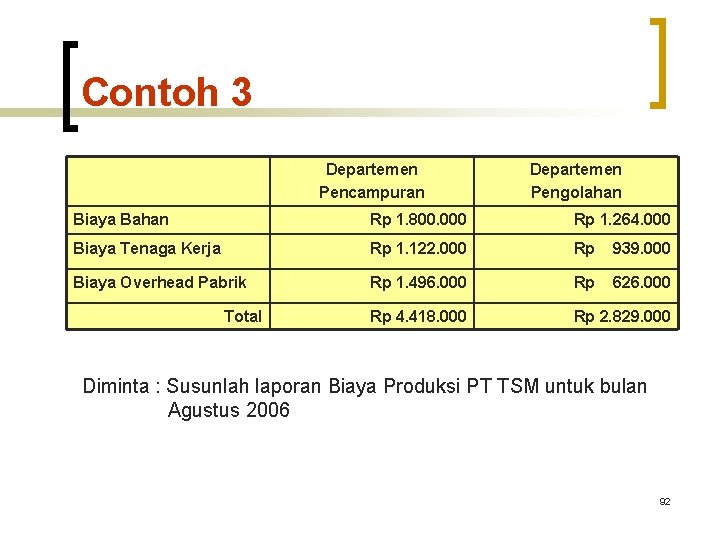
Contoh 3 Departemen Pencampuran Departemen Pengolahan Biaya Bahan Rp 1. 800. 000 Rp 1. 264. 000 Biaya Tenaga Kerja Rp 1. 122. 000 Rp 939. 000 Biaya Overhead Pabrik Rp 1. 496. 000 Rp 626. 000 Rp 4. 418. 000 Rp 2. 829. 000 Total Diminta : Susunlah laporan Biaya Produksi PT TSM untuk bulan Agustus 2006 92
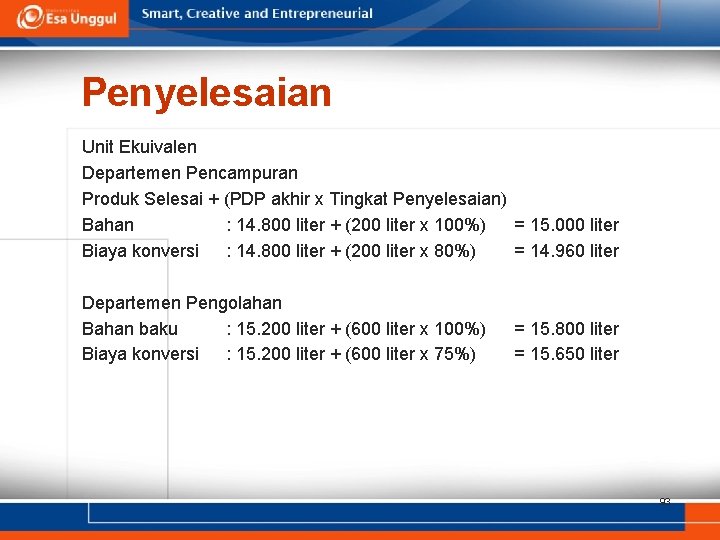
Penyelesaian Unit Ekuivalen Departemen Pencampuran Produk Selesai + (PDP akhir x Tingkat Penyelesaian) Bahan : 14. 800 liter + (200 liter x 100%) = 15. 000 liter Biaya konversi : 14. 800 liter + (200 liter x 80%) = 14. 960 liter Departemen Pengolahan Bahan baku : 15. 200 liter + (600 liter x 100%) Biaya konversi : 15. 200 liter + (600 liter x 75%) = 15. 800 liter = 15. 650 liter 93
Penyelesaian PT TSM Laporan Biaya Produksi Departemen Pencampuran Bulan Agustus 2006 1. Skedul kuantitas Produk Masuk Proses = 15. 000 liter Produk Ditransfer ke departemen pengolahan Produk Dalam Proses Akhir (100% bahan, 80% biaya konversi) = 14. 800 liter = 200 liter = 15. 000 liter 2. Biaya Dibebankan Elemen Biaya Total Unit Ekuivalen Bahan baku Rp 1. 800. 000 15. 000 liter Rp 120 Tenaga kerja Rp 1. 122. 000 14. 960 liter Rp 75 BOP Rp 1. 496. 000 14. 960 liter Rp 100 Rp 295 Total 3. Biaya/unit Rp 4. 418. 000 Pertanggungjawaban Biaya HP. Selesai ditransfer ke departemen pengolahan 14. 800 liter x Rp 295 HP. Produk dalam Proses Biaya Bahan Biaya Tenaga Kerja Biaya Overhead : 200 x 100% x Rp 120 : 200 x 80% x Rp 75 : 200 x 80% x Rp 100 Rp 4. 366. 000 = Rp 24. 000 = Rp 12. 000 = Rp 16. 000 + Rp 52. 000 + Rp 4. 418. 000 94
Penyelesaian PT TSM Laporan Biaya Produksi Departemen Pengolahan Bulan Agustus 2006 1. Skedul kuantitas Produk Diterima dari departemen pencampuran Produk tambahan = 14. 800 liter = 1. 000 liter = 15. 800 liter Produk Ditransfer ke gudang Produk Dalam Proses Akhir (100% bahan, 75% biaya konversi) = 15. 200 liter = 600 liter = 15. 800 liter 2. Biaya Dibebankan Elemen Biaya Total Unit Ekuivalen HP. Dari Departemen Pencampuran Rp 4. 366. 000 15. 800 liter Rp 276, 33 Bahan baku Rp 1. 264. 000 15. 800 liter Rp 80 Tenaga kerja Rp 939. 000 15. 650 liter Rp 60 BOP Rp 626. 000 15. 650 liter Rp 40 Rp 456, 33 Total 3. Rp 7. 195. 000 Biaya/unit Pertanggungjawaban Biaya HP. Selesai ditransfer ke gudang 15. 200 liter x Rp 456, 33 HP. Produk dalam Proses HP. Departemen pencampuran Biaya Bahan Biaya Tenaga Kerja Biaya Overhead Rp 6. 936. 216 : 600 x Rp 276, 33 = Rp 168. 798 : 600 x 100% x Rp 80 : 600 x 75% x Rp 60 : 600 x 75% x Rp 40 = Rp 48. 000 = Rp 27. 000 = Rp 18. 000 + Rp 258. 798 + Rp 7. 195. 014 95
Produk Hilang Dalam suatu proses produksi kadang-kadang terjadi produk hilang, yang disebabkan oleh sifat produk yang mudah menguap, menyusut, atau disebabkan proses pengolahan. Proses hilang tidak mempunyai wujud secara fisik dan untuk menelusurinya apakah produk tersebut hilang pada proses awal atau proses akhir. Hilang awal proses, asumsinya : 1. Belum menyerap biaya pada departemen bersangkutan, oleh karen aitu tidak dibebani biaya produksi. 2. Karena hilang awal proses, tidak diperhitungkan dalam unit ekuivalen produksi. 3. Apabila terjadi produk hilang awal proses pada departemen lanjutan, maka akan terjadi penyesuaian harga pokok per unit terhadap harga pokok yang diterima dari departemen sebelumnya. 96
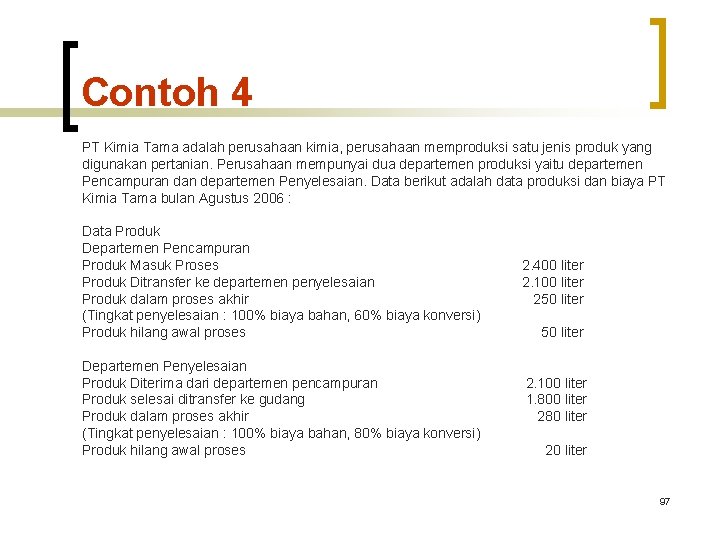
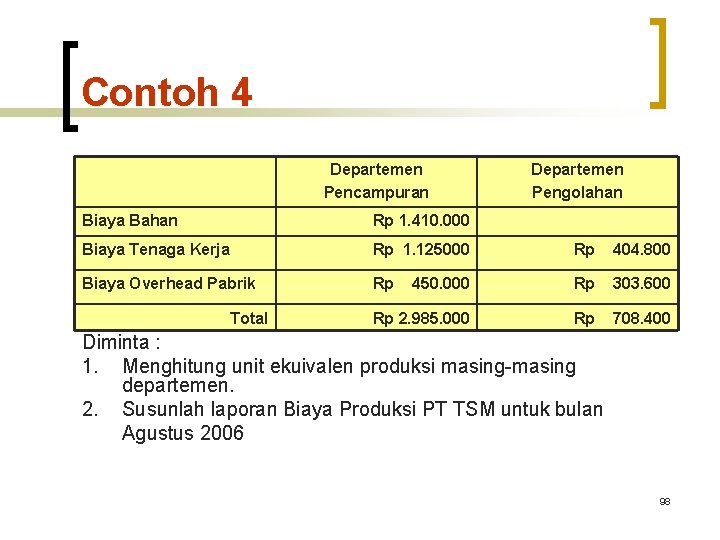
Contoh 4 PT Kimia Tama adalah perusahaan kimia, perusahaan memproduksi satu jenis produk yang digunakan pertanian. Perusahaan mempunyai dua departemen produksi yaitu departemen Pencampuran departemen Penyelesaian. Data berikut adalah data produksi dan biaya PT Kimia Tama bulan Agustus 2006 : Data Produk Departemen Pencampuran Produk Masuk Proses Produk Ditransfer ke departemen penyelesaian Produk dalam proses akhir (Tingkat penyelesaian : 100% biaya bahan, 60% biaya konversi) Produk hilang awal proses Departemen Penyelesaian Produk Diterima dari departemen pencampuran Produk selesai ditransfer ke gudang Produk dalam proses akhir (Tingkat penyelesaian : 100% biaya bahan, 80% biaya konversi) Produk hilang awal proses 2. 400 liter 2. 100 liter 250 liter 2. 100 liter 1. 800 liter 280 liter 20 liter 97
Contoh 4 Departemen Pencampuran Departemen Pengolahan Biaya Bahan Rp 1. 410. 000 Biaya Tenaga Kerja Rp 1. 125000 Rp 404. 800 Biaya Overhead Pabrik Rp 450. 000 Rp 303. 600 Rp 2. 985. 000 Rp 708. 400 Total Diminta : 1. Menghitung unit ekuivalen produksi masing-masing departemen. 2. Susunlah laporan Biaya Produksi PT TSM untuk bulan Agustus 2006 98
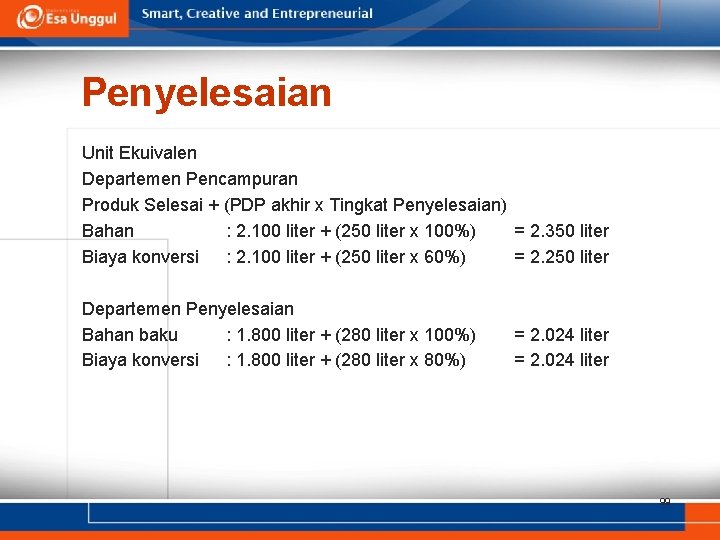
Penyelesaian Unit Ekuivalen Departemen Pencampuran Produk Selesai + (PDP akhir x Tingkat Penyelesaian) Bahan : 2. 100 liter + (250 liter x 100%) = 2. 350 liter Biaya konversi : 2. 100 liter + (250 liter x 60%) = 2. 250 liter Departemen Penyelesaian Bahan baku : 1. 800 liter + (280 liter x 100%) Biaya konversi : 1. 800 liter + (280 liter x 80%) = 2. 024 liter 99
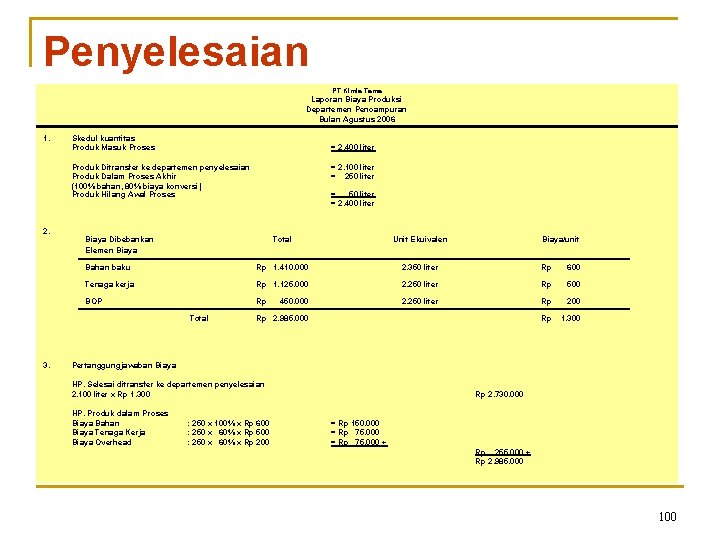
Penyelesaian PT Kimia Tama Laporan Biaya Produksi Departemen Pencampuran Bulan Agustus 2006 1. Skedul kuantitas Produk Masuk Proses = 2. 400 liter Produk Ditransfer ke departemen penyelesaian Produk Dalam Proses Akhir (100% bahan, 80% biaya konversi) Produk Hilang Awal Proses 2. = 50 liter = 2. 400 liter Biaya Dibebankan Elemen Biaya Total Unit Ekuivalen Bahan baku Rp 1. 410. 000 2. 350 liter Rp 600 Tenaga kerja Rp 1. 125. 000 2. 250 liter Rp 500 BOP Rp 2. 250 liter Rp 200 Rp 1. 300 Total 3. = 2. 100 liter = 250 liter 450. 000 Biaya/unit Rp 2. 985. 000 Pertanggungjawaban Biaya HP. Selesai ditransfer ke departemen penyelesaian 2. 100 liter x Rp 1. 300 HP. Produk dalam Proses Biaya Bahan Biaya Tenaga Kerja Biaya Overhead : 250 x 100% x Rp 600 : 250 x 60% x Rp 500 : 250 x 60% x Rp 200 Rp 2. 730. 000 = Rp 150. 000 = Rp 75. 000 + Rp 255. 000 + Rp 2. 985. 000 100
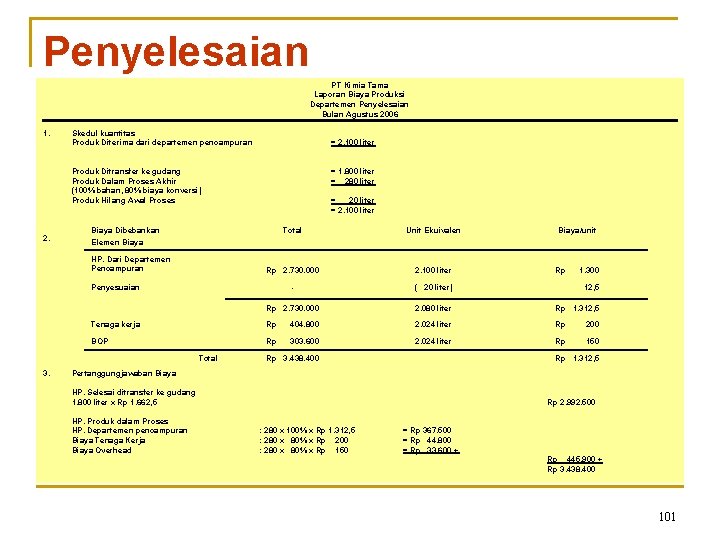
Penyelesaian PT Kimia Tama Laporan Biaya Produksi Departemen Penyelesaian Bulan Agustus 2006 1. Skedul kuantitas Produk Diterima dari departemen pencampuran = 2. 100 liter Produk Ditransfer ke gudang Produk Dalam Proses Akhir (100% bahan, 80% biaya konversi) Produk Hilang Awal Proses 2. = 1. 800 liter = 280 liter = 2. 100 liter Biaya Dibebankan Elemen Biaya Total Unit Ekuivalen Rp 2. 730. 000 2. 100 liter - ( 20 liter) 12, 5 Rp 2. 730. 000 2. 080 liter Rp 1. 312, 5 Tenaga kerja Rp 404. 800 2. 024 liter Rp 200 BOP Rp 303. 600 2. 024 liter Rp 150 HP. Dari Departemen Pencampuran Penyesuaian Total 3. Rp 3. 438. 400 Biaya/unit Rp 1. 300 Rp 1. 312, 5 Pertanggungjawaban Biaya HP. Selesai ditransfer ke gudang 1. 800 liter x Rp 1. 662, 5 HP. Produk dalam Proses HP. Departemen pencampuran Biaya Tenaga Kerja Biaya Overhead Rp 2. 992. 500 : 280 x 100% x Rp 1. 312, 5 : 280 x 80% x Rp 200 : 280 x 80% x Rp 150 = Rp 367. 500 = Rp 44. 800 = Rp 33. 600 + Rp 445. 900 + Rp 3. 438. 400 101
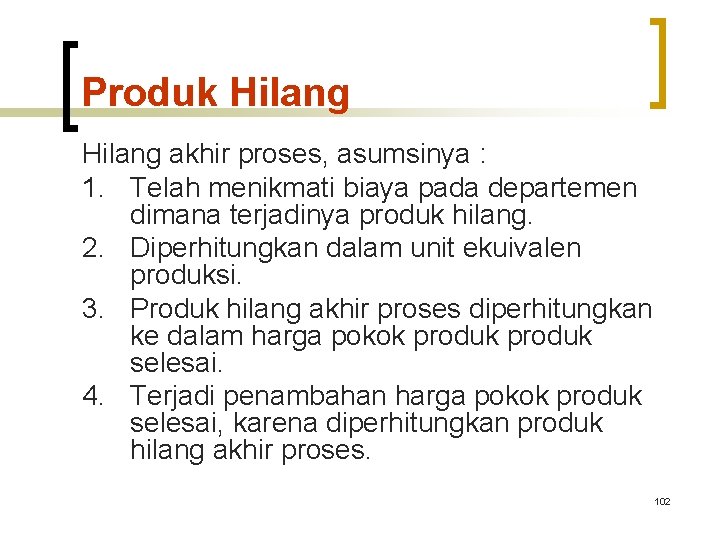
Produk Hilang akhir proses, asumsinya : 1. Telah menikmati biaya pada departemen dimana terjadinya produk hilang. 2. Diperhitungkan dalam unit ekuivalen produksi. 3. Produk hilang akhir proses diperhitungkan ke dalam harga pokok produk selesai. 4. Terjadi penambahan harga pokok produk selesai, karena diperhitungkan produk hilang akhir proses. 102
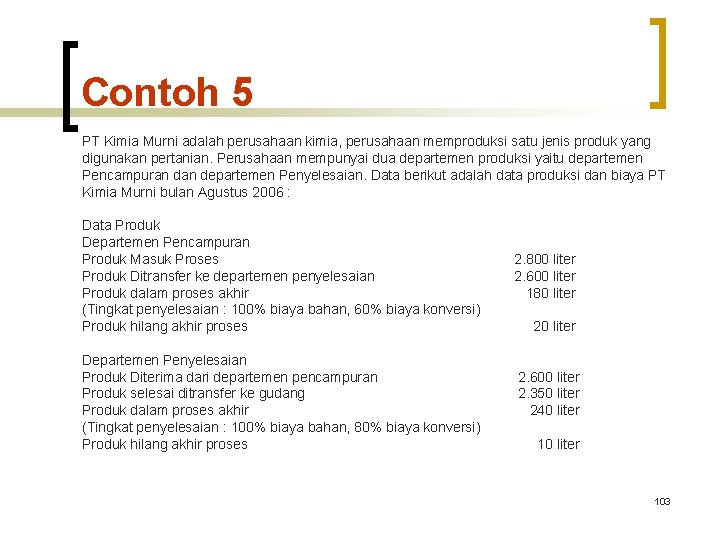
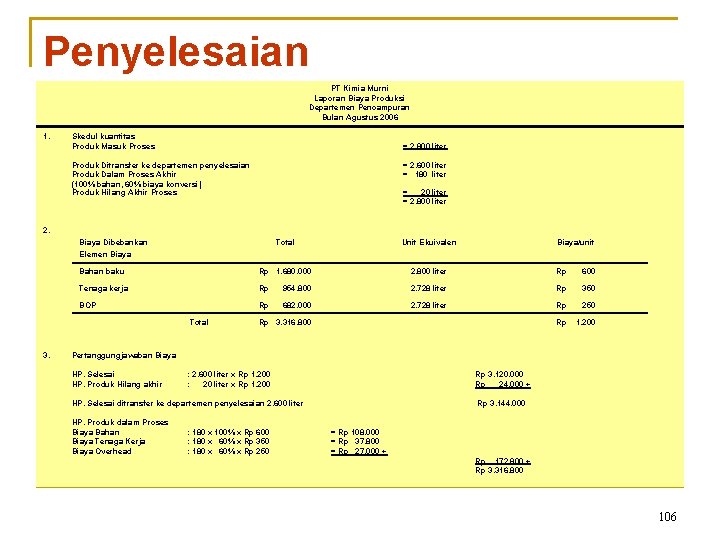
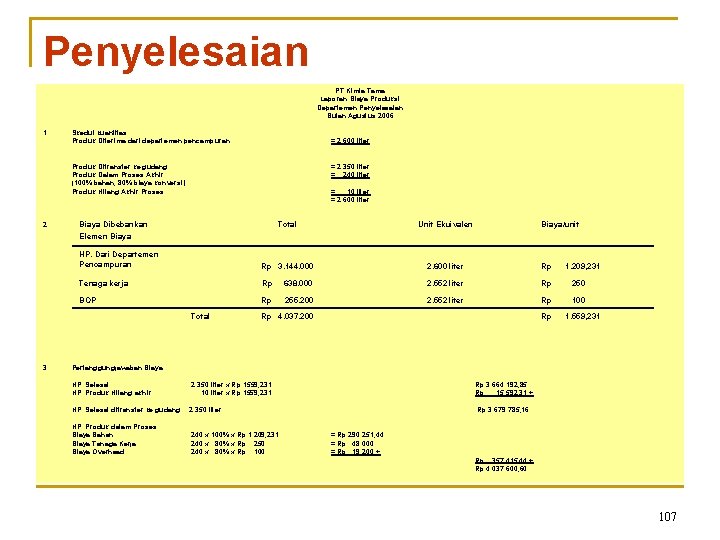
Contoh 5 PT Kimia Murni adalah perusahaan kimia, perusahaan memproduksi satu jenis produk yang digunakan pertanian. Perusahaan mempunyai dua departemen produksi yaitu departemen Pencampuran departemen Penyelesaian. Data berikut adalah data produksi dan biaya PT Kimia Murni bulan Agustus 2006 : Data Produk Departemen Pencampuran Produk Masuk Proses Produk Ditransfer ke departemen penyelesaian Produk dalam proses akhir (Tingkat penyelesaian : 100% biaya bahan, 60% biaya konversi) Produk hilang akhir proses Departemen Penyelesaian Produk Diterima dari departemen pencampuran Produk selesai ditransfer ke gudang Produk dalam proses akhir (Tingkat penyelesaian : 100% biaya bahan, 80% biaya konversi) Produk hilang akhir proses 2. 800 liter 2. 600 liter 180 liter 2. 600 liter 2. 350 liter 240 liter 103
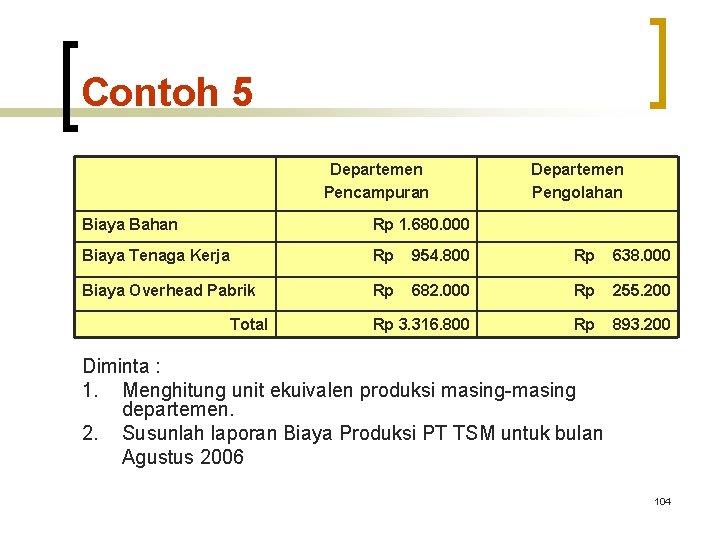
Contoh 5 Departemen Pencampuran Departemen Pengolahan Biaya Bahan Rp 1. 680. 000 Biaya Tenaga Kerja Rp 954. 800 Rp 638. 000 Biaya Overhead Pabrik Rp 682. 000 Rp 255. 200 Rp 3. 316. 800 Rp 893. 200 Total Diminta : 1. Menghitung unit ekuivalen produksi masing-masing departemen. 2. Susunlah laporan Biaya Produksi PT TSM untuk bulan Agustus 2006 104
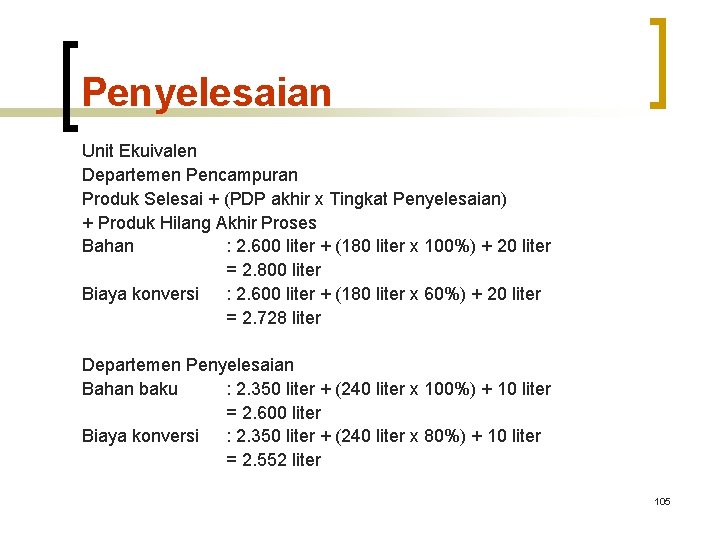
Penyelesaian Unit Ekuivalen Departemen Pencampuran Produk Selesai + (PDP akhir x Tingkat Penyelesaian) + Produk Hilang Akhir Proses Bahan : 2. 600 liter + (180 liter x 100%) + 20 liter = 2. 800 liter Biaya konversi : 2. 600 liter + (180 liter x 60%) + 20 liter = 2. 728 liter Departemen Penyelesaian Bahan baku : 2. 350 liter + (240 liter x 100%) + 10 liter = 2. 600 liter Biaya konversi : 2. 350 liter + (240 liter x 80%) + 10 liter = 2. 552 liter 105
Penyelesaian PT Kimia Murni Laporan Biaya Produksi Departemen Pencampuran Bulan Agustus 2006 1. Skedul kuantitas Produk Masuk Proses = 2. 800 liter Produk Ditransfer ke departemen penyelesaian Produk Dalam Proses Akhir (100% bahan, 60% biaya konversi) Produk Hilang Akhir Proses = 2. 600 liter = 180 liter = 2. 800 liter 2. Biaya Dibebankan Elemen Biaya Total Unit Ekuivalen Bahan baku Rp 1. 680. 000 2. 800 liter Rp 600 Tenaga kerja Rp 954. 800 2. 728 liter Rp 350 BOP Rp 682. 000 2. 728 liter Rp 250 Rp 1. 200 Total 3. Biaya/unit Rp 3. 316. 800 Pertanggungjawaban Biaya HP. Selesai HP. Produk Hilang akhir : 2. 600 liter x Rp 1. 200 : 20 liter x Rp 1. 200 Rp 3. 120. 000 Rp 24. 000 + HP. Selesai ditransfer ke departemen penyelesaian 2. 600 liter HP. Produk dalam Proses Biaya Bahan Biaya Tenaga Kerja Biaya Overhead : 180 x 100% x Rp 600 : 180 x 60% x Rp 350 : 180 x 60% x Rp 250 Rp 3. 144. 000 = Rp 108. 000 = Rp 37. 800 = Rp 27. 000 + Rp 172. 800 + Rp 3. 316. 800 106
Penyelesaian PT Kimia Tama Laporan Biaya Produksi Departemen Penyelesaian Bulan Agustus 2006 1. Skedul kuantitas Produk Diterima dari departemen pencampuran = 2. 600 liter Produk Ditransfer ke gudang Produk Dalam Proses Akhir (100% bahan, 80% biaya konversi) Produk Hilang Akhir Proses 2. = 2. 350 liter = 240 liter = 10 liter = 2. 600 liter Biaya Dibebankan Elemen Biaya Total Unit Ekuivalen HP. Dari Departemen Pencampuran Rp 3. 144. 000 2. 600 liter Rp Tenaga kerja Rp 638. 000 2. 552 liter Rp 250 BOP Rp 255. 200 2. 552 liter Rp 100 Total 3. Biaya/unit Rp 4. 037. 200 Rp 1. 209, 231 1. 559, 231 Pertanggungjawaban Biaya HP. Selesai HP. Produk Hilang akhir : 2. 350 liter x Rp 1559, 231 : 10 liter x Rp 1559, 231 Rp 3. 664. 192, 85 Rp 15. 592, 31 + HP. Selesai ditransfer ke gudang 2. 350 liter Rp 3. 679. 785, 16 HP. Produk dalam Proses Biaya Bahan Biaya Tenaga Kerja Biaya Overhead : 240 x 100% x Rp 1. 209, 231 : 240 x 80% x Rp 250 : 240 x 80% x Rp 100 = Rp 290. 251, 44 = Rp 48. 000 = Rp 19. 200 + Rp 357. 415, 44 + Rp 4. 037. 600, 60 107
Produk Cacat Produk cacat adalah produk yang dihasilkan dalam proses produksi, dimana produk yang dihasilkan tersebut tidak sesuai dengan standar mutu yang ditetapkan, tetapi secara ekonomis produk tersebut dapat diperbaiki dengan mengeluarkan biaya tertentu, dan biaya yang dikeluarkan harus lebih rendah dari nilai jual setelah produk tersebut diperbaiki. 108
Faktor Penyebab Produk Cacat 1. Bersifat normal : dimana setiap proses produksi tidak bisa dihindari terjadinya ptoduk cacat, maka biaya untuk memperbaiki produk cacat tersebut dibebankan ke setiap departemen dimana terjadinya produk cacat, dengan cara menggabungkan setiap elemen biaya yang dibebankan pada setiap departemen. 2. Akibat kesalahan : dimana terjadinya produk cacat diakibatkan kesalahan dalam proses produksi seperti kurangnya perencanaan, pengawasan dan pengendalian, kelalaian pekerja dll. Maka biaya untuk memperbaiki produk cacat seperti ini tidak boleh dibebankan ke setiap elemen biaya, tetapi dianggap sebagai kerugian perusahaan yang harus dimasukkan ke dalam rekening rugi produk cacat. Perhitungan Unit Ekuivalen Produksi Dalam perhitungan unit ekuivalen produksi, apabila terjadi produk cacat akan diperhitungkan, karena produk cacat tersebut telah menyerap biaya dimana terjadinya produk cacat tersebut. Produk Selesai + (PDP Akhir x Tingkat Penyelesaian) + Produk Cacat 109
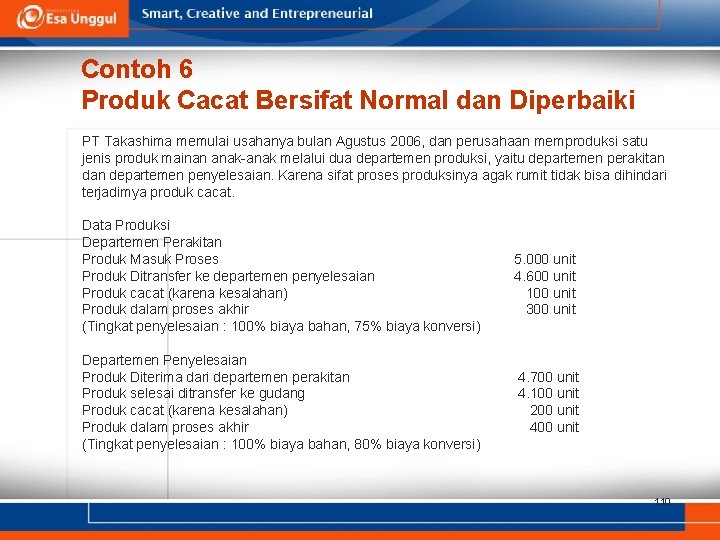
Contoh 6 Produk Cacat Bersifat Normal dan Diperbaiki PT Takashima memulai usahanya bulan Agustus 2006, dan perusahaan memproduksi satu jenis produk mainan anak-anak melalui dua departemen produksi, yaitu departemen perakitan departemen penyelesaian. Karena sifat proses produksinya agak rumit tidak bisa dihindari terjadimya produk cacat. Data Produksi Departemen Perakitan Produk Masuk Proses Produk Ditransfer ke departemen penyelesaian Produk cacat (karena kesalahan) Produk dalam proses akhir (Tingkat penyelesaian : 100% biaya bahan, 75% biaya konversi) Departemen Penyelesaian Produk Diterima dari departemen perakitan Produk selesai ditransfer ke gudang Produk cacat (karena kesalahan) Produk dalam proses akhir (Tingkat penyelesaian : 100% biaya bahan, 80% biaya konversi) 5. 000 unit 4. 600 unit 100 unit 300 unit 4. 700 unit 4. 100 unit 200 unit 400 unit 110
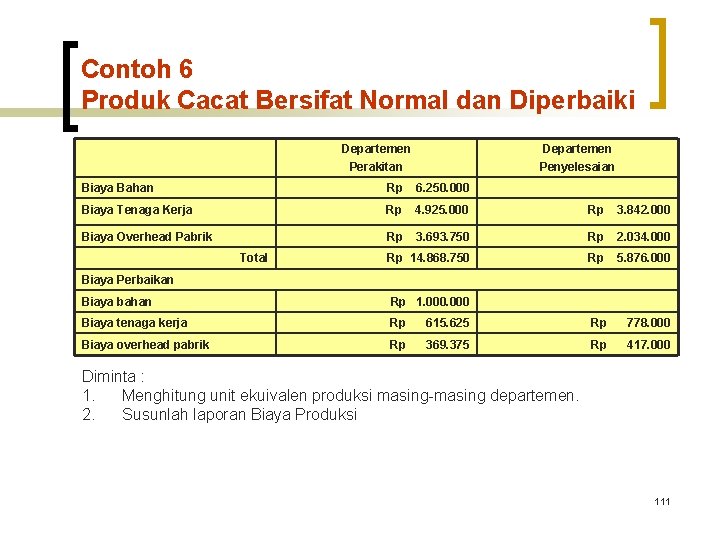
Contoh 6 Produk Cacat Bersifat Normal dan Diperbaiki Departemen Perakitan Departemen Penyelesaian Biaya Bahan Rp 6. 250. 000 Biaya Tenaga Kerja Rp 4. 925. 000 Rp 3. 842. 000 Biaya Overhead Pabrik Rp 3. 693. 750 Rp 2. 034. 000 Rp 14. 868. 750 Rp 5. 876. 000 Total Biaya Perbaikan Biaya bahan Rp 1. 000 Biaya tenaga kerja Rp 615. 625 Rp 778. 000 Biaya overhead pabrik Rp 369. 375 Rp 417. 000 Diminta : 1. Menghitung unit ekuivalen produksi masing-masing departemen. 2. Susunlah laporan Biaya Produksi 111
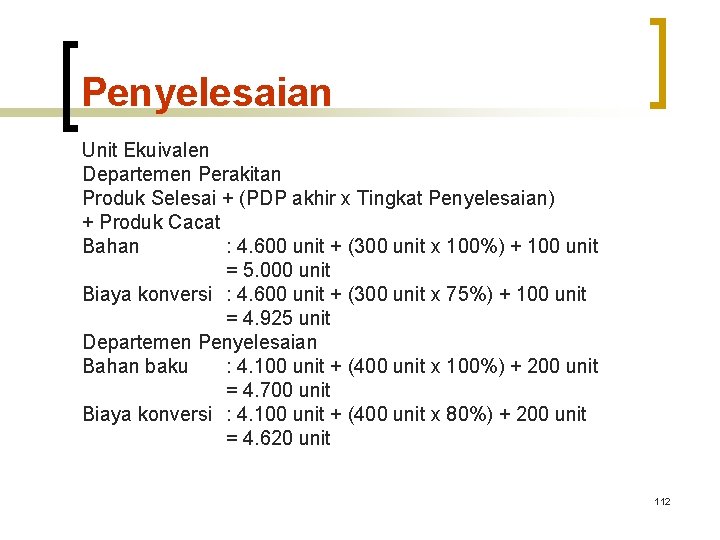
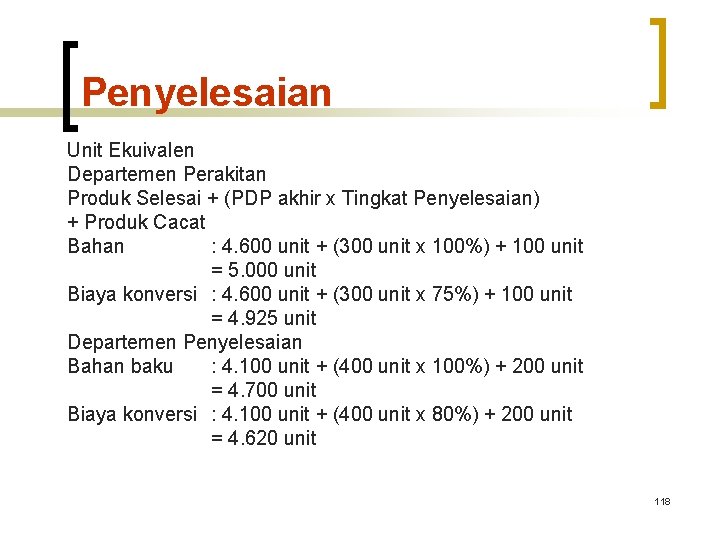
Penyelesaian Unit Ekuivalen Departemen Perakitan Produk Selesai + (PDP akhir x Tingkat Penyelesaian) + Produk Cacat Bahan : 4. 600 unit + (300 unit x 100%) + 100 unit = 5. 000 unit Biaya konversi : 4. 600 unit + (300 unit x 75%) + 100 unit = 4. 925 unit Departemen Penyelesaian Bahan baku : 4. 100 unit + (400 unit x 100%) + 200 unit = 4. 700 unit Biaya konversi : 4. 100 unit + (400 unit x 80%) + 200 unit = 4. 620 unit 112
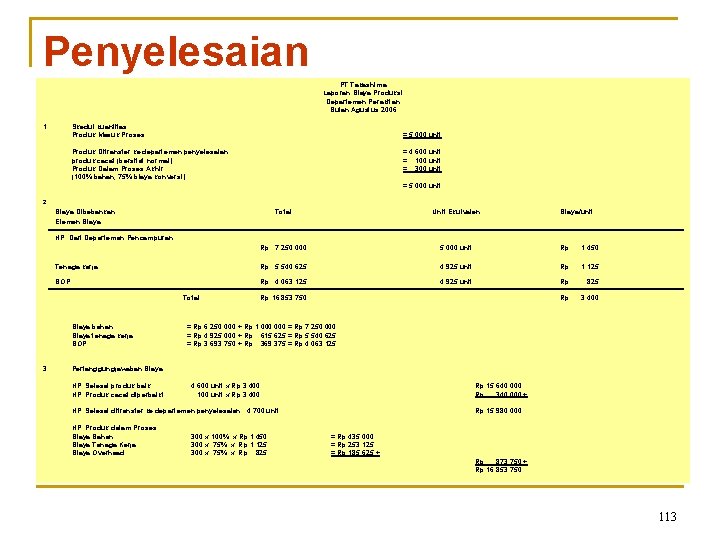
Penyelesaian PT Takashima Laporan Biaya Produksi Departemen Perakitan Bulan Agustus 2006 1. Skedul kuantitas Produk Masuk Proses = 5. 000 unit Produk Ditransfer ke departemen penyelesaian produk cacat (bersifat normal) Produk Dalam Proses Akhir (100% bahan, 75% biaya konversi) = 4. 600 unit = 100 unit = 300 unit = 5. 000 unit 2. Biaya Dibebankan Elemen Biaya Total Unit Ekuivalen Biaya/unit Rp 7. 250. 000 5. 000 unit Rp 1. 450 Rp 5. 540. 625 4. 925 unit Rp 1. 125 Rp 4. 063. 125 4. 925 unit Rp 825 Rp 3. 400 HP. Dari Departemen Pencampuran Tenaga kerja BOP Total Biaya bahan Biaya tenaga kerja BOP 3. Rp 16. 853. 750 = Rp 6. 250. 000 + Rp 1. 000 = Rp 7. 250. 000 = Rp 4. 925. 000 + Rp 615. 625 = Rp 5. 540. 625 = Rp 3. 693. 750 + Rp 369. 375 = Rp 4. 063. 125 Pertanggungjawaban Biaya HP. Selesai produk baik HP. Produk cacat diperbaiki : 4. 600 unit x Rp 3. 400 : 100 unit x Rp 3. 400 Rp 15. 640. 000 Rp 340. 000 + HP. Selesai ditransfer ke departemen penyelesaian : 4. 700 unit HP. Produk dalam Proses Biaya Bahan Biaya Tenaga Kerja Biaya Overhead : 300 x 100% x Rp 1. 450 : 300 x 75% x Rp 1. 125 : 300 x 75% x Rp 825 Rp 15. 980. 000 = Rp 435. 000 = Rp 253. 125 = Rp 185. 625 + Rp 873. 750 + Rp 16. 853. 750 113
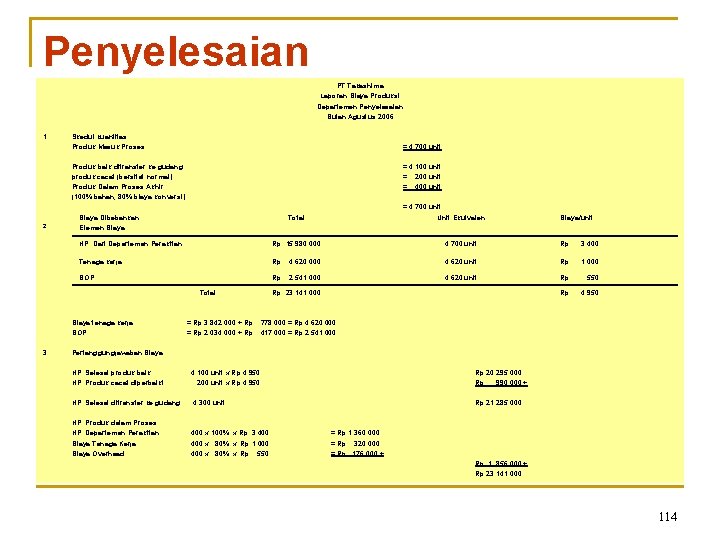
Penyelesaian PT Takashima Laporan Biaya Produksi Departemen Penyelesaian Bulan Agustus 2006 1. Skedul kuantitas Produk Masuk Proses = 4. 700 unit Produk baik ditransfer ke gudang produk cacat (bersifat normal) Produk Dalam Proses Akhir (100% bahan, 80% biaya konversi) = 4. 100 unit = 200 unit = 4. 700 unit 2. Biaya Dibebankan Elemen Biaya Total Unit Ekuivalen HP. Dari Departemen Perakitan Rp 15. 980. 000 4. 700 unit Rp 3. 400 Tenaga kerja Rp 4. 620. 000 4. 620 unit Rp 1. 000 BOP Rp 2. 541. 000 4. 620 unit Rp 550 Rp 4. 950 Total Biaya tenaga kerja BOP 3. = Rp 3. 842. 000 + Rp = Rp 2. 034. 000 + Rp Rp 23. 141. 000 Biaya/unit 778. 000 = Rp 4. 620. 000 417. 000 = Rp 2. 541. 000 Pertanggungjawaban Biaya HP. Selesai produk baik HP. Produk cacat diperbaiki : 4. 100 unit x Rp 4. 950 : 200 unit x Rp 4. 950 Rp 20. 295. 000 Rp 990. 000 + HP. Selesai ditransfer ke gudang : 4. 300 unit Rp 21. 285. 000 HP. Produk dalam Proses HP. Departemen Perakitan Biaya Tenaga Kerja Biaya Overhead : 400 x 100% x Rp 3. 400 : 400 x 80% x Rp 1. 000 : 400 x 80% x Rp 550 = Rp 1. 360. 000 = Rp 320. 000 = Rp 176. 000 + Rp 1. 856. 000 + Rp 23. 141. 000 114
Contoh 7 Produk Cacat Karena Kesalahan dan Diperbaiki Produk cacat karena kesalahan diperbaiki, maka biaya perbaikan produk cacat tidak boleh dibebani sebagai pengurang biaya produksi tetapi dimasukkan ke perkiraan rugi produk cacat. 115
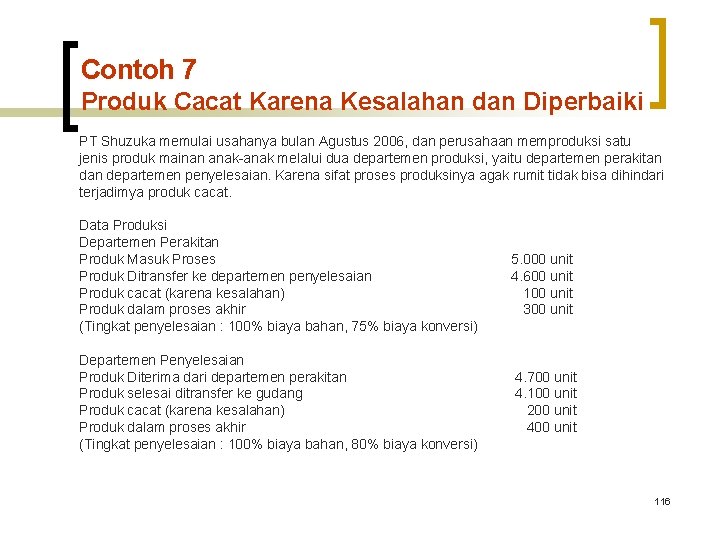
Contoh 7 Produk Cacat Karena Kesalahan dan Diperbaiki PT Shuzuka memulai usahanya bulan Agustus 2006, dan perusahaan memproduksi satu jenis produk mainan anak-anak melalui dua departemen produksi, yaitu departemen perakitan departemen penyelesaian. Karena sifat proses produksinya agak rumit tidak bisa dihindari terjadimya produk cacat. Data Produksi Departemen Perakitan Produk Masuk Proses Produk Ditransfer ke departemen penyelesaian Produk cacat (karena kesalahan) Produk dalam proses akhir (Tingkat penyelesaian : 100% biaya bahan, 75% biaya konversi) Departemen Penyelesaian Produk Diterima dari departemen perakitan Produk selesai ditransfer ke gudang Produk cacat (karena kesalahan) Produk dalam proses akhir (Tingkat penyelesaian : 100% biaya bahan, 80% biaya konversi) 5. 000 unit 4. 600 unit 100 unit 300 unit 4. 700 unit 4. 100 unit 200 unit 400 unit 116
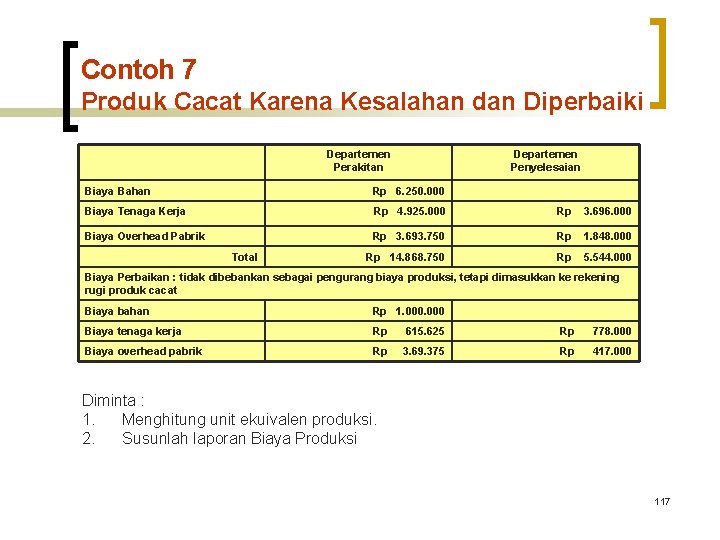
Contoh 7 Produk Cacat Karena Kesalahan dan Diperbaiki Departemen Perakitan Departemen Penyelesaian Biaya Bahan Rp 6. 250. 000 Biaya Tenaga Kerja Rp 4. 925. 000 Rp 3. 696. 000 Biaya Overhead Pabrik Rp 3. 693. 750 Rp 1. 848. 000 Rp 14. 868. 750 Rp 5. 544. 000 Total Biaya Perbaikan : tidak dibebankan sebagai pengurang biaya produksi, tetapi dimasukkan ke rekening rugi produk cacat Biaya bahan Rp 1. 000 Biaya tenaga kerja Rp 615. 625 Rp 778. 000 Biaya overhead pabrik Rp 3. 69. 375 Rp 417. 000 Diminta : 1. Menghitung unit ekuivalen produksi. 2. Susunlah laporan Biaya Produksi 117
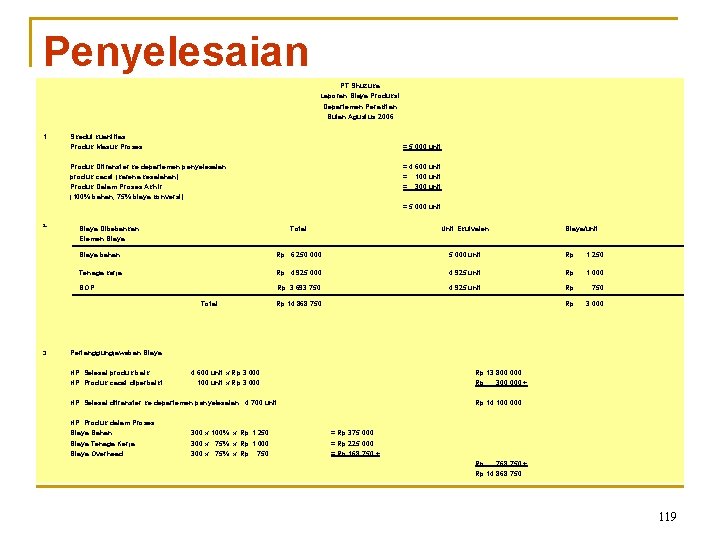
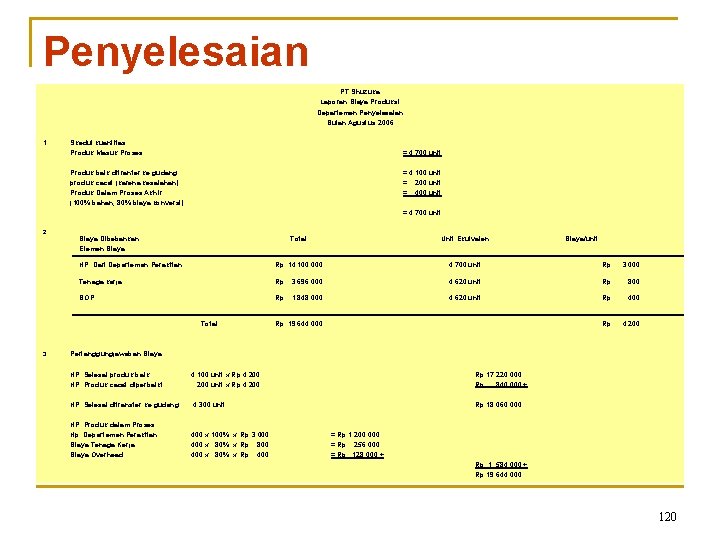
Penyelesaian Unit Ekuivalen Departemen Perakitan Produk Selesai + (PDP akhir x Tingkat Penyelesaian) + Produk Cacat Bahan : 4. 600 unit + (300 unit x 100%) + 100 unit = 5. 000 unit Biaya konversi : 4. 600 unit + (300 unit x 75%) + 100 unit = 4. 925 unit Departemen Penyelesaian Bahan baku : 4. 100 unit + (400 unit x 100%) + 200 unit = 4. 700 unit Biaya konversi : 4. 100 unit + (400 unit x 80%) + 200 unit = 4. 620 unit 118
Penyelesaian PT Shuzuka Laporan Biaya Produksi Departemen Perakitan Bulan Agustus 2006 1. Skedul kuantitas Produk Masuk Proses = 5. 000 unit Produk Ditransfer ke departemen penyelesaian produk cacat (karena kesalahan) Produk Dalam Proses Akhir (100% bahan, 75% biaya konversi) = 4. 600 unit = 100 unit = 300 unit = 5. 000 unit 2. Biaya Dibebankan Elemen Biaya Total Unit Ekuivalen Biaya bahan Rp 6. 250. 000 5. 000 unit Rp 1. 250 Tenaga kerja Rp 4. 925. 000 4. 925 unit Rp 1. 000 BOP Rp 3. 693. 750 4. 925 unit Rp 750 Rp 3. 000 Total 3. Rp 14. 868. 750 Biaya/unit Pertanggungjawaban Biaya HP. Selesai produk baik HP. Produk cacat diperbaiki : 4. 600 unit x Rp 3. 000 : 100 unit x Rp 3. 000 Rp 13. 800. 000 Rp 300. 000 + HP. Selesai ditransfer ke departemen penyelesaian : 4. 700 unit HP. Produk dalam Proses Biaya Bahan Biaya Tenaga Kerja Biaya Overhead : 300 x 100% x Rp 1. 250 : 300 x 75% x Rp 1. 000 : 300 x 75% x Rp 750 Rp 14. 100. 000 = Rp 375. 000 = Rp 225. 000 = Rp 168. 750 + Rp 768. 750 + Rp 14. 868. 750 119
Penyelesaian PT Shuzuka Laporan Biaya Produksi Departemen Penyelesaian Bulan Agustus 2006 1. Skedul kuantitas Produk Masuk Proses = 4. 700 unit Produk baik ditranfer ke gudang produk cacat (karena kesalahan) Produk Dalam Proses Akhir (100% bahan, 80% biaya konversi) = 4. 100 unit = 200 unit = 4. 700 unit 2. Biaya Dibebankan Elemen Biaya Total Unit Ekuivalen HP. Dari Departemen Perakitan Rp 14. 100. 000 4. 700 unit Rp 3. 000 Tenaga kerja Rp 3. 696. 000 4. 620 unit Rp 800 BOP Rp 1. 848. 000 4. 620 unit Rp 400 Rp 4. 200 Total 3. Rp 19. 644. 000 Biaya/unit Pertanggungjawaban Biaya HP. Selesai produk baik HP. Produk cacat diperbaiki : 4. 100 unit x Rp 4. 200 : 200 unit x Rp 4. 200 Rp 17. 220. 000 Rp 840. 000 + HP. Selesai ditransfer ke gudang : 4. 300 unit Rp 18. 060. 000 HP. Produk dalam Proses Hp. Departemen Perakitan Biaya Tenaga Kerja Biaya Overhead : 400 x 100% x Rp 3. 000 : 400 x 80% x Rp 800 : 400 x 80% x Rp 400 = Rp 1. 200. 000 = Rp 256. 000 = Rp 128. 000 + Rp 1. 584. 000 + Rp 19. 644. 000 120
Produk Rusak Produk rusak adalah produk yang dihasilkan dalam proses produksi, dimana produk yang dihasilkan tersebut tidak sesuai dengan standar mutu yang ditetapkan, tetapi secara ekonomis produk tersebut dapat diperbaiki dengan mengeluarkan biaya tertentu, tetapi besarnya biaya yang dikeluarkan cenderung lebih besar dari nilai jual setelah produk selesai diperbaiki. Produk rusak umumnya diketahui setelah proses produksi selesai. 121
Faktor Penyebab Produk Rusak 1. 2. Bersifat normal : dimana setiap proses produksi tidak bisa dihindari terjadinya produk rusak, maka perusahaan telah memperhitungkan sebelumnya bahwa adanya produk rusak. Akibat kesalahan : dimana terjadinya produk rusak diakibatkan kesalahan proses produksi seperti kurangnya pengawasan, pengendalian, kelalaian pekerja dll. Perhitungan Unit Ekuivalen Produksi Produk Selesai + (PDP Akhir x Tingkat Penyelesaian) +Produk Rusak 122
Perlakuan Harga Pokok Produk Rusak 1. 2. 3. 4. Produk rusak bersifat normal, laku dijual. Produk rusak yang bersifat normal dan laku dijual, maka hasil penjualannya diperlakukan : a. Penghasilan lain-lain. b. Pengurang biaya overhead pabrik. c. Pengurang setiap elemen biaya produksi. d. pengurang harga pokok produk selesai. Produk rusak bersifat normal, tidak laku dijual. Harga pokok produk rusak akan dibebankan ke produk selesai, yang mengakibatkan harga pokok produk selesai per unit lebih besar. Produk rusak karena kesalahan, laku dijual. Hasil penjualan produk rusak diperlakukan sebagai pengurang rugi produk rusak. Produk rusak karena kesalahan, tidak laku dijual. Harga pokok produk rusak diperlakukan sebagai kerugian dengan perkiraan tersendiri yaitu Rugi Produk Rusak. 123
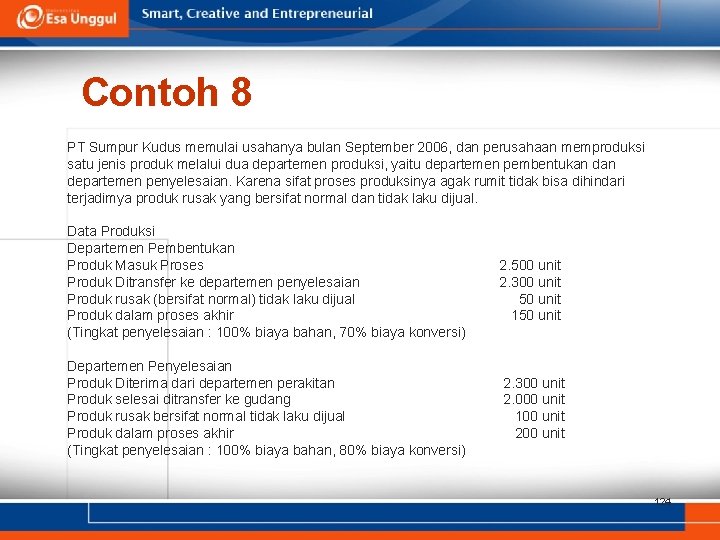
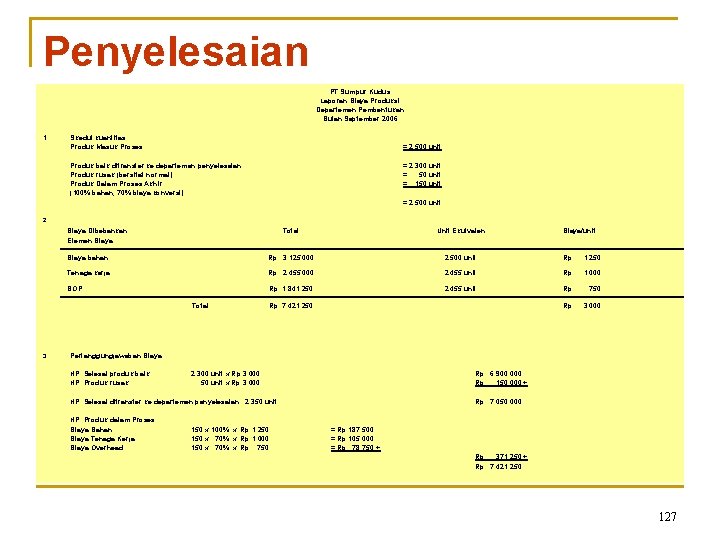
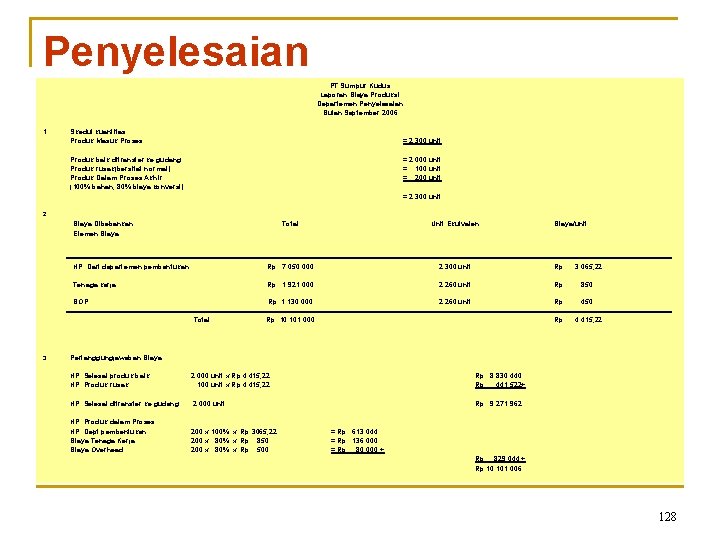
Contoh 8 PT Sumpur Kudus memulai usahanya bulan September 2006, dan perusahaan memproduksi satu jenis produk melalui dua departemen produksi, yaitu departemen pembentukan departemen penyelesaian. Karena sifat proses produksinya agak rumit tidak bisa dihindari terjadimya produk rusak yang bersifat normal dan tidak laku dijual. Data Produksi Departemen Pembentukan Produk Masuk Proses Produk Ditransfer ke departemen penyelesaian Produk rusak (bersifat normal) tidak laku dijual Produk dalam proses akhir (Tingkat penyelesaian : 100% biaya bahan, 70% biaya konversi) Departemen Penyelesaian Produk Diterima dari departemen perakitan Produk selesai ditransfer ke gudang Produk rusak bersifat normal tidak laku dijual Produk dalam proses akhir (Tingkat penyelesaian : 100% biaya bahan, 80% biaya konversi) 2. 500 unit 2. 300 unit 50 unit 150 unit 2. 300 unit 2. 000 unit 100 unit 200 unit 124
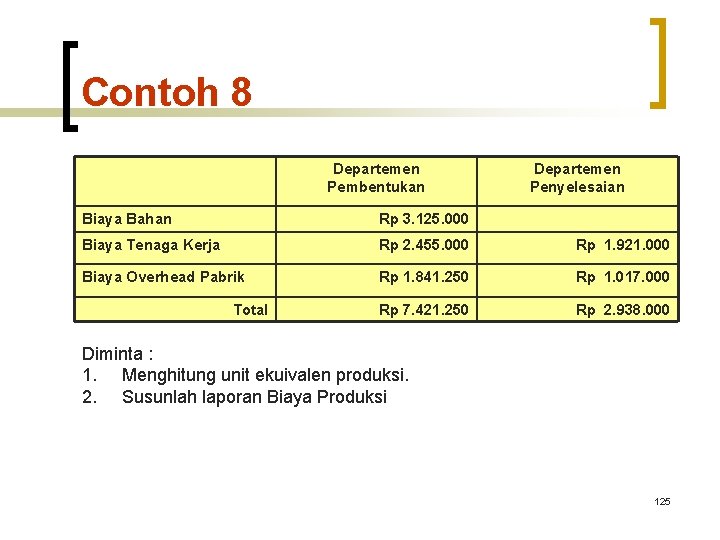
Contoh 8 Departemen Pembentukan Departemen Penyelesaian Biaya Bahan Rp 3. 125. 000 Biaya Tenaga Kerja Rp 2. 455. 000 Rp 1. 921. 000 Biaya Overhead Pabrik Rp 1. 841. 250 Rp 1. 017. 000 Rp 7. 421. 250 Rp 2. 938. 000 Total Diminta : 1. Menghitung unit ekuivalen produksi. 2. Susunlah laporan Biaya Produksi 125
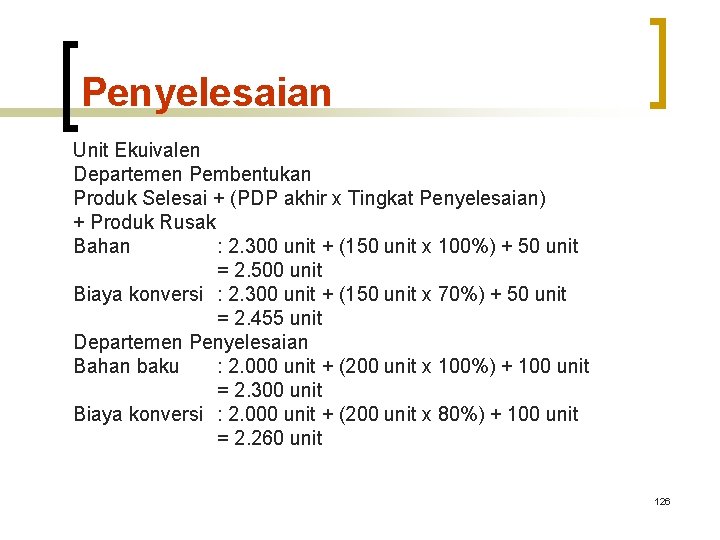
Penyelesaian Unit Ekuivalen Departemen Pembentukan Produk Selesai + (PDP akhir x Tingkat Penyelesaian) + Produk Rusak Bahan : 2. 300 unit + (150 unit x 100%) + 50 unit = 2. 500 unit Biaya konversi : 2. 300 unit + (150 unit x 70%) + 50 unit = 2. 455 unit Departemen Penyelesaian Bahan baku : 2. 000 unit + (200 unit x 100%) + 100 unit = 2. 300 unit Biaya konversi : 2. 000 unit + (200 unit x 80%) + 100 unit = 2. 260 unit 126
Penyelesaian PT Sumpur Kudus Laporan Biaya Produksi Departemen Pembentukan Bulan September 2006 1. Skedul kuantitas Produk Masuk Proses = 2. 500 unit Produk baik ditransfer ke departemen penyelesaian Produk rusak (bersifat normal) Produk Dalam Proses Akhir (100% bahan, 70% biaya konversi) = 2. 300 unit = 50 unit = 150 unit = 2. 500 unit 2. Biaya Dibebankan Elemen Biaya Total Unit Ekuivalen Biaya bahan Rp 3. 125. 000 2. 500 unit Rp 1. 250 Tenaga kerja Rp 2. 455. 000 2. 455 unit Rp 1. 000 BOP Rp 1. 841. 250 2. 455 unit Rp 750 Rp 3. 000 Total 3. Rp 7. 421. 250 Biaya/unit Pertanggungjawaban Biaya HP. Selesai produk baik HP. Produk rusak : 2. 300 unit x Rp 3. 000 : 50 unit x Rp 3. 000 Rp 6. 900. 000 Rp 150. 000 + HP. Selesai ditransfer ke departemen penyelesaian : 2. 350 unit HP. Produk dalam Proses Biaya Bahan Biaya Tenaga Kerja Biaya Overhead : 150 x 100% x Rp 1. 250 : 150 x 70% x Rp 1. 000 : 150 x 70% x Rp 750 Rp 7. 050. 000 = Rp 187. 500 = Rp 105. 000 = Rp 78. 750 + Rp 371. 250 + Rp 7. 421. 250 127
Penyelesaian PT Sumpur Kudus Laporan Biaya Produksi Departemen Penyelesaian Bulan September 2006 1. Skedul kuantitas Produk Masuk Proses = 2. 300 unit Produk baik ditransfer ke gudang Produk rusak(bersifat normal) Produk Dalam Proses Akhir (100% bahan, 80% biaya konversi) = 2. 000 unit = 100 unit = 2. 300 unit 2. Biaya Dibebankan Elemen Biaya Total Unit Ekuivalen HP. Dari departemen pembentukan Rp 7. 050. 000 2. 300 unit Rp 3. 065, 22 Tenaga kerja Rp 1. 921. 000 2. 260 unit Rp 850 BOP Rp 1. 130. 000 2. 260 unit Rp 450 Rp 4. 415, 22 Total 3. Rp 10. 101. 000 Biaya/unit Pertanggungjawaban Biaya HP. Selesai produk baik HP. Produk rusak : 2. 000 unit x Rp 4. 415, 22 : 100 unit x Rp 4. 415, 22 Rp 8. 830. 440 Rp 441. 522+ HP. Selesai ditransfer ke gudang : 2. 000 unit Rp 9. 271. 962 HP. Produk dalam Proses HP. Dept pembentukan Biaya Tenaga Kerja Biaya Overhead : 200 x 100% x Rp 3065, 22 : 200 x 80% x Rp 850 : 200 x 80% x Rp 500 = Rp 613. 044 = Rp 136. 000 = Rp 80. 000 + Rp 829. 044 + Rp 10. 101. 006 128
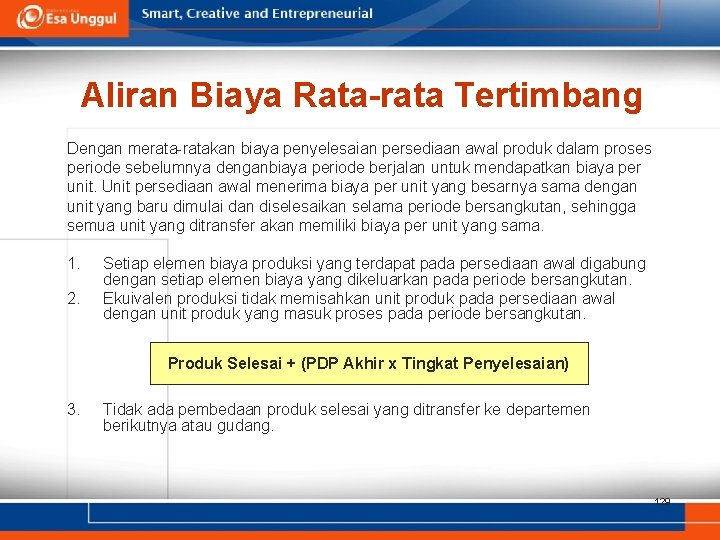
Aliran Biaya Rata-rata Tertimbang Dengan merata-ratakan biaya penyelesaian persediaan awal produk dalam proses periode sebelumnya denganbiaya periode berjalan untuk mendapatkan biaya per unit. Unit persediaan awal menerima biaya per unit yang besarnya sama dengan unit yang baru dimulai dan diselesaikan selama periode bersangkutan, sehingga semua unit yang ditransfer akan memiliki biaya per unit yang sama. 1. 2. Setiap elemen biaya produksi yang terdapat pada persediaan awal digabung dengan setiap elemen biaya yang dikeluarkan pada periode bersangkutan. Ekuivalen produksi tidak memisahkan unit produk pada persediaan awal dengan unit produk yang masuk proses pada periode bersangkutan. Produk Selesai + (PDP Akhir x Tingkat Penyelesaian) 3. Tidak ada pembedaan produk selesai yang ditransfer ke departemen berikutnya atau gudang. 129
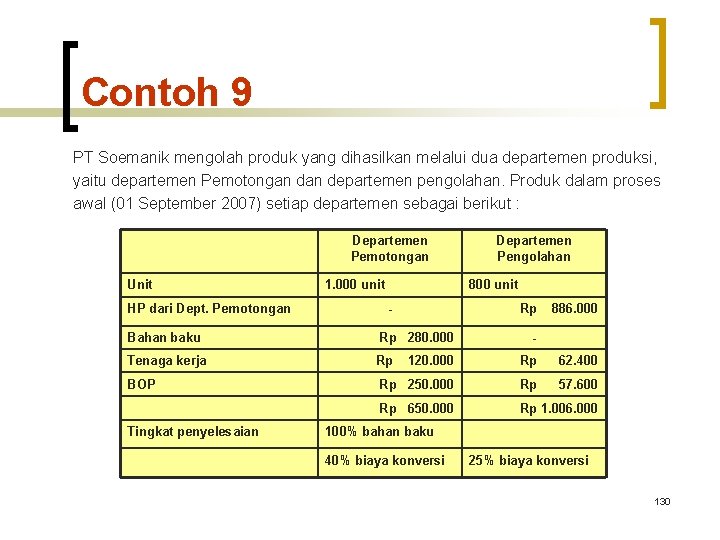
Contoh 9 PT Soemanik mengolah produk yang dihasilkan melalui dua departemen produksi, yaitu departemen Pemotongan departemen pengolahan. Produk dalam proses awal (01 September 2007) setiap departemen sebagai berikut : Departemen Pemotongan Unit HP dari Dept. Pemotongan 1. 000 unit Departemen Pengolahan 800 unit - Rp 886. 000 Bahan baku Rp 280. 000 Tenaga kerja Rp 120. 000 Rp 62. 400 BOP Rp 250. 000 Rp 57. 600 Rp 650. 000 Rp 1. 006. 000 Tingkat penyelesaian - 100% bahan baku 40% biaya konversi 25% biaya konversi 130
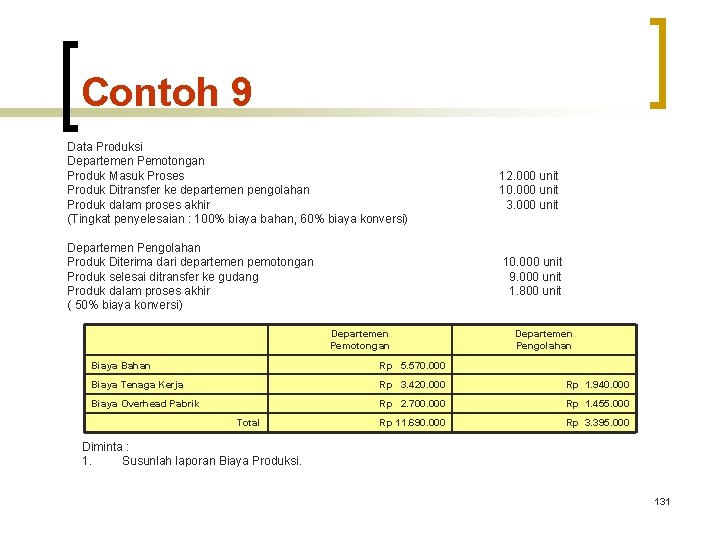
Contoh 9 Data Produksi Departemen Pemotongan Produk Masuk Proses Produk Ditransfer ke departemen pengolahan Produk dalam proses akhir (Tingkat penyelesaian : 100% biaya bahan, 60% biaya konversi) Departemen Pengolahan Produk Diterima dari departemen pemotongan Produk selesai ditransfer ke gudang Produk dalam proses akhir ( 50% biaya konversi) 12. 000 unit 10. 000 unit 3. 000 unit 10. 000 unit 9. 000 unit 1. 800 unit Departemen Pemotongan Departemen Pengolahan Biaya Bahan Rp 5. 570. 000 Biaya Tenaga Kerja Rp 3. 420. 000 Rp 1. 940. 000 Biaya Overhead Pabrik Rp 2. 700. 000 Rp 1. 455. 000 Rp 11. 690. 000 Rp 3. 395. 000 Total Diminta : 1. Susunlah laporan Biaya Produksi. 131
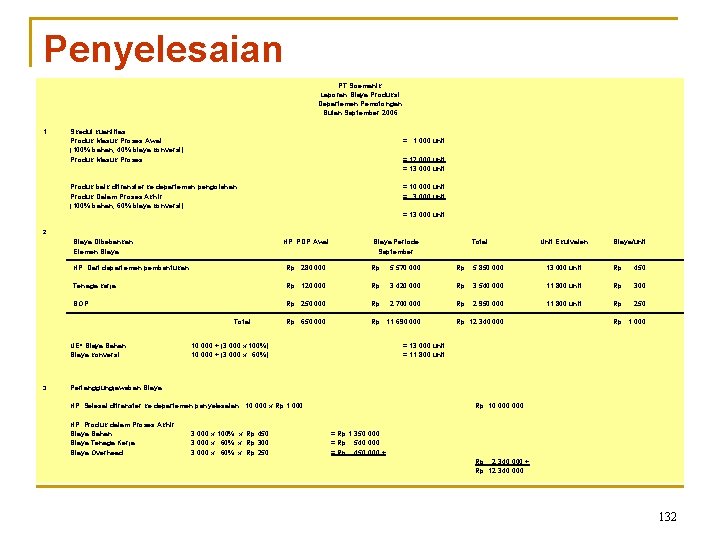
Penyelesaian PT Soemanik Laporan Biaya Produksi Departemen Pemotongan Bulan September 2006 1. Skedul kuantitas Produk Masuk Proses Awal (100% bahan, 40% biaya konversi) Produk Masuk Proses = 1. 000 unit = 12. 000 unit = 13. 000 unit Produk baik ditransfer ke departemen pengolahan Produk Dalam Proses Akhir (100% bahan, 60% biaya konversi) = 10. 000 unit = 3. 000 unit = 13. 000 unit 2. Biaya Dibebankan Elemen Biaya HP. PDP Awal Total Unit Ekuivalen Biaya/unit HP. Dari departemen pembentukan Rp 280. 000 Rp 5. 570. 000 Rp 5. 850. 000 13. 000 unit Rp 450 Tenaga kerja Rp 120. 000 Rp 3. 420. 000 Rp 3. 540. 000 11. 800 unit Rp 300 BOP Rp 250. 000 Rp 2. 700. 000 Rp 2. 950. 000 11. 800 unit Rp 250 Rp 650. 000 Rp 11. 690. 000 Total UE* Biaya Bahan Biaya konversi 3. Biaya Periode September : 10. 000 + (3. 000 x 100%) : 10. 000 + (3. 000 x 60%) Rp 12. 340. 000 Rp 1. 000 = 13. 000 unit = 11. 800 unit Pertanggungjawaban Biaya HP. Selesai ditransfer ke departemen penyelesaian : 10. 000 x Rp 1. 000 HP. Produk dalam Proses Akhir Biaya Bahan Biaya Tenaga Kerja Biaya Overhead : 3. 000 x 100% x Rp 450 : 3. 000 x 60% x Rp 300 : 3. 000 x 60% x Rp 250 Rp 10. 000 = Rp 1. 350. 000 = Rp 540. 000 = Rp 450. 000 + Rp 2. 340. 000 + Rp 12. 340. 000 132
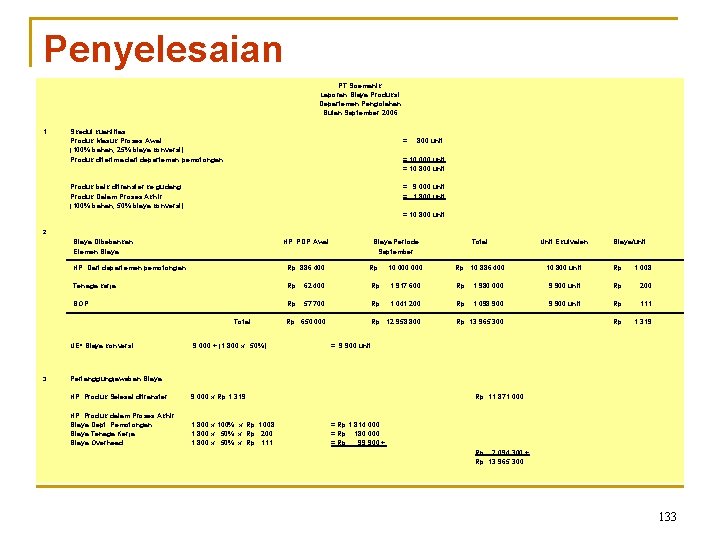
Penyelesaian PT Soemanik Laporan Biaya Produksi Departemen Pengolahan Bulan September 2006 1. Skedul kuantitas Produk Masuk Proses Awal (100% bahan, 25% biaya konversi) Produk diterima dari departemen pemotongan = 800 unit = 10. 000 unit = 10. 800 unit Produk baik ditransfer ke gudang Produk Dalam Proses Akhir (100% bahan, 50% biaya konversi) = 9. 000 unit = 1. 800 unit = 10. 800 unit 2. Biaya Dibebankan Elemen Biaya HP. PDP Awal Total Unit Ekuivalen Biaya/unit 10. 800 unit Rp 1. 008 HP. Dari departemen pemotongan Rp 886. 400 Rp 10. 000 Rp 10. 886. 400 Tenaga kerja Rp 62. 400 Rp 1. 917. 600 Rp 1. 980. 000 9. 900 unit Rp 200 BOP Rp 57. 700 Rp 1. 041. 200 Rp 1. 098. 900 9. 900 unit Rp 111 Rp 1. 319 Total UE* Biaya konversi 3. Biaya Periode September : 9. 000 + (1. 800 x 50%) Rp 650. 000 Rp 12. 958. 800 Rp 13. 965. 300 = 9. 900 unit Pertanggungjawaban Biaya HP. Produk Selesai ditransfer : 9. 000 x Rp 1. 319 HP. Produk dalam Proses Akhir Biaya Dept. Pemotongan Biaya Tenaga Kerja Biaya Overhead : 1. 800 x 100% x Rp 1. 008 : 1. 800 x 50% x Rp 200 : 1. 800 x 50% x Rp 111 Rp 11. 871. 000 = Rp 1. 814. 000 = Rp 180. 000 = Rp 99. 900 + Rp 2. 094. 300 + Rp 13. 965. 300 133
Aliran Biaya FIFO Dengan memisahkan biaya per unit yang terdapat pada persediaan awal dari biaya per unit produk yang dimasukkan diselesaikan pada suatu periode tertentu. Biaya produk yang ditransfer terdiri dari biaya produk dalam proses awal dari periode sebelumnya, dan biaya produk dari produk yang dimulai dan diselesaikan selama periode berjalan. 1. Setiap elemen biaya produksi yang terdapat pada persediaan awal tidak digabung dengan setiap elemen biaya yang dikeluarkan pada periode bersangkutan. 2. Tahapan proses produksi menyelesaikan terlebih dahulu produk dalam proses awal, kemudian baru menyelesaikan produk masuk proses periode bersangkutan. 3. Ekuivalen produksi memisahkan unit produk pada persediaan awal dengan unit produk yang masuk proses pada periode bersangkutan. Produk Selesai + (PDP Akhir x Tingkat Penyelesaian) - (PDP Awal x Tingkat Penyelesaian) 4. Adanya perbedaan produk selesai yang ditransfer ke departemen berikutnya atau gudang yaitu produk selesai dari produk dalam proses awal dan produk selesai dari produk yang masuk proses periode bersangkutan. 134
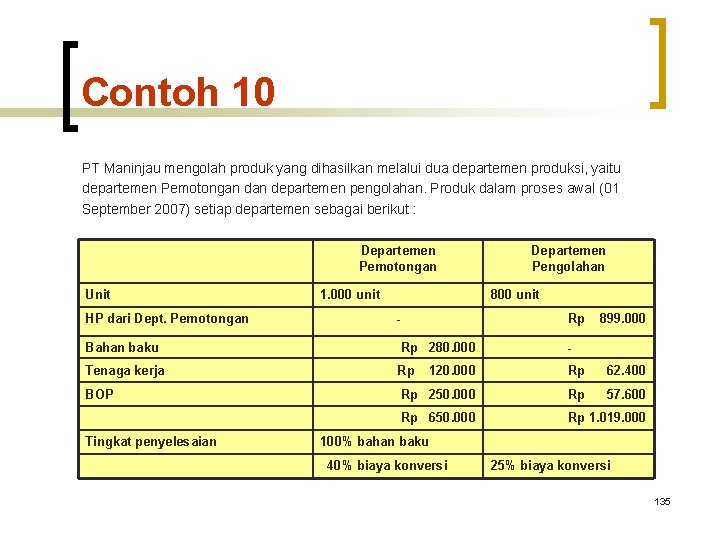
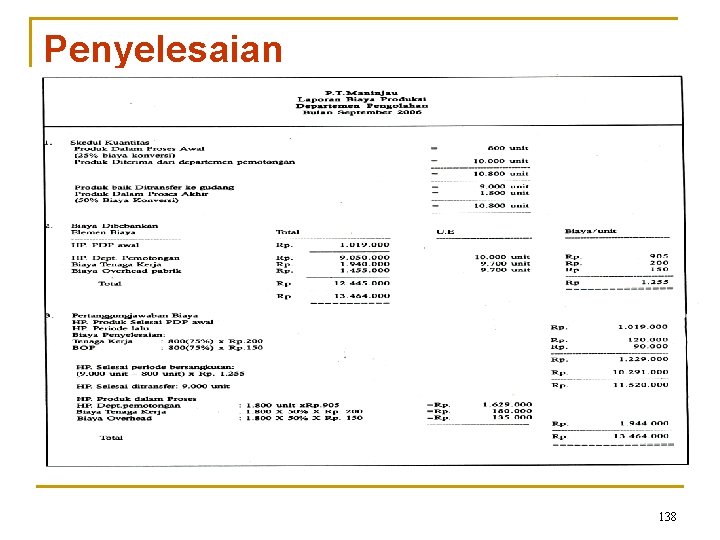
Contoh 10 PT Maninjau mengolah produk yang dihasilkan melalui dua departemen produksi, yaitu departemen Pemotongan departemen pengolahan. Produk dalam proses awal (01 September 2007) setiap departemen sebagai berikut : Departemen Pemotongan Unit HP dari Dept. Pemotongan 1. 000 unit Departemen Pengolahan 800 unit - Rp 899. 000 Bahan baku Rp 280. 000 - Tenaga kerja Rp 120. 000 Rp 62. 400 BOP Rp 250. 000 Rp 57. 600 Rp 650. 000 Rp 1. 019. 000 Tingkat penyelesaian 100% bahan baku 40% biaya konversi 25% biaya konversi 135
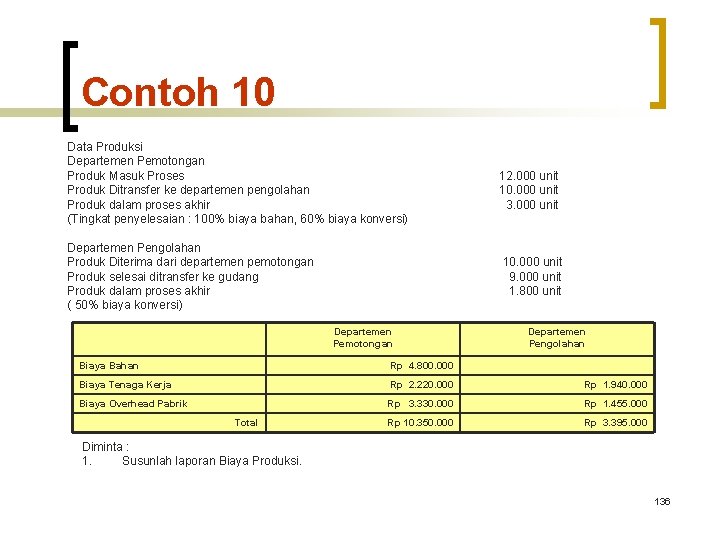
Contoh 10 Data Produksi Departemen Pemotongan Produk Masuk Proses Produk Ditransfer ke departemen pengolahan Produk dalam proses akhir (Tingkat penyelesaian : 100% biaya bahan, 60% biaya konversi) Departemen Pengolahan Produk Diterima dari departemen pemotongan Produk selesai ditransfer ke gudang Produk dalam proses akhir ( 50% biaya konversi) 12. 000 unit 10. 000 unit 3. 000 unit 10. 000 unit 9. 000 unit 1. 800 unit Departemen Pemotongan Departemen Pengolahan Biaya Bahan Rp 4. 800. 000 Biaya Tenaga Kerja Rp 2. 220. 000 Rp 1. 940. 000 Biaya Overhead Pabrik Rp 3. 330. 000 Rp 1. 455. 000 Rp 10. 350. 000 Rp 3. 395. 000 Total Diminta : 1. Susunlah laporan Biaya Produksi. 136
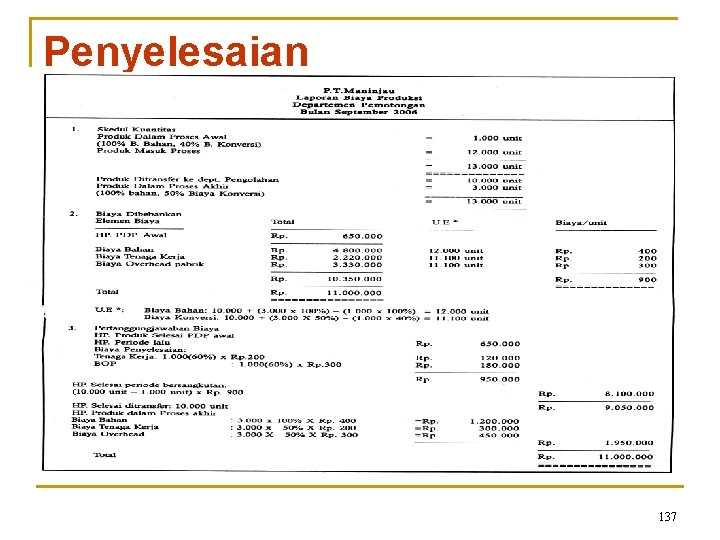
Penyelesaian 137
Penyelesaian 138
End of Chapter 17 © 2003 Prentice Hall Business Publishing, Cost Accounting 11/e, Horngren/Datar/Foster 17 - 139
Process Costing with Standard Costs n n n Simplify costing process Eliminate periodic cost recomputations Same as FIFO computations q n n n Emphasize current period costs and production Inventories are stated at standard cost Variances are calculated for material, labor, and overhead Assigns a “normal” production cost to the equivalent units of output each period Allows managers to quickly recognize and investigate significant deviations from expected production costs Allows benchmarking with other firms © 2011 Cengage Learning. All Rights Reserved. May not be copied, scanned, or duplicated, in whole or in part, except for use as permitted in a license distributed with a certain product or service or otherwise on a password-protected website for classroom use.
Hybrid Costing Systems n n n Characteristics of job order and process costing systems Various product lines q Different direct material—job order costing q Different direct labor—job order costing q Same process—process costing Hybrid costing used for furniture, clothing, jam © 2011 Cengage Learning. All Rights Reserved. May not be copied, scanned, or duplicated, in whole or in part, except for use as permitted in a license distributed with a certain product or service or otherwise on a password-protected website for classroom use.
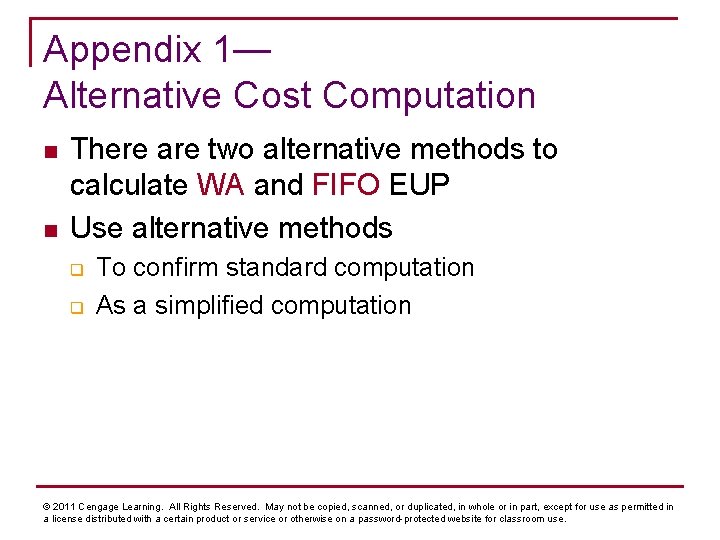
Appendix 1— Alternative Cost Computation n n There are two alternative methods to calculate WA and FIFO EUP Use alternative methods q q To confirm standard computation As a simplified computation © 2011 Cengage Learning. All Rights Reserved. May not be copied, scanned, or duplicated, in whole or in part, except for use as permitted in a license distributed with a certain product or service or otherwise on a password-protected website for classroom use.
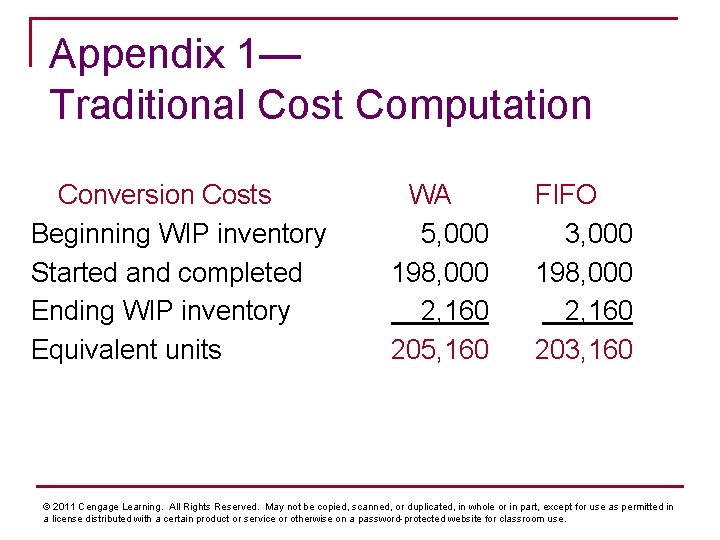
Appendix 1— Traditional Cost Computation Conversion Costs Beginning WIP inventory Started and completed Ending WIP inventory Equivalent units WA 5, 000 198, 000 2, 160 205, 160 FIFO 3, 000 198, 000 2, 160 203, 160 © 2011 Cengage Learning. All Rights Reserved. May not be copied, scanned, or duplicated, in whole or in part, except for use as permitted in a license distributed with a certain product or service or otherwise on a password-protected website for classroom use.
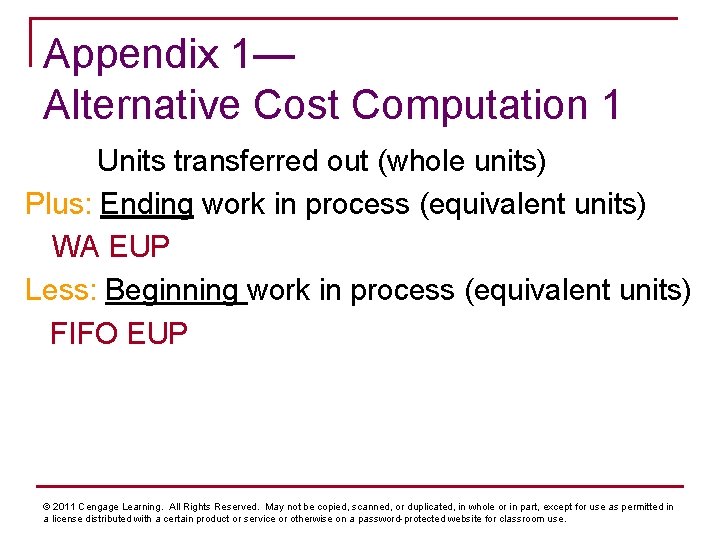
Appendix 1— Alternative Cost Computation 1 Units transferred out (whole units) Plus: Ending work in process (equivalent units) WA EUP Less: Beginning work in process (equivalent units) FIFO EUP © 2011 Cengage Learning. All Rights Reserved. May not be copied, scanned, or duplicated, in whole or in part, except for use as permitted in a license distributed with a certain product or service or otherwise on a password-protected website for classroom use.
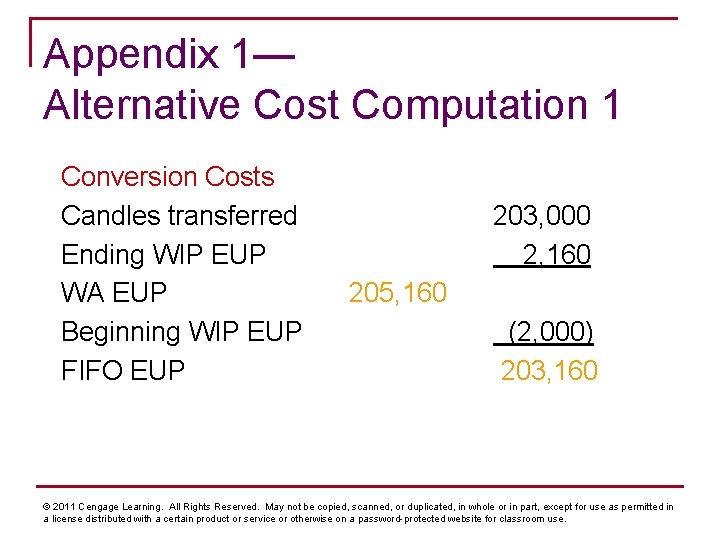
Appendix 1— Alternative Cost Computation 1 Conversion Costs Candles transferred Ending WIP EUP WA EUP Beginning WIP EUP FIFO EUP 203, 000 2, 160 205, 160 (2, 000) 203, 160 © 2011 Cengage Learning. All Rights Reserved. May not be copied, scanned, or duplicated, in whole or in part, except for use as permitted in a license distributed with a certain product or service or otherwise on a password-protected website for classroom use.
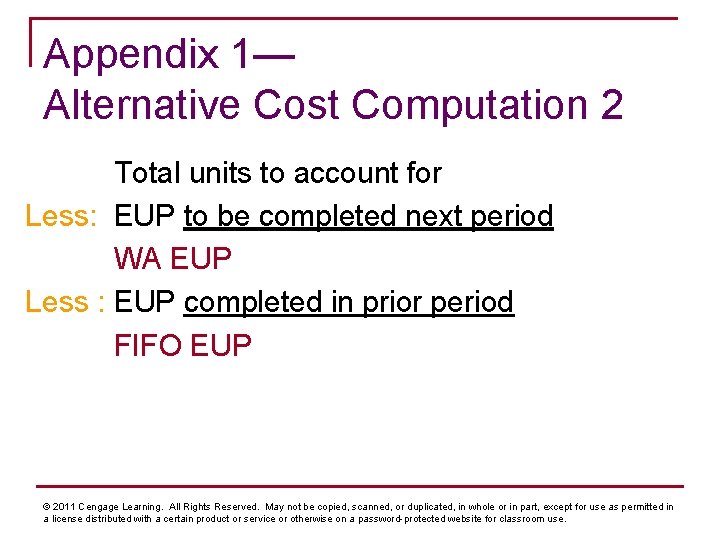
Appendix 1— Alternative Cost Computation 2 Total units to account for Less: EUP to be completed next period WA EUP Less : EUP completed in prior period FIFO EUP © 2011 Cengage Learning. All Rights Reserved. May not be copied, scanned, or duplicated, in whole or in part, except for use as permitted in a license distributed with a certain product or service or otherwise on a password-protected website for classroom use.
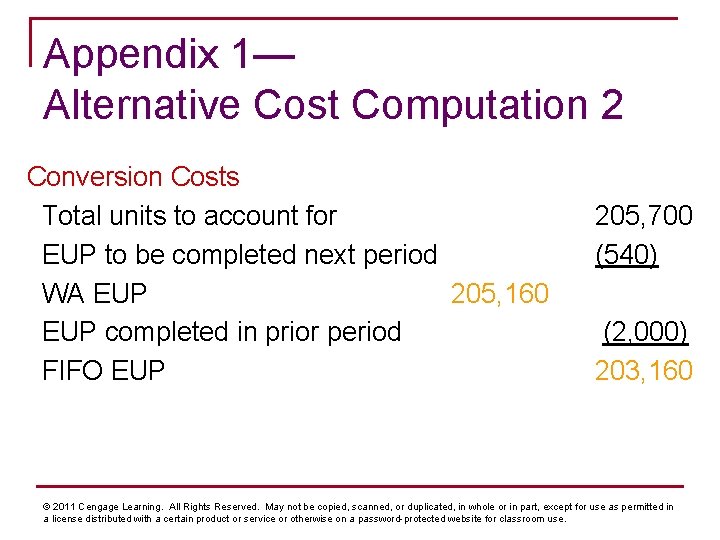
Appendix 1— Alternative Cost Computation 2 Conversion Costs Total units to account for EUP to be completed next period WA EUP 205, 160 EUP completed in prior period FIFO EUP 205, 700 (540) (2, 000) 203, 160 © 2011 Cengage Learning. All Rights Reserved. May not be copied, scanned, or duplicated, in whole or in part, except for use as permitted in a license distributed with a certain product or service or otherwise on a password-protected website for classroom use.
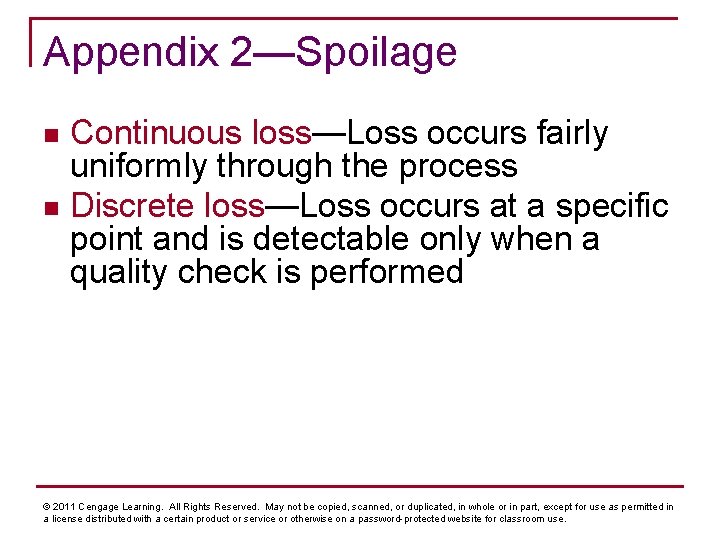
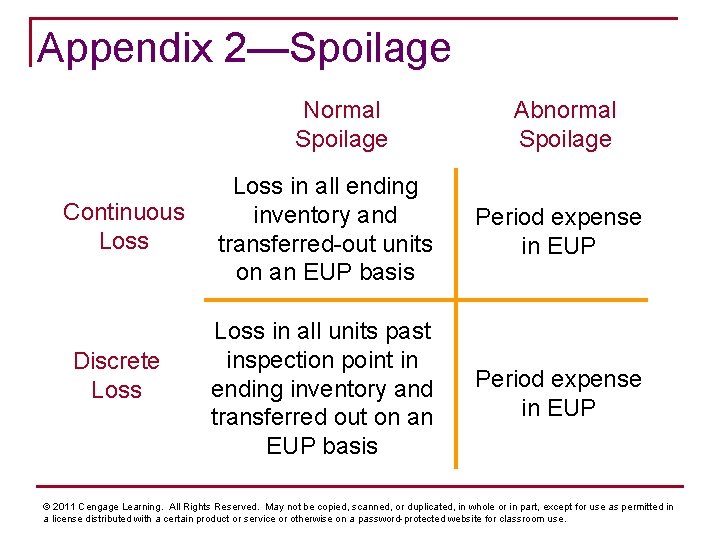
Appendix 2—Spoilage Continuous loss—Loss occurs fairly uniformly through the process n Discrete loss—Loss occurs at a specific point and is detectable only when a quality check is performed n © 2011 Cengage Learning. All Rights Reserved. May not be copied, scanned, or duplicated, in whole or in part, except for use as permitted in a license distributed with a certain product or service or otherwise on a password-protected website for classroom use.
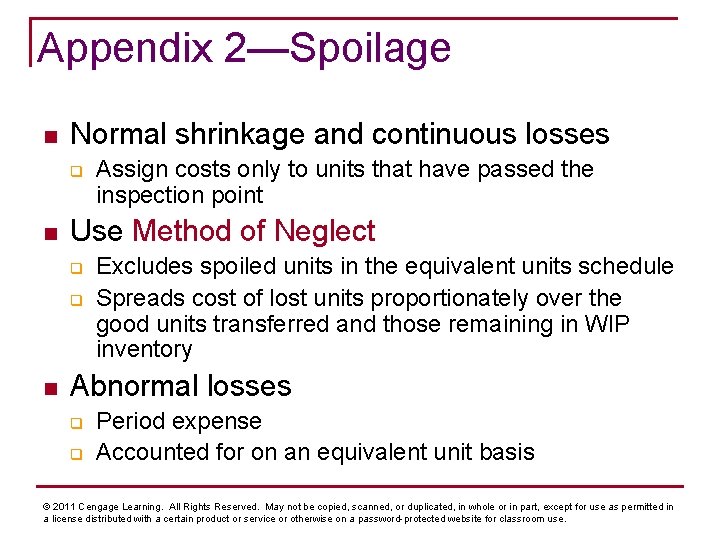
Appendix 2—Spoilage n Normal shrinkage and continuous losses q n Use Method of Neglect q q n Assign costs only to units that have passed the inspection point Excludes spoiled units in the equivalent units schedule Spreads cost of lost units proportionately over the good units transferred and those remaining in WIP inventory Abnormal losses q q Period expense Accounted for on an equivalent unit basis © 2011 Cengage Learning. All Rights Reserved. May not be copied, scanned, or duplicated, in whole or in part, except for use as permitted in a license distributed with a certain product or service or otherwise on a password-protected website for classroom use.
Appendix 2—Spoilage Normal Spoilage Continuous Loss Discrete Loss Abnormal Spoilage Loss in all ending inventory and transferred-out units on an EUP basis Period expense in EUP Loss in all units past inspection point in ending inventory and transferred out on an EUP basis Period expense in EUP © 2011 Cengage Learning. All Rights Reserved. May not be copied, scanned, or duplicated, in whole or in part, except for use as permitted in a license distributed with a certain product or service or otherwise on a password-protected website for classroom use.
Questions n n n What is an EUP? What is the difference between the WA and FIFO methods of calculating equivalent units? Why would a company use a hybrid costing system? © 2011 Cengage Learning. All Rights Reserved. May not be copied, scanned, or duplicated, in whole or in part, except for use as permitted in a license distributed with a certain product or service or otherwise on a password-protected website for classroom use.
Potential Ethical Issues Over- or underestimating completion % for ending WIP inventory to distort results n Using outdated standard costs n Ignoring the assignment of significant direct costs to specific jobs n Treating abnormal spoilage as normal spoilage n © 2011 Cengage Learning. All Rights Reserved. May not be copied, scanned, or duplicated, in whole or in part, except for use as permitted in a license distributed with a certain product or service or otherwise on a password-protected website for classroom use.