Methods for Dummies Overview and Introduction 23 rd


- Slides: 25
Methods for Dummies Overview and Introduction 23 rd October 2014 Svenja Espenhahn and Sofie Meyer
PROS • • Relaxed environment Presentation skills Networking/knowing who to ask No assessment involved Fun at the FIL Know-how/practical guide Presenting with partner Learning – Specific/deep understanding – Overall view CONS
Overview • What is Mf. D? • Programme • How to prepare your presentation • Where to find information and help • Experts • SPM
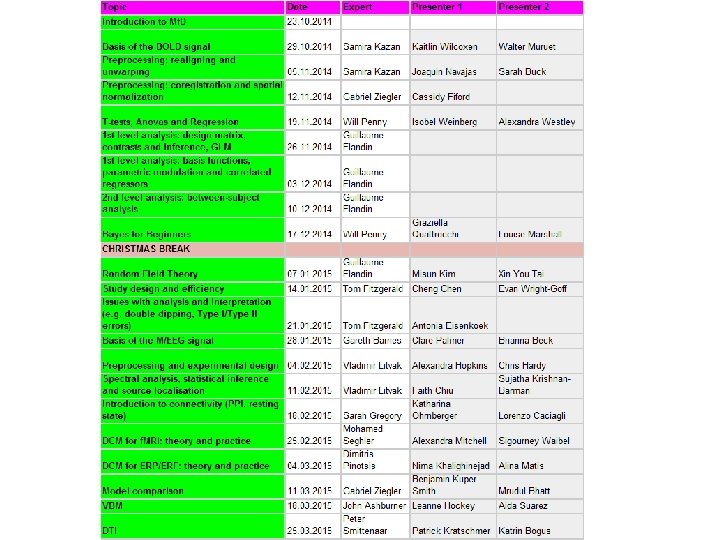
Welcome • Aim of Mf. D: to provide a basic introduction to human brain imaging analysis methods, focusing on f. MRI and M/EEG • Wednesdays 13 -14 in 4 th floor seminar room • Each talk will be given by two presenters and last about 30 min + 15 minutes for questions. Generally it should introduce the relevant theory and be followed by a demo using SPM 12 interface.
How to prepare • Read the Presenter’s Guide http: //www. fil. ion. ucl. ac. uk/mfd/page 1/guide 2014. pdf • Remember your audience are not experts… • Don’t just copy last year’s slides Svenja. espenhahn. 13@ucl. ac. uk Sofie. meyer. 10@ucl. ac. uk
Where to find information Mf. D homepage: http: //www. fil. ion. ucl. ac. uk/mfd/ • Programme • Resources: Presenter’s guide, previous slides, links, SPM manual etc • Name of expert (email in UCL Outlook or from typing name + “FIL” or “UCL” into Google)
Where to find information Go to the Mf. D homepage Resources Online • Key papers • Previous years’ slides • Human Brain Function Textbook (online) • SPM course slides • Cambridge CBU homepage (Rik Henson’s slides) Local • Methods Group Experts • Monday Methods Meetings (4 th floor FIL, 12. 30) • SPM email list
Where to find help: Experts • • • • Samira Kazan Gabriel Ziegler Will Penny John Ashburner Gareth Barnes Mohamed Seghier Tom Fitz. Gerald Guillaume Flandin Sarah Gregory Vladimir Litvak Bernadette van Wijk Dimitris Pinotsis Peter Smittenaar Email the expert: discuss presentation and other issues (1 week before talk) Expert will be present in the session
Overview • What is Mf. D? • Programme • How to prepare your presentation • Where to find information and help • Experts • SPM
Overview • What is Mf. D? • Programme • How to prepare your presentation • Where to find information and help • Experts • SPM
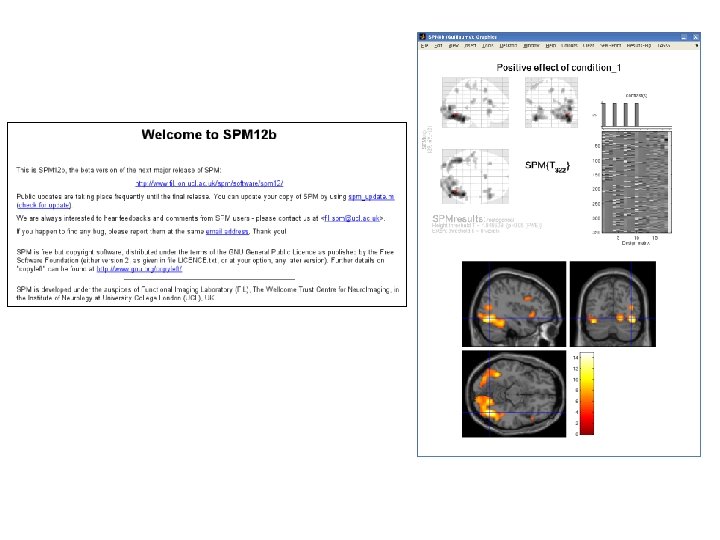
SPM • Statistical Parametric Mapping • Invented at the FIL • A software package designed for the analysis of brain imaging data in f. MRI, PET, SPECT, EEG & MEG
SPM • Statistical Parametric Mapping • Invented at the FIL • A software package designed for the analysis of brain imaging data in f. MRI, PET, SPECT, EEG & MEG • It runs in Matlab… just type SPM at the prompt and all will be revealed
SPM • Statistical Parametric Mapping • Invented at the FIL • A software package designed for the analysis of brain imaging data in f. MRI, PET, SPECT, EEG & MEG • It runs in Matlab: just type SPM at the prompt and all will be revealed • The SPM website has a manual and datasets available for playing around with
What does SPM and Mf. D do? • Using neuroimaging, the idea behind SPM is to identify and make inferences about regionally specific brain activity. This gives way for analysing the integration and interactions among the engaged and identified regions. • Mf. D helps to provide the background to understand the principles of experimental design and data analysis implemented in SPM
What does SPM do? • Allows you to do: – preprocessing – data analysis: – connectivity – general linear model – parameter estimation – dynamic causal modeling
SPM overview
Preprocessing is the preparation of your imaging data to start your analysis Do motion correction (realignment of the data), normalise so that it’s all in the same space, smooth the data so that you can compare between subjects.
Once you have carried out your pre-processing you can specify your design and data The design matrix is simply a mathematical description of your experiment E. g. ‘visual stimulus on = 1’ ‘visual stimulus off = 0’
GLM describes the data at each voxel: mass univariate approach It takes into account experimental and confounding effects and residual variability
Then you estimate how much your parameters of interest explain the BOLD response for each voxel, and threshold the resulting estimates to find out where your parameters explain significant amounts of variance.
Overview • What is Mf. D? • Programme • How to prepare your presentation • Where to find information and help • Experts • SPM
Mass-univariate analysis: voxel-wise GLM y = X + Model is specified by 1. Design matrix X 2. Assumptions about e N: number of scans p: number of regressors The design matrix embodies all available knowledge about experimentally controlled factors and potential confounds.