
Methodology and Data Quality of the ANES 2008

- Slides: 42
Methodology and Data Quality of the ANES 2008 -2009 Panel Study: Lessons for Future Internet Panels Matthew De. Bell Stanford University
Acknowledgments • • National Science Foundation Stanford University & the University of Michigan Knowledge Networks collected data ANES people: – – Jon A. Krosnick & Arthur Lupia, PIs (2005 -2009) Vincent Hutchings, Associate PI (2005 -2009) Matthew De. Bell, Stanford project director lots of others! 2
This talk • Describe an Internet panel study: ANES 2008 -2009 Panel Study • Evaluate data quality and related factors • Methodological lessons
3 problems to frame the talk
3 problems to frame the talk • Coverage error – Inaccurate representation
3 problems to frame the talk • Coverage error – Inaccurate representation • Nonresponse bias – Inaccurate representation
3 problems to frame the talk • Coverage error – Inaccurate representation • Nonresponse bias – Inaccurate representation • Attrition – Loss of representation – Loss of power
Other issues • Conditioning – Loss of representation • Measurement error – Reporting error, satisficing, other mode-related effects
This talk • Describe an Internet panel study: ANES 2008 -2009 Panel Study • Evaluate data quality and related factors • Methodological lessons
American National Election Studies • • Presidential elections in the USA 1948 -present Standard mode is face-to-face Two-wave panel: before and after each presidential election
ANES 2008 -2009 Panel Study
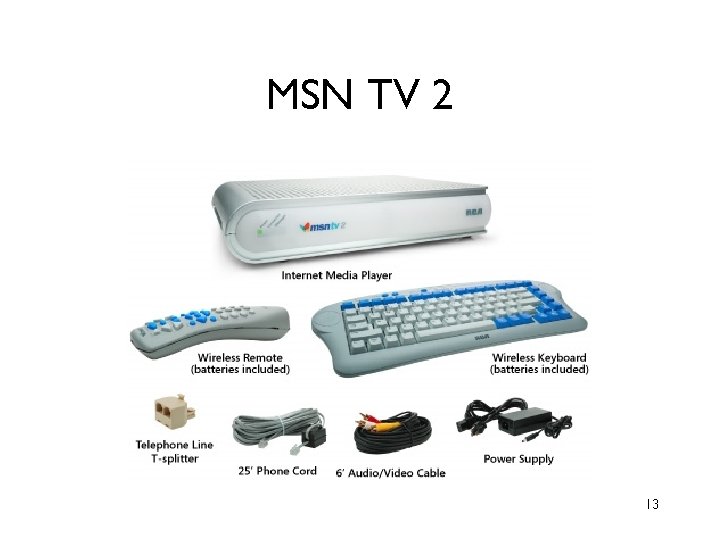
Design • Sequential mixed-mode – Phone recruitment – Internet panel • 21 waves online (25 -30 minutes each) – 7 “ANES waves” – 14 “off-waves” of non-political KN data • Internet provided to Rs without access 12
MSN TV 2 13
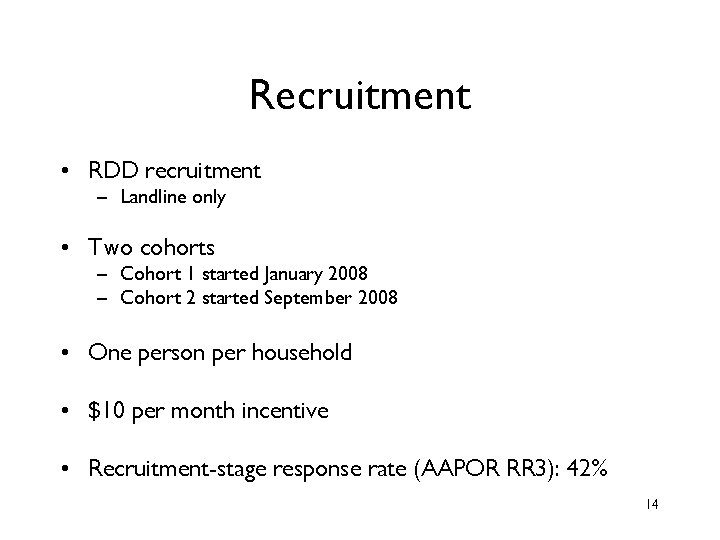
Recruitment • RDD recruitment – Landline only • Two cohorts – Cohort 1 started January 2008 – Cohort 2 started September 2008 • One person per household • $10 per month incentive • Recruitment-stage response rate (AAPOR RR 3): 42% 14
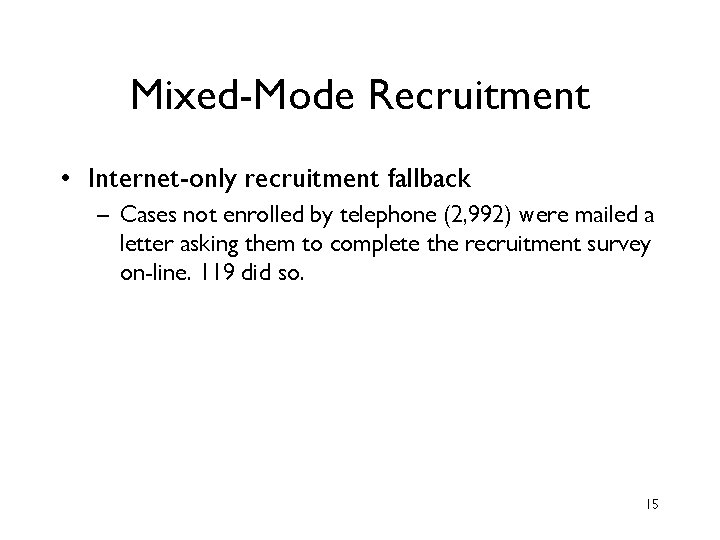
Mixed-Mode Recruitment • Internet-only recruitment fallback – Cases not enrolled by telephone (2, 992) were mailed a letter asking them to complete the recruitment survey on-line. 119 did so. 15
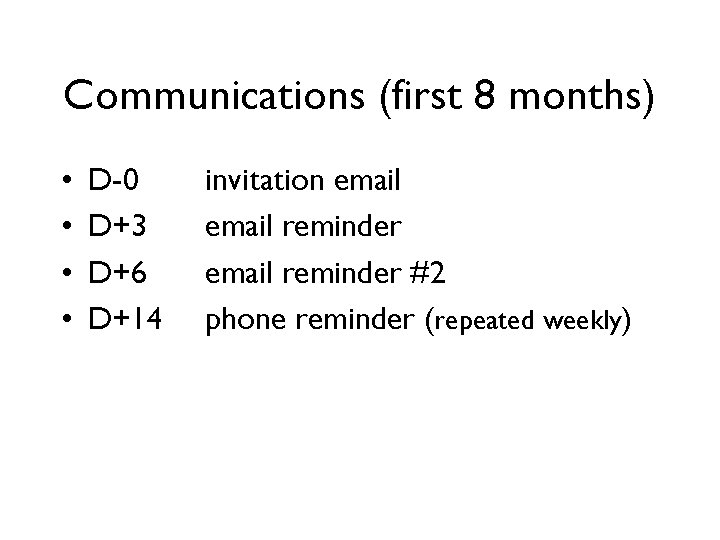
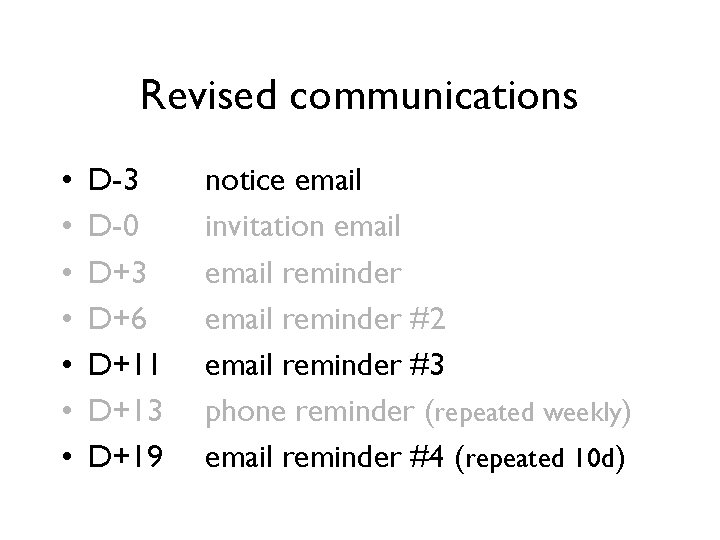
Communications (first 8 months) • • D-0 D+3 D+6 D+14 invitation email reminder #2 phone reminder (repeated weekly)
Revised communications • • D-3 D-0 D+3 D+6 D+11 D+13 D+19 notice email invitation email reminder #2 email reminder #3 phone reminder (repeated weekly) email reminder #4 (repeated 10 d)
This talk • Describe an Internet panel study: ANES 2008 -2009 Panel Study • Evaluate data quality and related factors • Methodological lessons
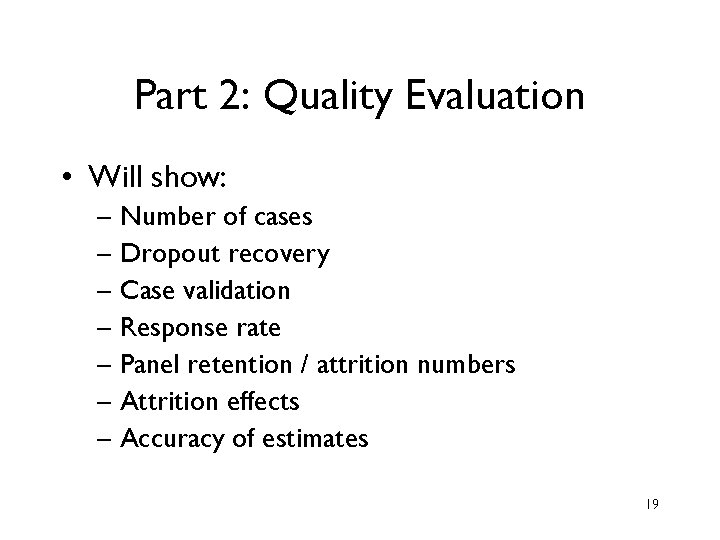
Part 2: Quality Evaluation • Will show: – Number of cases – Dropout recovery – Case validation – Response rate – Panel retention / attrition numbers – Attrition effects – Accuracy of estimates 19
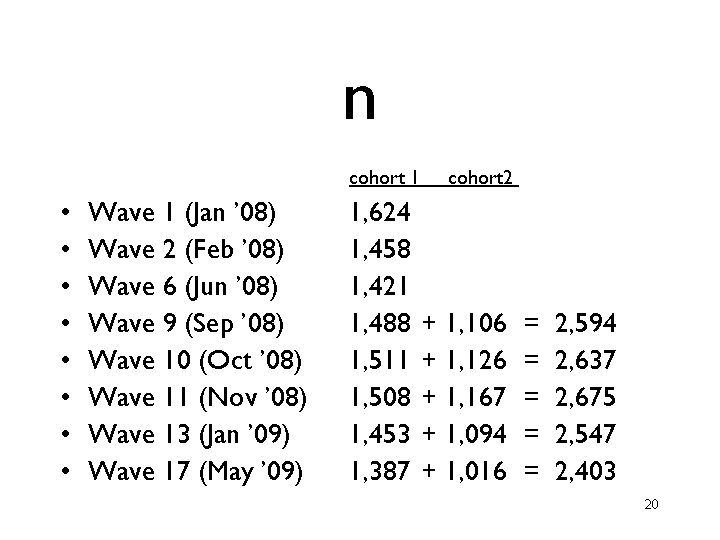
n cohort 1 • • Wave 1 (Jan ’ 08) Wave 2 (Feb ’ 08) Wave 6 (Jun ’ 08) Wave 9 (Sep ’ 08) Wave 10 (Oct ’ 08) Wave 11 (Nov ’ 08) Wave 13 (Jan ’ 09) Wave 17 (May ’ 09) 1, 624 1, 458 1, 421 1, 488 1, 511 1, 508 1, 453 1, 387 cohort 2 + 1, 106 + 1, 126 + 1, 167 + 1, 094 + 1, 016 = = = 2, 594 2, 637 2, 675 2, 547 2, 403 20
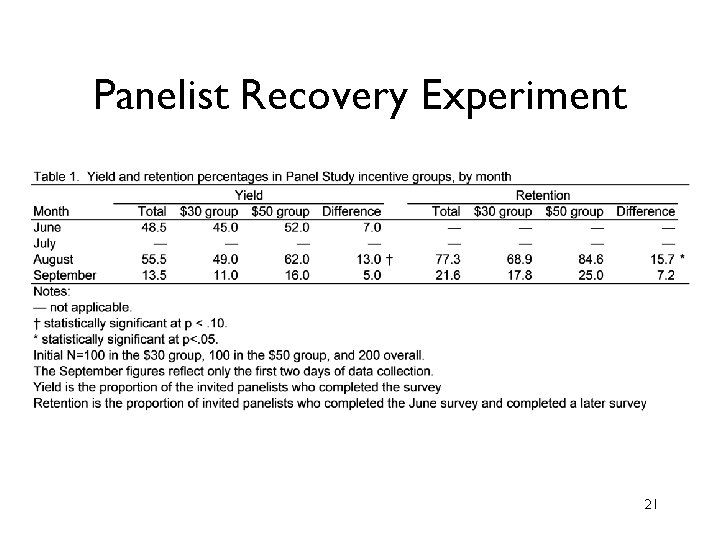
Panelist Recovery Experiment 21
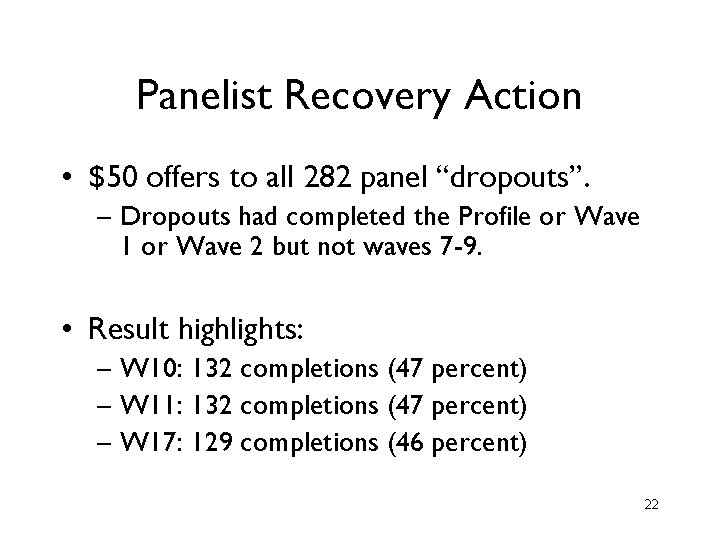
Panelist Recovery Action • $50 offers to all 282 panel “dropouts”. – Dropouts had completed the Profile or Wave 1 or Wave 2 but not waves 7 -9. • Result highlights: – W 10: 132 completions (47 percent) – W 11: 132 completions (47 percent) – W 17: 129 completions (46 percent) 22
Case Validation • Telephone surveys with 10% subsample of Rs to each of the 7 planned ANES waves • 1, 482 interviews • We found… 23
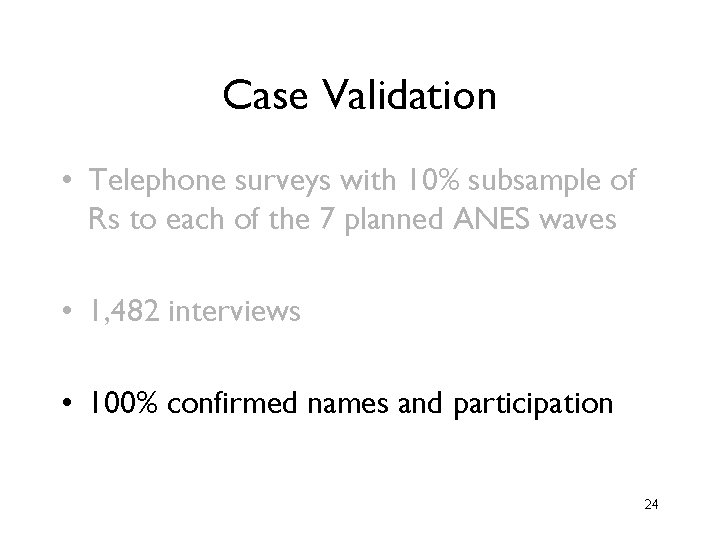
Case Validation • Telephone surveys with 10% subsample of Rs to each of the 7 planned ANES waves • 1, 482 interviews • 100% confirmed names and participation 24
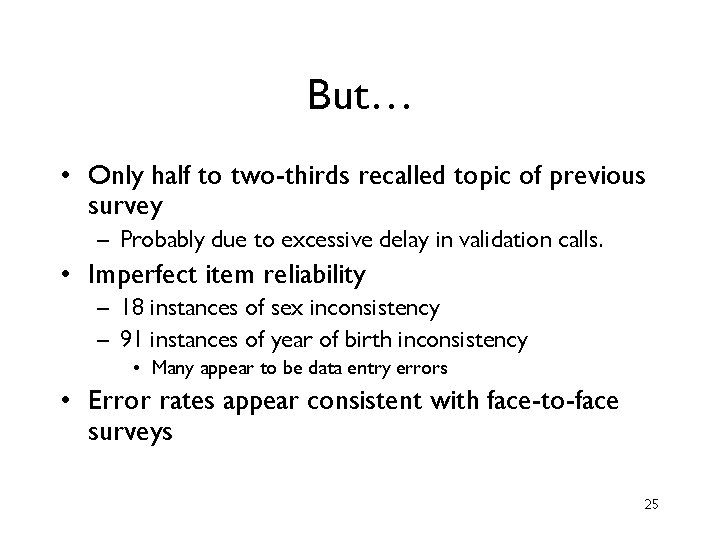
But… • Only half to two-thirds recalled topic of previous survey – Probably due to excessive delay in validation calls. • Imperfect item reliability – 18 instances of sex inconsistency – 91 instances of year of birth inconsistency • Many appear to be data entry errors • Error rates appear consistent with face-to-face surveys 25
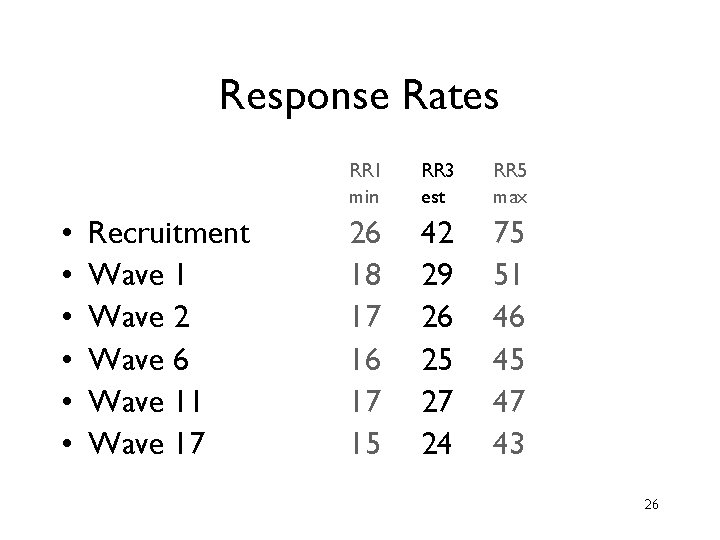
Response Rates • • • Recruitment Wave 1 Wave 2 Wave 6 Wave 11 Wave 17 RR 1 min RR 3 est RR 5 max 26 18 17 16 17 15 42 29 26 25 27 24 75 51 46 45 47 43 26
Retention: ANES vs. Knowledge. Panel • ANES panel retention was better than KP – [graphic & numbers not for public distribution] 27
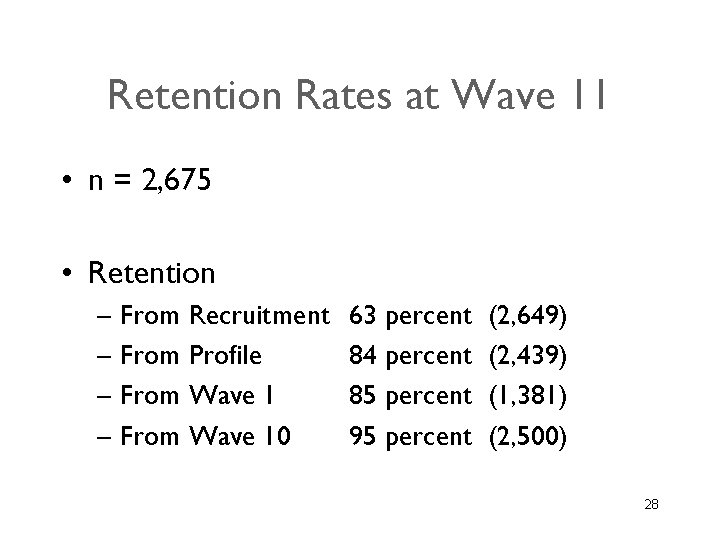
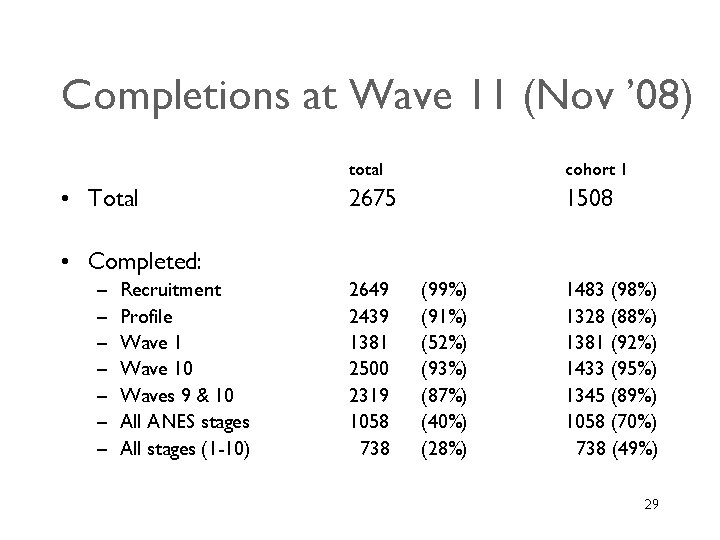
Retention Rates at Wave 11 • n = 2, 675 • Retention – From Recruitment – From Profile – From Wave 10 63 percent 84 percent 85 percent 95 percent (2, 649) (2, 439) (1, 381) (2, 500) 28
Completions at Wave 11 (Nov ’ 08) • Total total cohort 1 2675 1508 • Completed: – – – – Recruitment Profile Wave 10 Waves 9 & 10 All ANES stages All stages (1 -10) 2649 2439 1381 2500 2319 1058 738 (99%) (91%) (52%) (93%) (87%) (40%) (28%) 1483 (98%) 1328 (88%) 1381 (92%) 1433 (95%) 1345 (89%) 1058 (70%) 738 (49%) 29
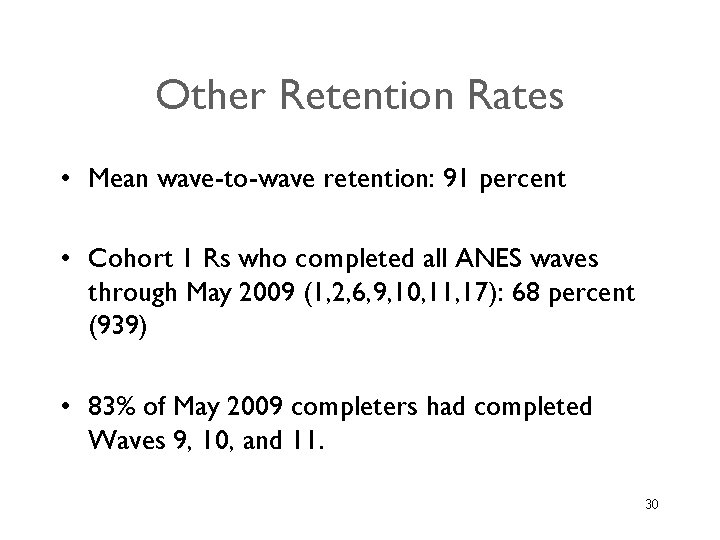
Other Retention Rates • Mean wave-to-wave retention: 91 percent • Cohort 1 Rs who completed all ANES waves through May 2009 (1, 2, 6, 9, 10, 11, 17): 68 percent (939) • 83% of May 2009 completers had completed Waves 9, 10, and 11. 30
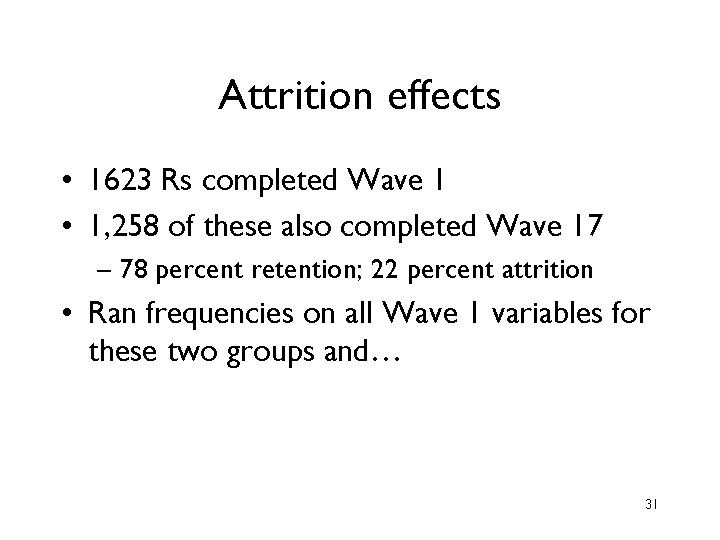
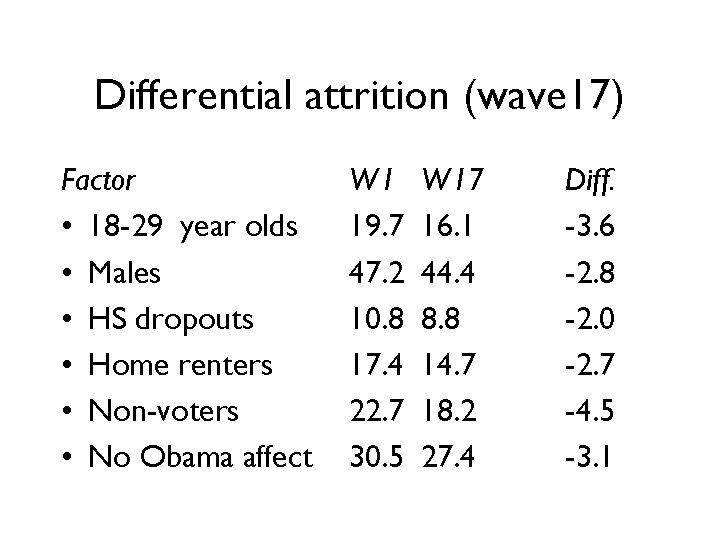
Attrition effects • 1623 Rs completed Wave 1 • 1, 258 of these also completed Wave 17 – 78 percent retention; 22 percent attrition • Ran frequencies on all Wave 1 variables for these two groups and… 31
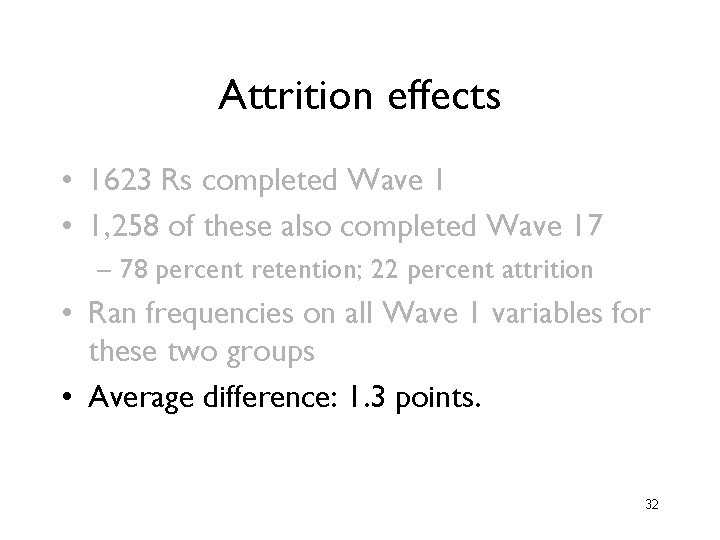
Attrition effects • 1623 Rs completed Wave 1 • 1, 258 of these also completed Wave 17 – 78 percent retention; 22 percent attrition • Ran frequencies on all Wave 1 variables for these two groups • Average difference: 1. 3 points. 32
Differential attrition (wave 17) Factor • 18 -29 year olds • Males • HS dropouts • Home renters • Non-voters • No Obama affect W 1 19. 7 47. 2 10. 8 17. 4 22. 7 30. 5 W 17 16. 1 44. 4 8. 8 14. 7 18. 2 27. 4 Diff. -3. 6 -2. 8 -2. 0 -2. 7 -4. 5 -3. 1
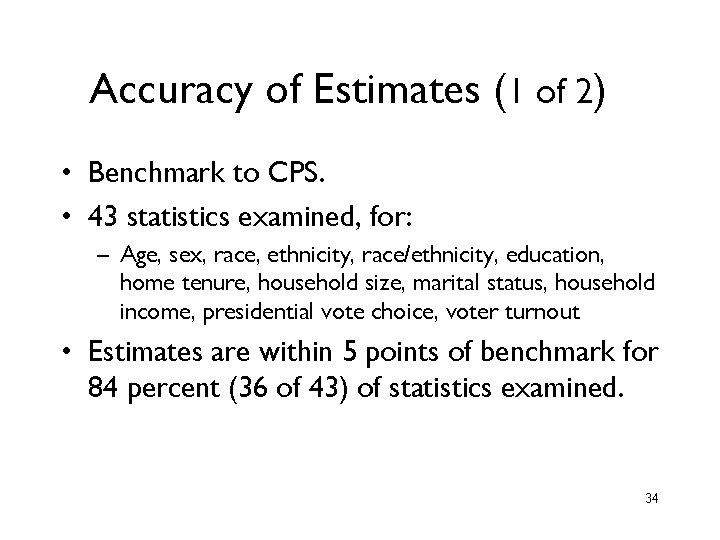
Accuracy of Estimates (1 of 2) • Benchmark to CPS. • 43 statistics examined, for: – Age, sex, race, ethnicity, race/ethnicity, education, home tenure, household size, marital status, household income, presidential vote choice, voter turnout • Estimates are within 5 points of benchmark for 84 percent (36 of 43) of statistics examined. 34
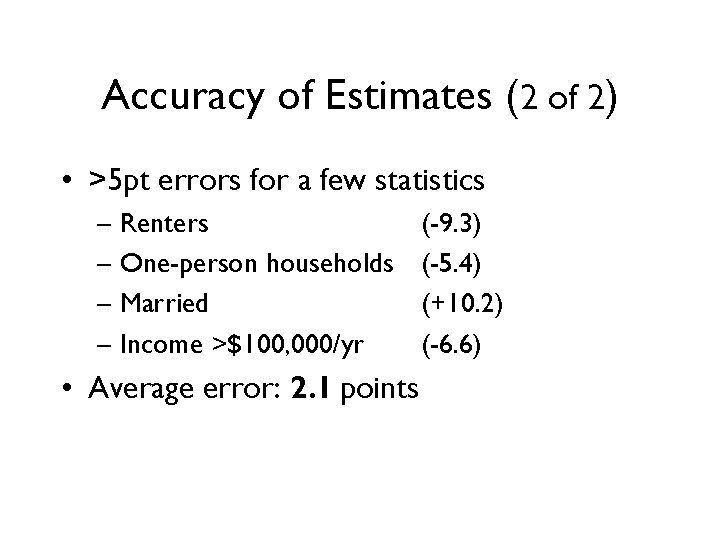
Accuracy of Estimates (2 of 2) • >5 pt errors for a few statistics – Renters – One-person households – Married – Income >$100, 000/yr • Average error: 2. 1 points (-9. 3) (-5. 4) (+10. 2) (-6. 6)
This talk • Describe an Internet panel study: ANES 2008 -2009 Panel Study • Evaluate data quality and related factors • Methodological lessons
Part 3: Lessons Concerning: • Data quality • Measuring quality immediately • Promoting quality
Data Quality • Data quality from the telephone-recruited panel is consistent with expectations for a high-quality telephone survey – Good accuracy – Only moderate attrition
Measuring Quality Immediately • Monitor attrition during panel • Validation interviews – Should happen immediately after web completion • Concern: respondent identity
Promoting Quality • Fight non-response bias – high-quality recruitment – multiple contacts over a long period of time – incentives • Fight attrition – pleasant content – incentives – dropout recovery with added incentives • Fight conditioning with variety
Final Thoughts • Other possibilities – Targeted incentives to combat NR bias – Oversamples at recruitment to combat NR • Landline RDD is obsolete! • Literacy
Thank you www. electionstudies. org Matthew De. Bell debell@stanford. edu 42