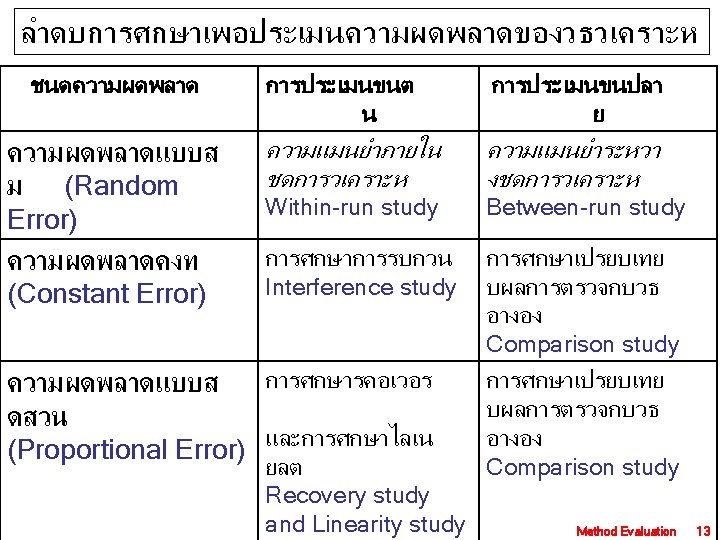
Method Evaluation and Method Validation 1 2 Type


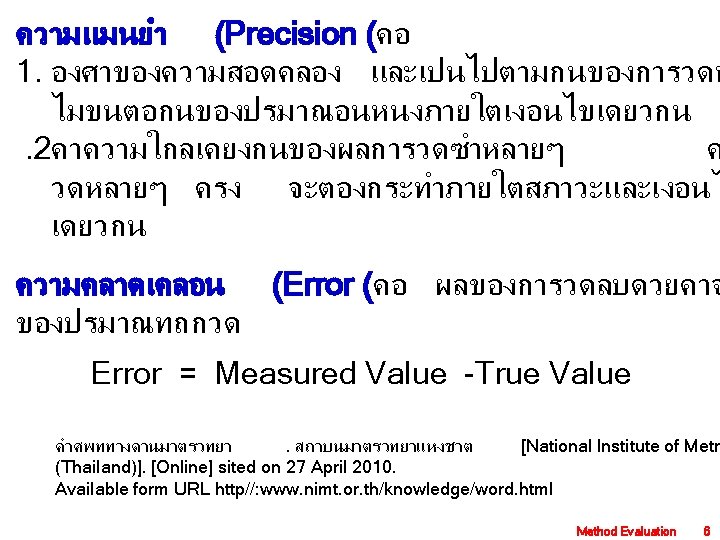
ความถกตอง ( Precision )ความแมนยำ")

 Constant error b x b + =")

Between Run Precision( %CV ไมควรเกนคา ความผดพลาดทยอมรบได (allow ของการตรวจวดสารนน ? Total")
")
 จาก %CV โดยใชโอกาสทางสถต (ประมาณ 1. 96 SD) Random error ทคา")

 1. 0")
 เฉลย วดกลโคสท เตมได (mg/dl) %Recovery - 1 2 3")
2 1 5. 1 8.")


, TEa True Measured value Systemic error Bias Imprecision Random error")
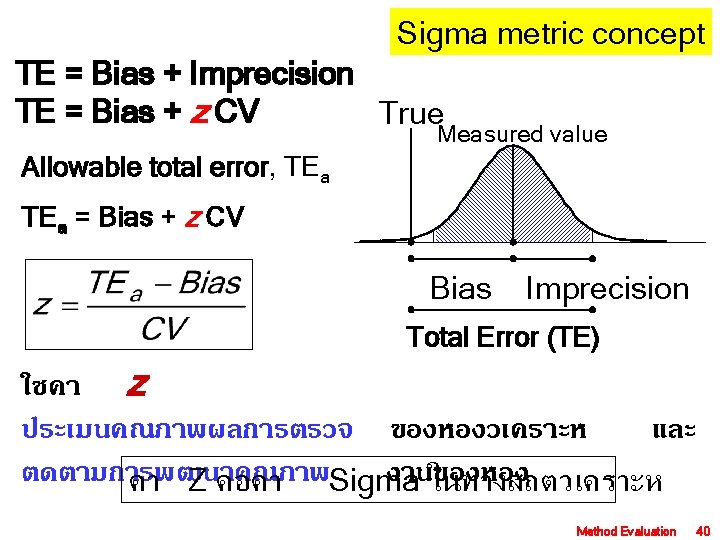
 Chart From… James O. Westgard for Judging Method Performance CLIN")

 :")


 Sensitivity(%) Specificity(%) PPV(%)")


- Slides: 54
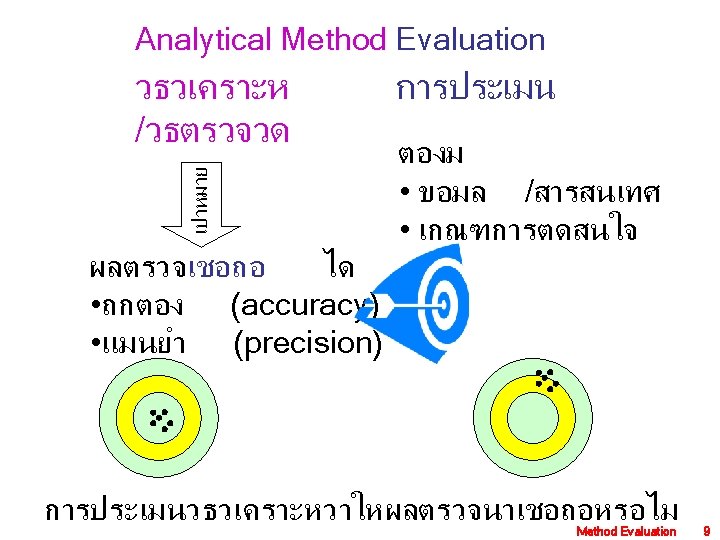
Method Evaluation and Method Validation วตถประสงค น. ศ. สามารถ 1. อธบายวธการศกษาเพอประเมนวธวเคราะหได 2. วเคราะหและแปลความหมายผลการศกษา เพอประเมนวธวเคราะหได Type of Analytical Method Reference Method Standard Method Routine Method http: //home. kku. ac. th/wiskun/465211/Method. Evaluation. ppt http: //home. kku. ac. th/wiskun/book/index. html Method Evaluation 1
Select, Evaluate Diagnostic Test Process for Establishing a Routine Test Select Method of Analysis Acquire Specimens Validate Method Performance Develop Method Improvements Implement Method Maintain Method Prevent Problems Perform Tests Check with Statistical QC Report Results A Routine Laboratory Testing Process From. . . http: //www. westgard. com/lesson 20. htm 2
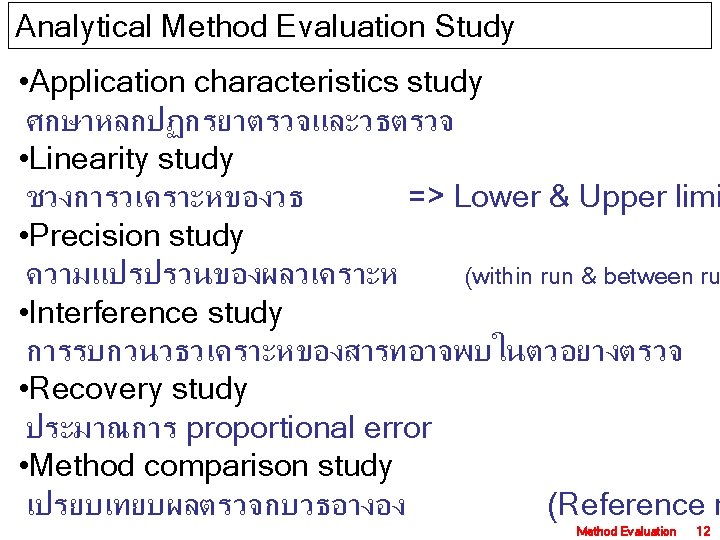
Method characteristics Application characteristics are factors that determine whether a method can be implemented in a particular laboratory situation. cost-per-test, types of specimens sample volume, turnaround time, workload, equipment and personnel requirements, space, portability, and safety considerations Methodology characteristics are factors which, in principle, should contribute to best performance analytical sensitivity and analytical specificity of the method of analysis choice of chemical reaction, optimization of reaction conditions, principles of standardization and calibration, and the rigor of the analytical procedure Performance characteristics are factors which, in practice, demonstrate how well a method performs. working range, precision, recovery, interference, accuracy, and sometimes detection limit 3
Ideal Clinical Laboratory Test • Perfect accuracy and precision • High analytical sensitivity (a limit of detection of zero) • Absolute analytical specificity (No interferences) • Diagnostic sensitivity and specificity of 100% Area under ROC Curve closest to 1. 0 (Receiver Operating Characteristic) Likelihood ratios, LR >10 or LR <0. 1 Analytical Performance Diagnostic Performance Method Evaluation 4
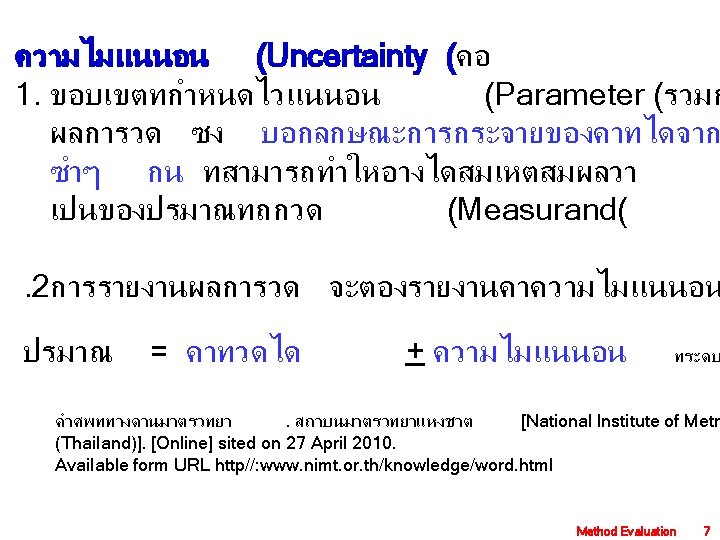
Performance specifications of a new method are • • Accuracy )ความถกตอง ( Precision )ความแมนยำ ( Analytical sensitivity )ความไวตอการวเคราะหปรมาณ ( Analytical specificity to include interfering substances )ความจำเพาะตอสารทวเคราะห ( • Reportable range of patient test results )ชวงทวเคราะหไดในตวอยางของวธตรวจ ( • Reference range )ชวงคาอางอง /ปกต ทพบในคนปกต ( • Any other performance characteristic required for test performance Method Evaluation 8
Observed Distribution And Error concept of Accuracy True Value Observed Mean X X X X X X Westgard JO. The Meaning and Application of Total Error Site on 5 Jun 09 From. . http: //www. westgard. com/essay 111. htm X Systemic error, SE Random error, RE Total error, TE Method Evaluation 10
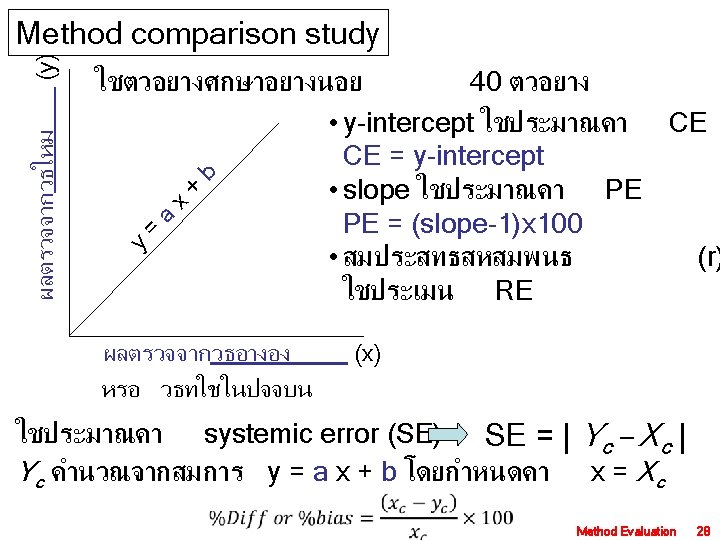
Systemic error & Random error ผลตรวจ (y) Constant error b x b + = y = y x a 0 + y = x + 0 ผลตรวจ = คาจรง No error ? Proportional error คาจรง (x) 0 Systemic error (SE) มรปแบบ error ทคาดการณได Constant error (CE) Proportional error (PE) Random error (RE) มรปแบบ error ทคาดการณไมไ Method Evaluation 11
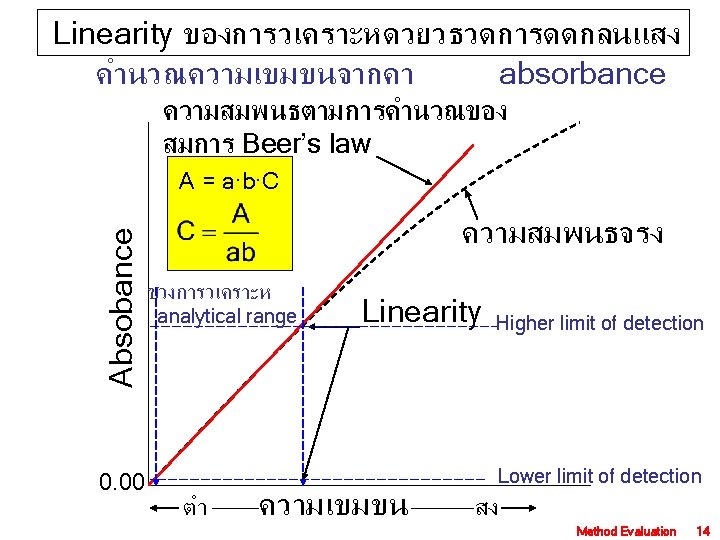
Linearity ของการวเคราะหดวยวธวดศกยไฟฟา ชวงการวเคราะห analytical range ศกยไฟฟา Higher limit of detection High Cal Lower limit of detection Low Cal Lower limit ความเขมขน Higher limit Method Evaluation 15
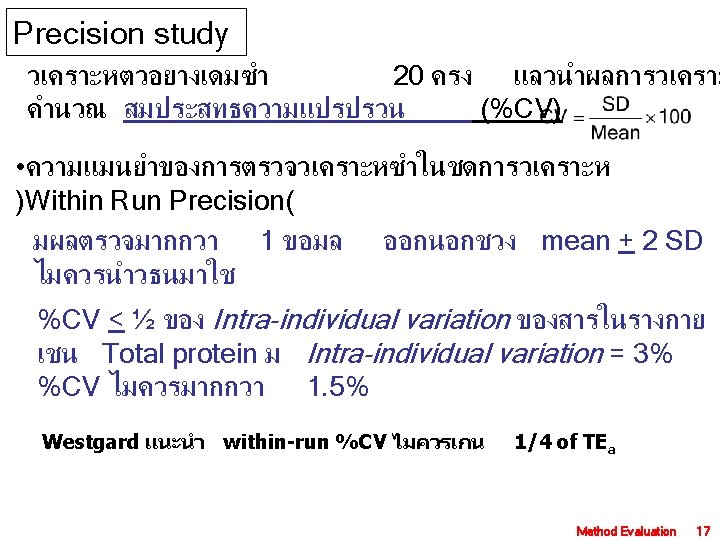
Precision study • ความแมนยำของการตรวจวเคราะหซำระหวางชดการวเคราะห )Between Run Precision( %CV ไมควรเกนคา ความผดพลาดทยอมรบได (allow ของการตรวจวดสารนน ? Total protein CLIA Acceptable Performance 10% Medical Decision Level 7. 0 g/dl CLIA Allowable Error 0. 70 g/dl Medically Allowable Error 0. 51 g/dl ทระดบ 7. 0 g% %CV ไมควรเกน Westgard แนะนำ beteween-run %CV ไมควรเกน = 7. 28% 1/3 of TEa CLIA = Clinical Laboratory Improvement Amendments Method Evaluation 18
http: //www. westgard. com/lesson 22. htm For short-term imprecision, the within-run standard deviation (sw-run) or the within-day standard deviation (sw-day) should be ¼ or less of the defined allowable total error to be acceptable, i. e. , sw-run or sw-day < 0. 25 TEa Select at least 2 different control materials that represent low and high medical decision concentrations for the test of interest For long-term imprecision, the total standard deviation (stot) should be 1/3 or less of the defined TE, i. e. , stot < 0. 33 TEa. Analyze 1 sample of each of the 2 materials on 20 different days to estimate long-term imprecision TE = %Bias + Imprecision (z %CV) Method Evaluation 19
การประมาณคา Random error (RE) จาก %CV โดยใชโอกาสทางสถต (ประมาณ 1. 96 SD) Random error ทคา mean คำนวณจากสตร RE = 1. 96 x imprecision %CV = 5. 0% RE = 1. 96 x 5 = 9. 8% Medical Decision level = 7. 0 RE = 1. 96 x 0. 35 = 0. 69 CLIA Acceptable Performance Medical Decision Level CLIA Allowable Error Medically Allowable Error Total protein 10% 7. 0 g/dl 0. 70 g/dl 0. 51 g/dl Method Evaluation 20
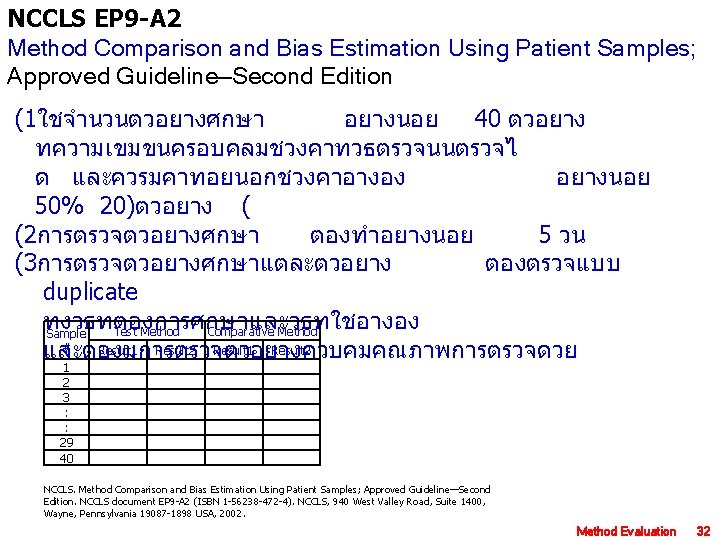
NCCLS EP 5 -A 2 Evaluation of Precision Performance of Quantitative Measurement Methods; Approved Guideline—Second Edition (1ตรวจวดตวอยางศกษา อยางนอย 20 วน (2ใน 1 วน ตรวจตวอยางศกษา 2 ครง และครงละ ตวอยาง (3ในการตรวจตวอยางศกษาทกครง ตองมการตรวจตวอยางควบคมคณภาพการตรวจดวย อยางนอย 1 ระดบความเขมขน (4การศกษา precision performance ตวอยางศกษา Level 1 ตองทำกบตวอยางศกษา 2 ระดบความเขมขน การตรวจครงท 1 การตรวจครงท 2 Day# Rp R 1 p 2 Rp Rp เปนอยางนอย 1 242 246 245 246 1 1 2 3 : : 19 20 243 247 : : 241 247 242 239 : : 239 240 2 1 2 2 238 241 : : 247 245 238 240 : : 245 242 2 Repeatability, Method precision NCCLS. Evaluation of Precision Performance of Quantitative Measurement Methods; Approved Guideline—Second Edition. NCCLS document EP 5 -A 2 (ISBN 1 -56238 -542 -9). NCCLS, 940 West Valley Road, Suite 1400, Wayne, Pennsylvania 190871898 USA, 2004. Method Evaluation 21
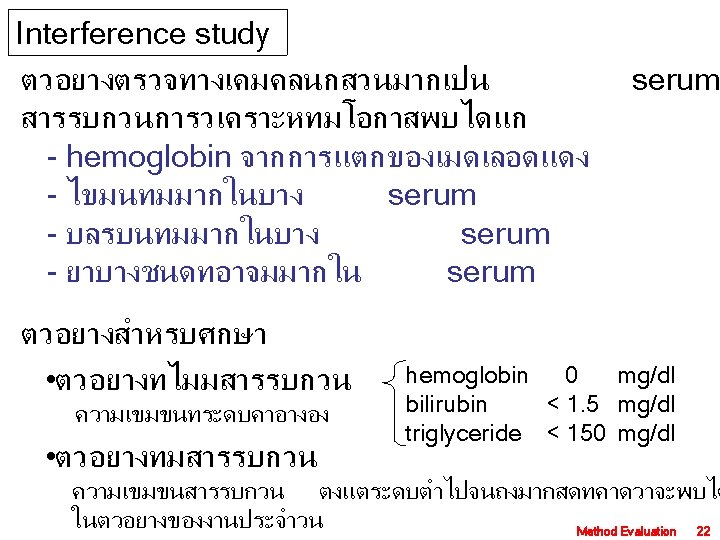
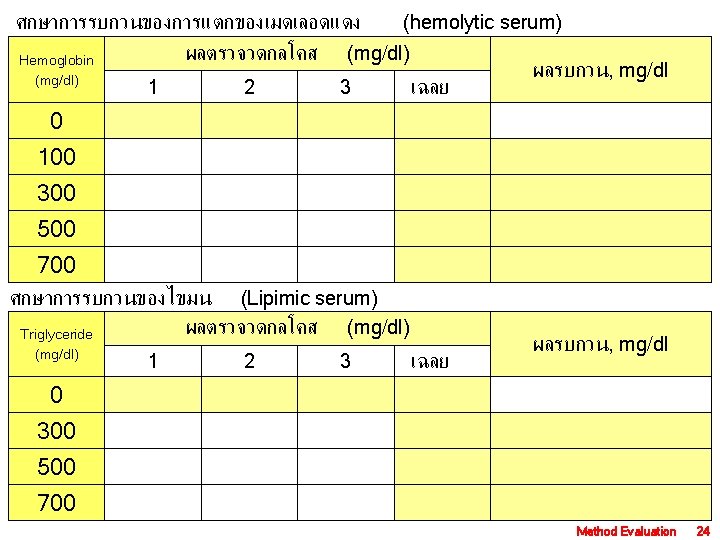
ตวอยางศกษาผลการรบกวนของ Bilirubin, 200 mg/dl Diluents bilirubin ตอการตรวจวดกลโค ตวอยางท ไมมส ารรบกวน Bilirubin (mg/dl) 1. 0 ml 9. 0 ml 0 1. 0 ml 9. 0 ml 5 10 15 Bilirubin (mg/dl) Diluents 1. 0 ml 3. 0 ml 50 2. 0 ml 3. 0 ml 2. 0 ml 100 150 Bilirubin (mg/dl) ผลตรวจวดกลโคส (mg/dl) 1 2 3 0 5 10 15 99 103 104 112 100 101 105 111 102 103 110 เฉลย 100 102 104 111 ผลรบกวน, mg/dl 102 -100 = 2 104 -100 = 4 111 -100 = 11 Method Evaluation 23
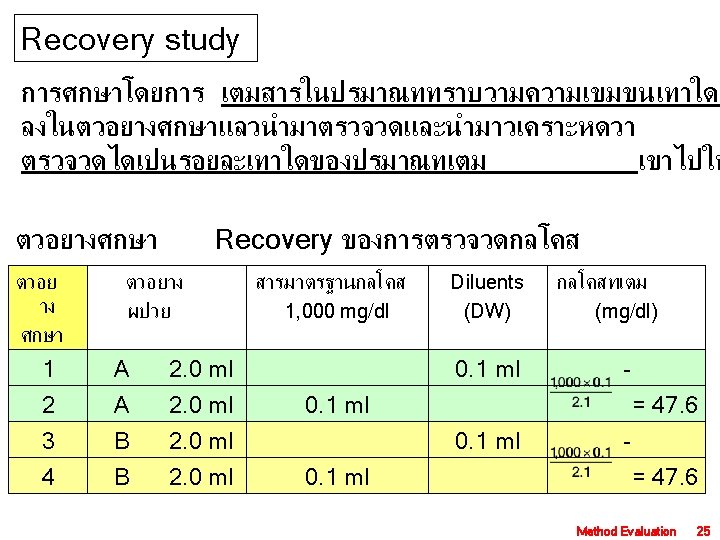
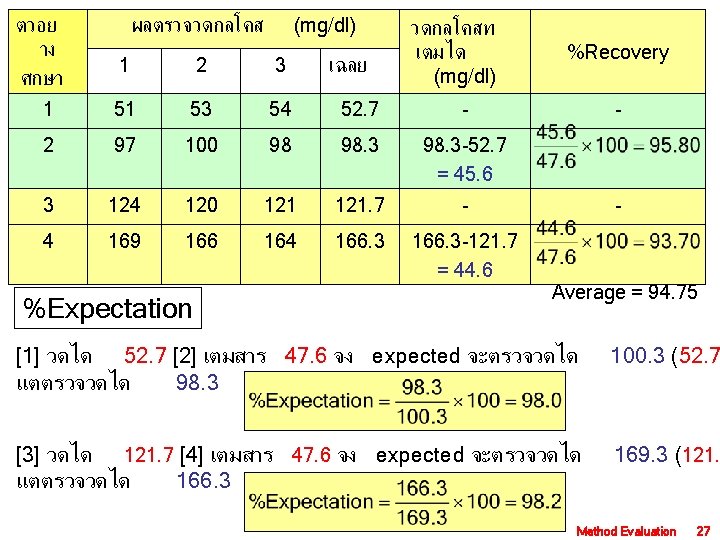
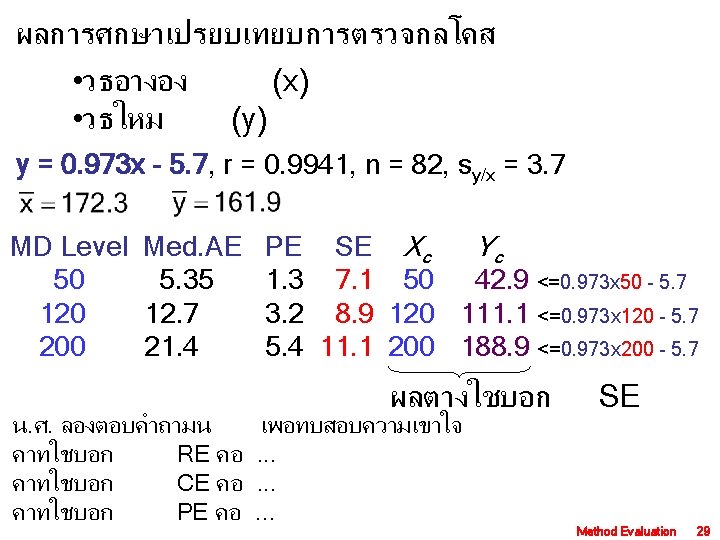
ตวอย าง ศกษา ผลตรวจวดกลโคส (mg/dl) เฉลย วดกลโคสท เตมได (mg/dl) %Recovery - 1 2 3 1 51 53 54 52. 7 - 2 97 100 98 98. 3 -52. 7 = 45. 6 3 124 120 121. 7 - 4 169 166 164 166. 3 -121. 7 = 44. 6 Proportional error (PE) = | 100 - %Recovery | PE = | 100 – 94. 75 | = 5. 25% MD Level Med. AE 50 5. 35 120 12. 7 200 21. 4 - Average = 94. 75 PE 2. 6 6. 3 10. 5 Method Evaluation 26
X Y X 2 Y 2 XY Yc Y-Yc (Y-Yc)2 1 5. 1 8. 5 26. 01 72. 25 43. 35 6. 53 1. 97 3. 88 2 5. 4 2. 8 29. 16 7. 84 15. 12 6. 85 -4. 05 16. 40 3 3. 6 3. 2 12. 96 10. 24 11. 52 4. 94 -1. 74 3. 03 4 6. 8 3. 6 46. 24 12. 96 24. 48 8. 34 -4. 74 22. 43 5 6. 6 7. 4 43. 56 54. 76 48. 84 8. 12 -0. 72 0. 52 6 6. 5 7. 1 42. 25 50. 41 46. 15 8. 02 -0. 92 0. 84 7 11. 4 10. 0 129. 96 100. 00 114. 00 13. 22 -3. 22 10. 35 8 5. 3 6. 2 28. 09 38. 44 32. 86 6. 74 -0. 54 0. 30 9 4. 9 3. 3 24. 01 10. 89 16. 17 6. 32 -3. 02 9. 12 10 9. 8 8. 4 96. 04 70. 56 82. 32 11. 52 -3. 12 9. 73 11 5. 5 4. 1 30. 25 16. 81 22. 55 6. 96 -2. 86 8. 16 12 6. 3 4. 6 39. 69 21. 16 28. 98 7. 80 -3. 20 10. 27 13 4. 9 24. 01 8. 41 14. 21 6. 32 -3. 42 11. 69 14 3. 5 2. 5 12. 25 6. 25 8. 75 4. 83 -2. 33 5. 44 15 6. 5 4. 4 42. 25 19. 36 28. 60 8. 02 -3. 62 13. 08 16 11. 1 7. 1 123. 21 50. 41 78. 81 12. 90 -5. 80 33. 63 17 7. 3 5. 2 53. 29 27. 04 37. 96 8. 87 -3. 67 13. 44 18 6. 2 6. 9 38. 44 47. 61 42. 78 7. 70 -0. 80 0. 64 19 14. 6 17. 8 213. 16 316. 84 259. 88 16. 61 1. 19 1. 41 20 11. 9 15. 2 141. 61 231. 04 180. 88 13. 75 1. 45 2. 11 21 8. 8 11. 2 77. 44 125. 44 98. 56 10. 46 0. 74 0. 55 22 16. 0 19. 9 256. 00 396. 01 318. 40 18. 10 1. 80 3. 24 23 21. 0 20. 7 441. 00 428. 49 434. 70 23. 41 -2. 71 7. 32 24 3. 4 2. 4 11. 56 5. 76 8. 16 4. 73 -2. 33 5. 42 25 8. 0 6. 2 64. 00 38. 44 49. 60 9. 61 -3. 41 11. 62 26 8. 2 6. 5 67. 24 42. 25 53. 30 9. 82 -3. 32 11. 03 27 17. 1 12. 4 292. 41 153. 76 212. 04 19. 27 -6. 87 47. 15 28 11. 4 7. 4 129. 96 54. 76 84. 36 13. 22 -5. 82 33. 84 29 11. 0 11. 5 121. 00 132. 25 126. 50 12. 79 -1. 29 1. 67 30 12. 7 13. 8 161. 29 190. 44 175. 26 14. 60 -0. 80 0. 64 S 260. 8 243. 2 2818. 3 2740. 9 2699. 1 310. 3 -67. 1 298. 9 Method Evaluation 30
Evaluated method Reference method MD level SE Yc 10 0. 5 9. 5 =1. 0612 x 10 -1. 1191 15 0. 2 14. 8 =1. 0612 x 15 -1. 1191 SE Yc 0. 1 9. 9 =1. 005 x 10 -0. 1175 0. 0 15. 0 =1. 005 x 15 -0. 1175 5 0. 1 4. 9 =1. 005 x 5 -0. 1175 0. 8 4. 2 =1. 0612 x 5 -1. 1191 Acceptable Performance 5% Allowable error Method Evaluation 31
Sigma, คอ คาเบยงเบนมาตรฐาน ของขอมล กรณขอมลมการกระจายแบบรประฆงคลำ (ปกต ชวง Mean +SD ใชประมาณสดสวนจำนวนขอมลทอยใน ขอบเขตนน ดงตาราง -6 s -5 s -4 s -3 s -2 s -1 s 1 s 2 s 3 s 4 s 5 s 6 s Within + SD Out of range + SD (%) (Per million) 1 68. 26894921% 317, 310. 51 2 95. 44997361% 45, 500. 26 3 99. 73002039% 2, 699. 80 4 99. 99366575% 63. 342 5 99. 99994267% 0. 5733 6 99. 99999980% 0. 0020 SD + 1 SD + 2 SD + 3 SD + 4 SD + 5 SD + 6 SD Six Sigma; 6 Method Evaluation 33
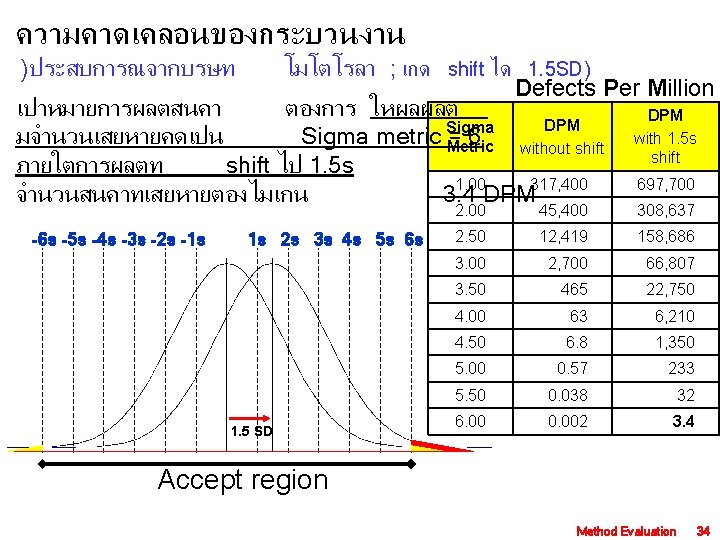
ยางรถยนตจำนวน 6, 000 เสนทผลตและนำไปใช พบวา เปนสาเหตทำใหเกดอบตเหตจำนวน และมคนเสยชวตจำนวน 100 ครง 2, 000 333 Defect of production is 6, 000 = 1, 000 Sigma Metric DPM without shift DPM with 1. 5 s shift 1. 00 317, 400 697, 700 2. 00 45, 400 308, 637 2. 50 12, 419 158, 686 3. 00 2, 700 66, 807 3. 50 465 22, 750 4. 00 63 6, 210 4. 50 6. 8 1, 350 5. 00 0. 57 233 5. 50 0. 038 32 6. 00 0. 002 3. 4 = 333 DPM Process performance is 3. 5 sigma metric using the DPM without shift column. 5. 0 sigma metric using the DPM with 1. 5 s shift column. Method Evaluation 35
Six Sigma provides a new methodology for measuring process performance and refines earlier methodologies for making process improvements. ปจจบน องคการธรกจชนนำ ใช Sigma me วดความสำเรจ และมเปาหมายใหได ระดบ 6 Airline baggage handling shows 4. 15 Sigma Airline safty shows more than 6 Sigma Method Evaluation 36
Nevalainen D, Berte L, Kraft C, Leigh E, Morgan T. Evaluating laboratory performance on quality indicators with the six sigma scale. Arch Pathol Lab Med 2000; 124: 516 -519 Q-Probe QUALITY INDICATOR % ERROR DPM SIGMA* Order accuracy 1. 8 % 18, 000 3. 60 Duplicate test orders 1. 52 15, 200 3. 65 Wristband errors (not banded) 0. 65 6, 500 4. 00 TDM timing errors 24. 4 244, 000 2. 20 Hematology specimen acceptability 0. 38 3, 800 4. 15 Chemistry specimen acceptability 0. 30 3, 000 4. 25 Surgical pathology specimen accessioning 3. 4 34, 000 3. 30 Cytology specimen adequacy 7. 32 73, 700 2. 95 Laboratory proficiency testing 0. 9 9, 000 3. 85 Surg path froz sect diagnostic discordance 1. 7 17, 000 3. 60 PAP smear rescreening false negatives 2. 4 24, 000 3. 45 Reporting errors 0. 0477 *Conversion using table with allowance for 1. 5 s shift 4. 80 From. . http: //www. westgard. com/lesson 66. htm Method Evaluation 37
Two Approaches for Measuring Process Performance Measure Outcome Measure Variation Inspect Outcomes and Count Defects Measure Variation of Process Calculate Defect Per Million (DPM) Calculate SD and Process Capability Convert DPM to Sigma Metric Convert Capability to Sigma Metric Method Evaluation 38
ความผดพลาดทยอมรบได (total allowable error), TEa True Measured value Systemic error Bias Imprecision Random error Total Error (TE) Method Evaluation 39
Method Evaluation Decision (MEDx) Chart From… James O. Westgard for Judging Method Performance CLIN LAB SCI vol. 8, no. 5, Sept/Oct 1995, 277 -283 Allowable Total Error (%): 10. 00 % (at decision level) Inaccuracy (%bias): 3. 00 % (Observed at decision level) Imprecision (%CV): 2. 50 % (Observed at decision level) Region of Unacceptable TE =Bias +z Imprecision Performance ) TE -Bias( Poo r per Ex Imprecision ------- = M arg forman ce ina ce lle z l pe nt rfo p Observed (2. 5, 3. 0) rm G er a o nce fo o inaccuracy and imprecision rm d p an erf ce orm z = 4 an ce z = 3 z = 2 Method Evaluation 41
Different Concepts of detection limit Lower Limit of Detection Biologic Limit of Detection LLD BLD Z is 2 or 3. Functional Sensitivity FS Z sblk Z sspk Measurement response Zero or “Blank” “Spiked” sample LLD = meanblk + Z sblk BLD = LLD + Z sspk FS is estimated as the mean concentration for a spiked sample whose CV is 20%. Westgard, JO. The detection limit experiment. from. . http: //www. westgard. com/lesson 29. htm Method Evaluation 42
ตวอยาง การศกษา LLD และ BDL ของ PSA measurement Blank sample ( 0 ug/L) : mean = 1000 unit SD = 100 unit Spike sample (10 ug/L) : mean = 2000 unit SD = 200 unit LLD (ug/L) = BDL (ug/L) = + 02 ( 100 (2000 -1000) 2 ug/L + 2 ( X 10 ) = 2 ug/L 200 (2000 -1000) X 10 ) = 6 ug/L SD of Spike sample (10 ug/L) = 200 unit equal to 2 ug/L CV = 2 ug/L 10 ug/L X 100 = 20% FS = 10 ug/L Method Evaluation 43
Diagnostic Performance Diagnostic sensitivity and specificity Evaluated Method ผลตรวจบ งช Positive Negative รวม Gold or Standard Method พยาธสภาพ Disease Non-disease True Positive a False Negative c False Positive b True Negative d a + c b + d รวม a + b c + d a+b+c+d Method Evaluation 47
Diagnostic sensitivity and specificity พยาธสภาพ ผลตรวจบงช รวม Disease Non-disease Positive True Positive a False Positive b ( -error) a + b Negative False Negative c ( -error) True Negative d c + d a + c b + d a+b+c+d รวม Sensitivity = Specificity = Positive predictive value = Negative predictive value = Prevalence = Efficiency = Method Evaluation 48
พยาธสภาพ ผลตรวจบงช Sensitivity = Cut-off level Non-disease Positive True Positive a False Positive b ( -error) Negative False Negative c ( -error) True Negative d ความไวสง และ ความจำเพาะสง เปนโรค ข ไมเปนโรค No False Positive False Negative True Negative คาผลตรวจ A Cut-off level No False Negative False Positive เปนโรค True Positive True Negative A B True Positive B คาผลตรวจ C D ความไวสง และ ความจำเพาะสง ไมเปนโรค ความถ ค ความไวตำ แต ความจำเพาะ สง Cut-off level ความไวสง แต ความจำเพาะตำ ไมเปนโรค Cut-off level เปนโรค True Positive True Negative Specificity = ความถ No False Positive No False Negative ความถ ก ไมเปนโรค Disease ง เปนโรค False Negative False Positive True Negative คาผลตรวจ A True Positive B C D คาผลตรวจ Method Evaluation 49
Likelihood Ratio; LR The likelihood ratio of a positive test result (LR(+ is sensitivity divided by 1 - specificity. LR+ = Sensitivity 1 -Specificity The likelihood ratio of a negative test result (LR( is 1 - sensitivity divided by specificity. LR- = 1 -Sensitivity Specificity In general, a diagnostic test with an LR of >10 or <0. 10 changes pretest probability dramatically and is considered a strong diagnostic test. Method Evaluation 50
การใช UPCR และ UA protein วนจฉยภาวะ Proteinurea (>300 mg/24 -h urine) Sensitivity(%) Specificity(%) PPV(%) NPV(%) UPCR > 0. 15 96 53 66 91 UPCR > 0. 17 91 58 67 88 UPCR > 0. 19 89 70 74 88 UPCR > 0. 24 73 87 84 78 UPCR > 0. 28 66 95 93 75 UPCR > 0. 39 55 100 71 UA protein > 1+ 41 100 65 UA protein > 2+ 23 100 28 UA protein > 3+ 11 100 55 From: Dwyer BK, Gorman M, Carroll IR and Druzin M. Journal of Perinatology 2008; 28: 461– 7. Method Evaluation 51
Table 3 Likelihood ratios for the urine protein-creatinine ration and the urinalysis for different ranges of test results. Test Result Likelihood ratioa (95% CI) Interpretation UPCR < 0. 15 – 0. 27 > 0. 28 0. 07 (0. 02 – 0. 27) 0. 73 (0. 44 – 1. 20) 13. 21 (4. 3 – 40. 5) Negative Indeterminate Positive UA Negative > 1+ 0. 59 (0. 47 – 0. 73) 49. 29 (3. 1 – 792. 8) Indeterminate Positive Abbreviations: UA, urinalysis; UPCR, urine protein–creatinine ratio. a 0. 05 was added to empty cells to allow for the calculation of the likelihood ratios. From: Dwyer BK, Gorman M, Carroll IR and Druzin M. Journal of Perinatology 2008; 28: 461– 7. Method Evaluation 52
Receiver Operating Characteristic curve Method Evaluation 53
Performance Characteristics Kind of Error Term of Expression Trueness Systematic Error Bias Accuracy Total Error Uncertainty Precision Random Error Standard Deviation Expression of analytical specific performance characteristics From…Büttner J: Reference Materials and Reference Methods in Laboratory Medicine: A Challenge to International Cooperation, Eur J Clin Chem Clin Biochem, 32, 8: 571 -577, 1994. Method Evaluation 54