
Methane Lecture AOSC 637 Atmospheric Chemistry Russell R
- Slides: 35
Methane Lecture AOSC 637 Atmospheric Chemistry Russell R. Dickerson Finlayson-Pitts Chapt. 6 & 14 Seinfeld Chapt. 2, 6, 23 Wallace & Hobbs Chapt. 5 http: //www. ipcc. ch/publications_and_data. htm OUTLINE Importance Detection Techniques Sources and Sinks Global Chemistry & Trends Remaining Challenges Bibliography Copyright © 2010 R. R. Dickerson 1
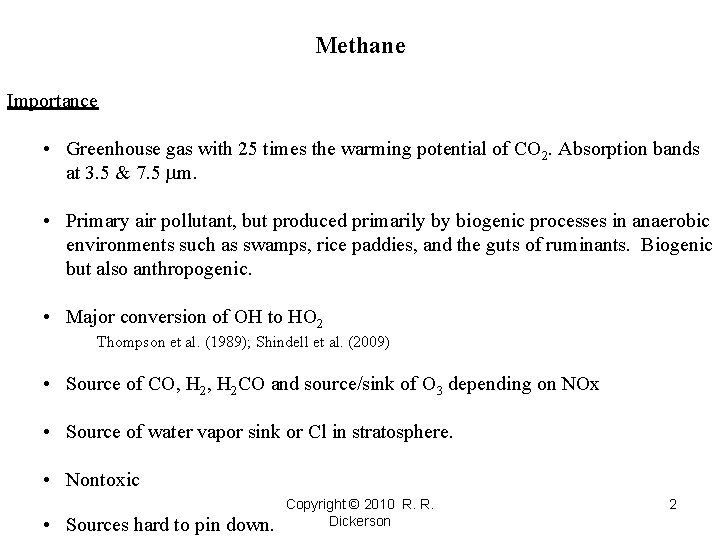
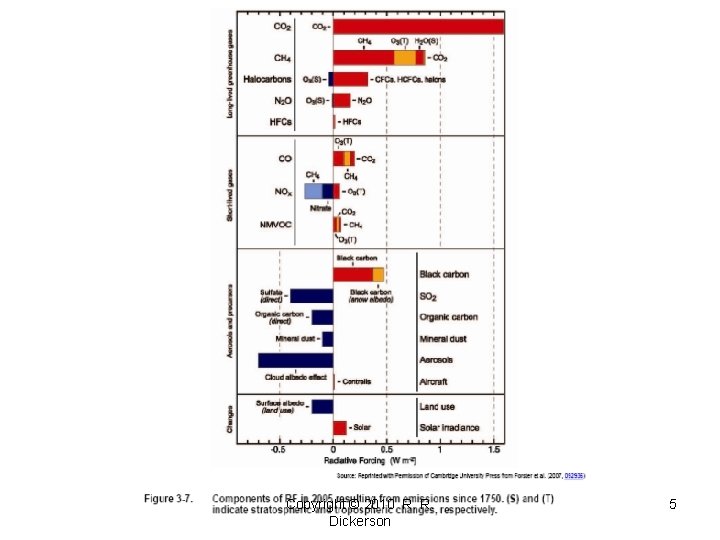
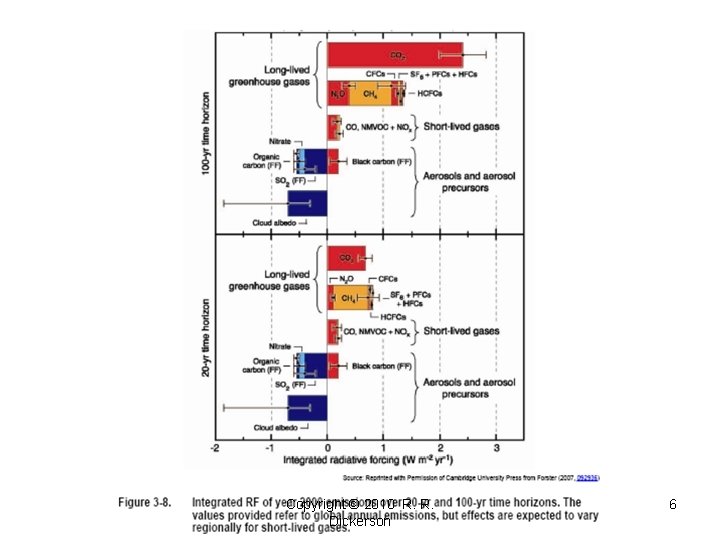
Methane Importance • Greenhouse gas with 25 times the warming potential of CO 2. Absorption bands at 3. 5 & 7. 5 mm. • Primary air pollutant, but produced primarily by biogenic processes in anaerobic environments such as swamps, rice paddies, and the guts of ruminants. Biogenic but also anthropogenic. • Major conversion of OH to HO 2 Thompson et al. (1989); Shindell et al. (2009) • Source of CO, H 2 CO and source/sink of O 3 depending on NOx • Source of water vapor sink or Cl in stratosphere. • Nontoxic • Sources hard to pin down. Copyright © 2010 R. R. Dickerson 2
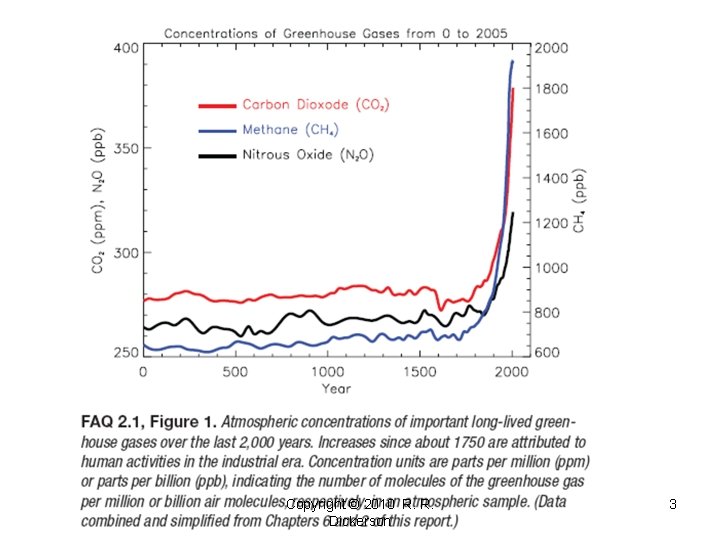
Copyright © 2010 R. R. Dickerson 3
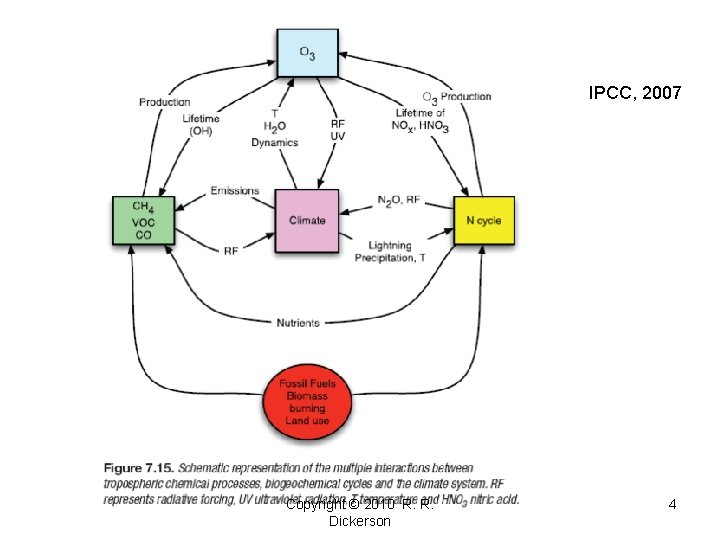
IPCC, 2007 Copyright © 2010 R. R. Dickerson 4
Copyright © 2010 R. R. Dickerson 5
Copyright © 2010 R. R. Dickerson 6
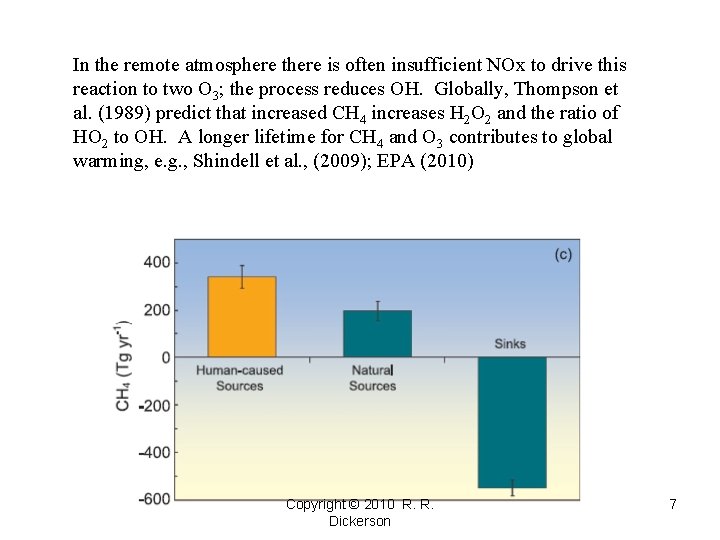
In the remote atmosphere there is often insufficient NOx to drive this reaction to two O 3; the process reduces OH. Globally, Thompson et al. (1989) predict that increased CH 4 increases H 2 O 2 and the ratio of HO 2 to OH. A longer lifetime for CH 4 and O 3 contributes to global warming, e. g. , Shindell et al. , (2009); EPA (2010) Copyright © 2010 R. R. Dickerson 7
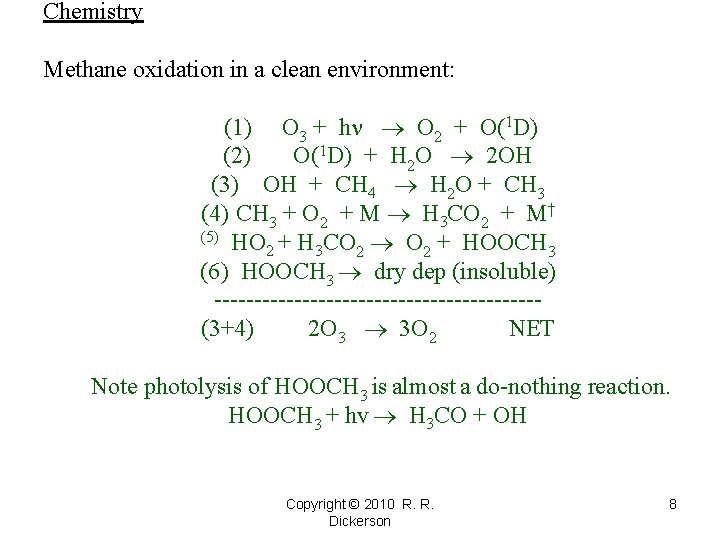
Chemistry Methane oxidation in a clean environment: (1) O 3 + h O 2 + O(1 D) (2) O(1 D) + H 2 O 2 OH (3) OH + CH 4 H 2 O + CH 3 (4) CH 3 + O 2 + M H 3 CO 2 + M† (5) HO + H CO O + HOOCH 2 3 2 2 3 (6) HOOCH 3 dry dep (insoluble) --------------------(3+4) 2 O 3 3 O 2 NET Note photolysis of HOOCH 3 is almost a do-nothing reaction. HOOCH 3 + hv H 3 CO + OH Copyright © 2010 R. R. Dickerson 8
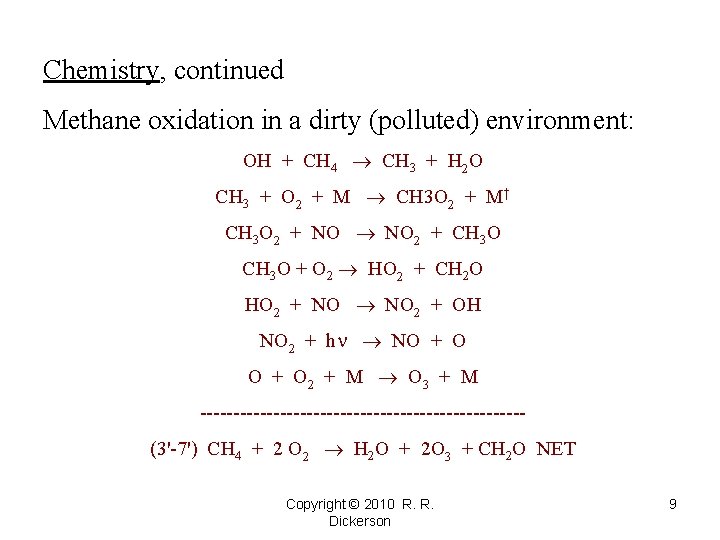
Chemistry, continued Methane oxidation in a dirty (polluted) environment: OH + CH 4 CH 3 + H 2 O CH 3 + O 2 + M CH 3 O 2 + M† CH 3 O 2 + NO 2 + CH 3 O + O 2 HO 2 + CH 2 O HO 2 + NO 2 + OH NO 2 + h NO + O 2 + M O 3 + M ------------------------(3'-7') CH 4 + 2 O 2 H 2 O + 2 O 3 + CH 2 O NET Copyright © 2010 R. R. Dickerson 9
Detection Methods • GC-FID • FTIR • Tunable Diode Laser Spectroscopy Copyright © 2010 R. R. Dickerson 10
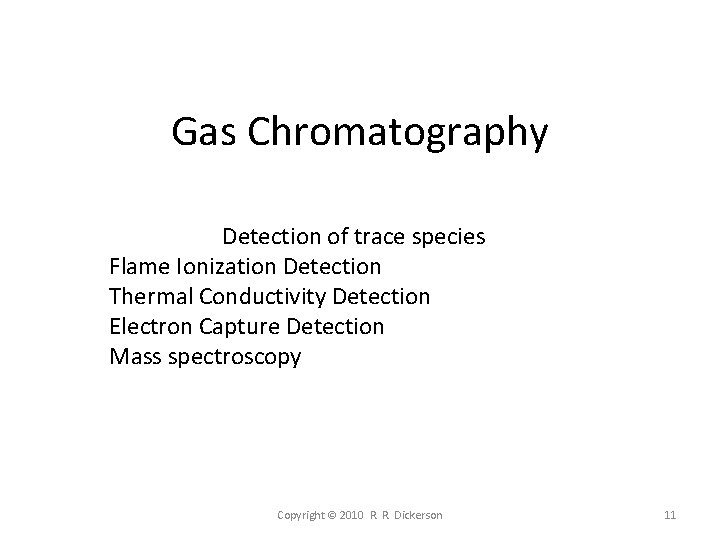
Gas Chromatography Detection of trace species Flame Ionization Detection Thermal Conductivity Detection Electron Capture Detection Mass spectroscopy Copyright © 2010 R. R. Dickerson 11
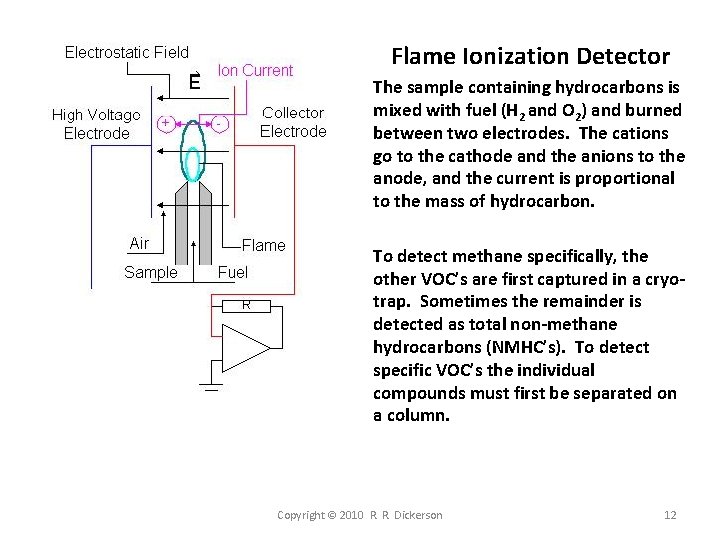
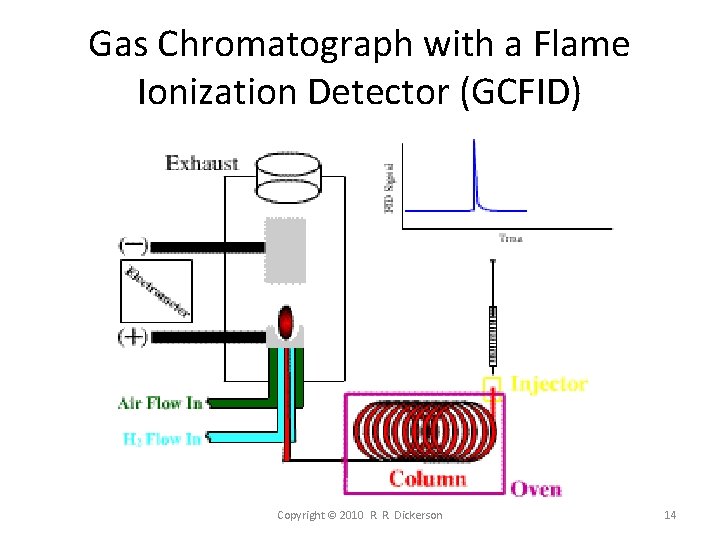
Flame Ionization Detector The sample containing hydrocarbons is mixed with fuel (H 2 and O 2) and burned between two electrodes. The cations go to the cathode and the anions to the anode, and the current is proportional to the mass of hydrocarbon. To detect methane specifically, the other VOC’s are first captured in a cryotrap. Sometimes the remainder is detected as total non-methane hydrocarbons (NMHC’s). To detect specific VOC’s the individual compounds must first be separated on a column. Copyright © 2010 R. R. Dickerson 12
Characteristics of FID • Great sensitivity (picograms, 10 -12 g) • Broad linear dynamic range, 106 • Most HC’s, such as alkanes and alkenes, detected with similar sensitivity; concentration proportional to peak area. • Poor sensitivity to oxygenates such as aldehydes. • Flammable gases expendable. • Separations are black magic. Copyright © 2010 R. R. Dickerson 13
Gas Chromatograph with a Flame Ionization Detector (GCFID) Copyright © 2010 R. R. Dickerson 14
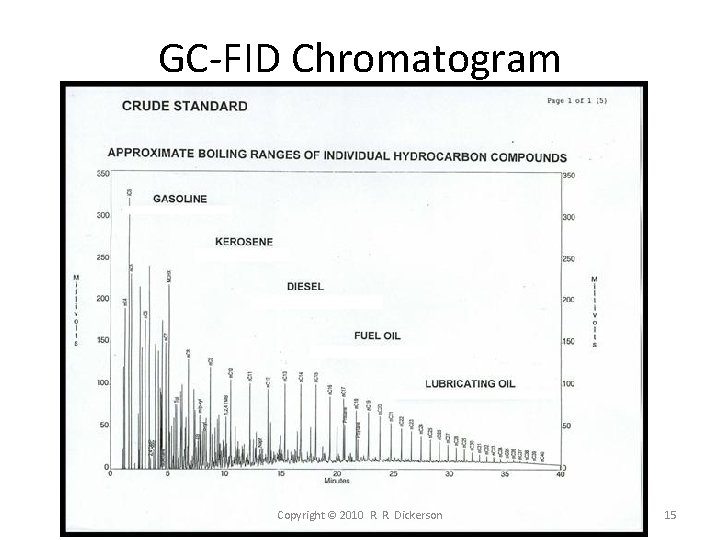
GC-FID Chromatogram Copyright © 2010 R. R. Dickerson 15
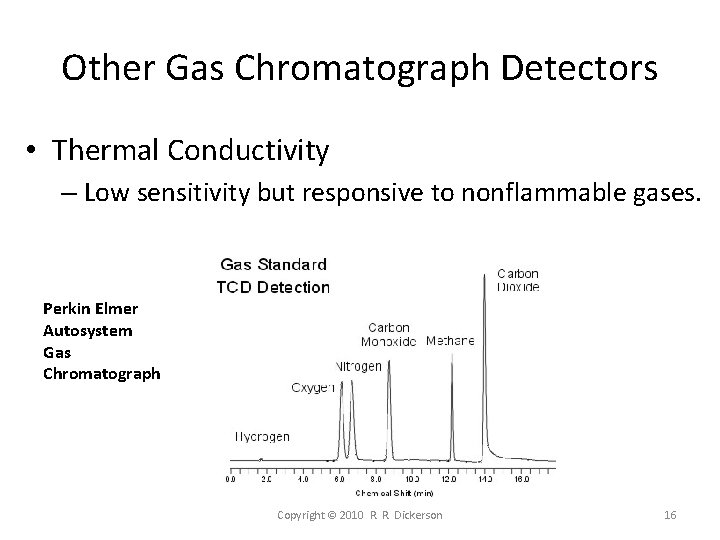
Other Gas Chromatograph Detectors • Thermal Conductivity – Low sensitivity but responsive to nonflammable gases. Perkin Elmer Autosystem Gas Chromatograph Copyright © 2010 R. R. Dickerson 16
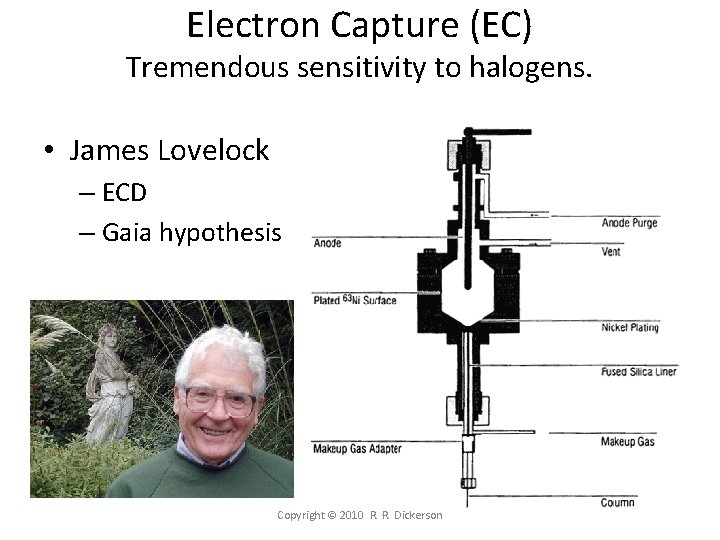
Electron Capture (EC) Tremendous sensitivity to halogens. • James Lovelock – ECD – Gaia hypothesis Copyright © 2010 R. R. Dickerson 17
Electron Capture Detector (ECD) A beta (e-) emitter such as 63 Ni ionizes the carrier gas, usually N 2. Fast beta particles collide with the carrier gas producing free, slow-moving electrons that generate a steady base-line current. When the GC effluent contains organic molecules with electronegative functional groups, such as halogens, phosphorous and nitro groups (inc. N 2 O), they capture electrons and reduce the current. The reduction in electron flow is proportional to the quantity of electrophilic sample components. Electron Capture Detectors, developed by James Lovelock in 1957, are up to 1000 times more sensitive than Flame Ionization Detectors and were the first detectors able to measure components at parts-per-billion (ppb) and parts-per-trillion (ppt) levels. Found DDT is penguins and showed that CFC’s are ubiquitous. Lovelock, J. E. 1958. A sensitive detector for gas chromatography. Journal of Chromatography, l, 35 -46. Disadvantage – only sensitive to halogens and N-compounds. Copyright © 2010 R. R. Dickerson 18
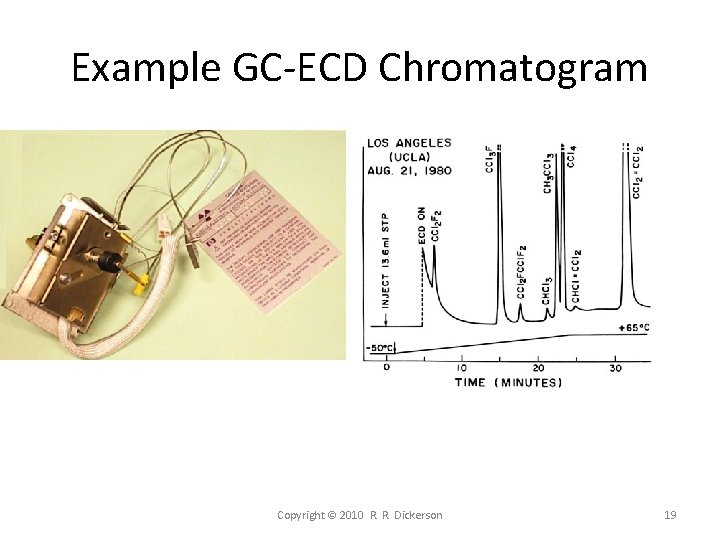
Example GC-ECD Chromatogram Copyright © 2010 R. R. Dickerson 19
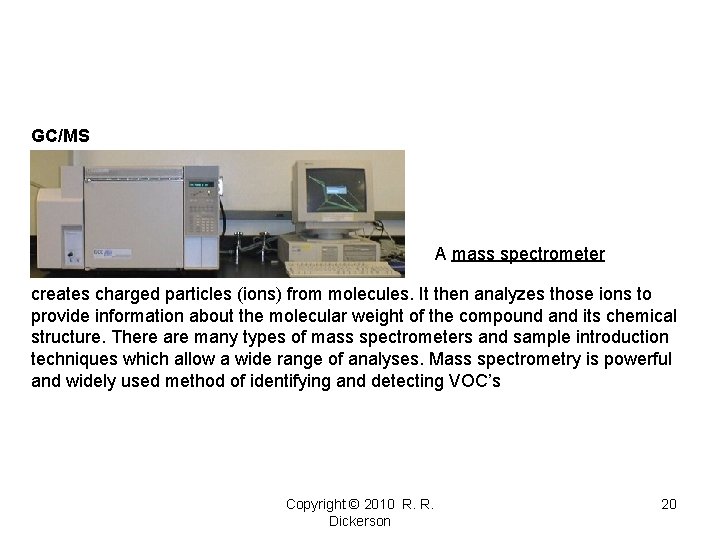
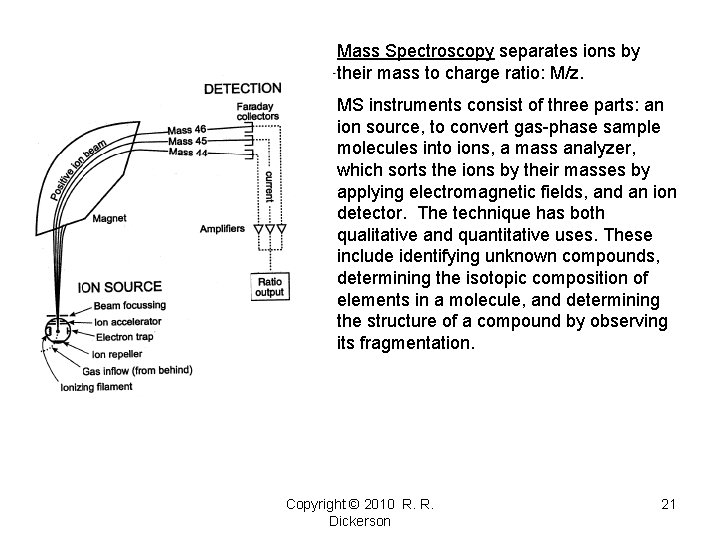
GC/MS A mass spectrometer creates charged particles (ions) from molecules. It then analyzes those ions to provide information about the molecular weight of the compound and its chemical structure. There are many types of mass spectrometers and sample introduction techniques which allow a wide range of analyses. Mass spectrometry is powerful and widely used method of identifying and detecting VOC’s Copyright © 2010 R. R. Dickerson 20
Mass Spectroscopy separates ions by their mass to charge ratio: M/z. MS instruments consist of three parts: an ion source, to convert gas-phase sample molecules into ions, a mass analyzer, which sorts the ions by their masses by applying electromagnetic fields, and an ion detector. The technique has both qualitative and quantitative uses. These include identifying unknown compounds, determining the isotopic composition of elements in a molecule, and determining the structure of a compound by observing its fragmentation. Copyright © 2010 R. R. Dickerson 21
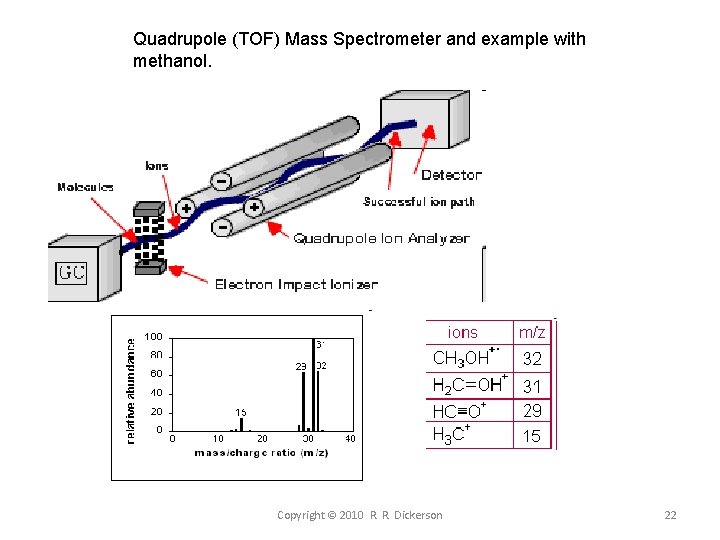
Quadrupole (TOF) Mass Spectrometer and example with methanol. Copyright © 2010 R. R. Dickerson 22
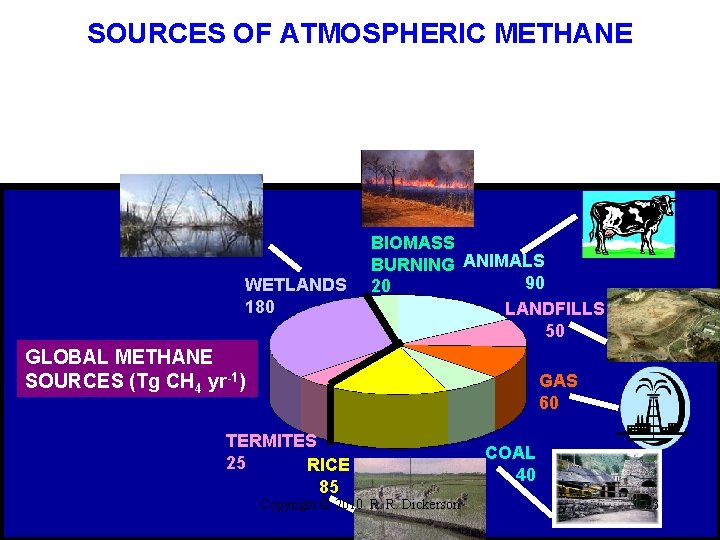
SOURCES OF ATMOSPHERIC METHANE WETLANDS 180 BIOMASS BURNING ANIMALS 90 20 LANDFILLS 50 GLOBAL METHANE SOURCES (Tg CH 4 yr-1) GAS 60 TERMITES 25 RICE 85 Copyright © 2010 R. R. Dickerson COAL 40 23
Copyright © 2010 R. R. Dickerson 24
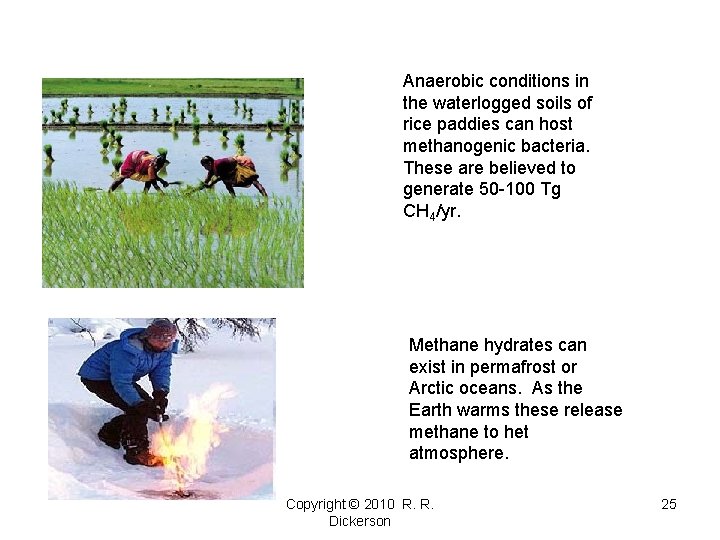
Anaerobic conditions in the waterlogged soils of rice paddies can host methanogenic bacteria. These are believed to generate 50 -100 Tg CH 4/yr. Methane hydrates can exist in permafrost or Arctic oceans. As the Earth warms these release methane to het atmosphere. Copyright © 2010 R. R. Dickerson 25
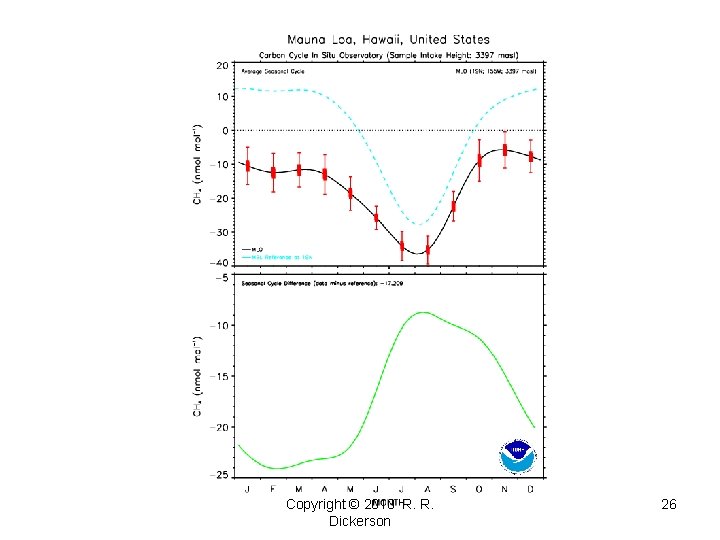
Copyright © 2010 R. R. Dickerson 26
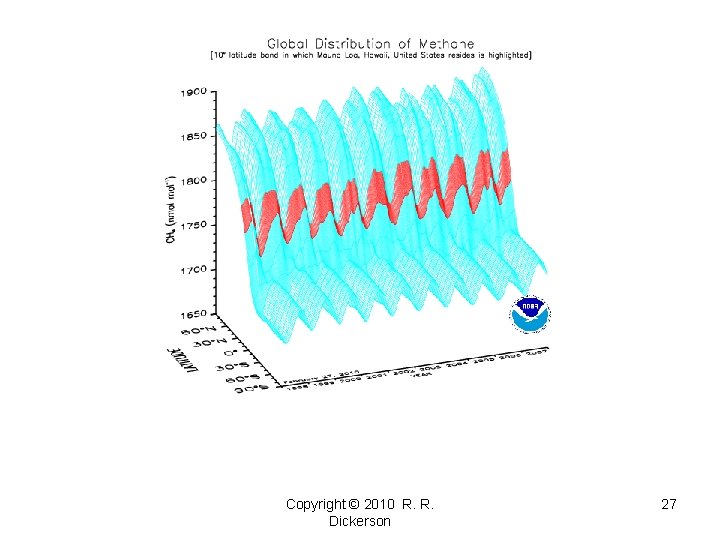
Copyright © 2010 R. R. Dickerson 27
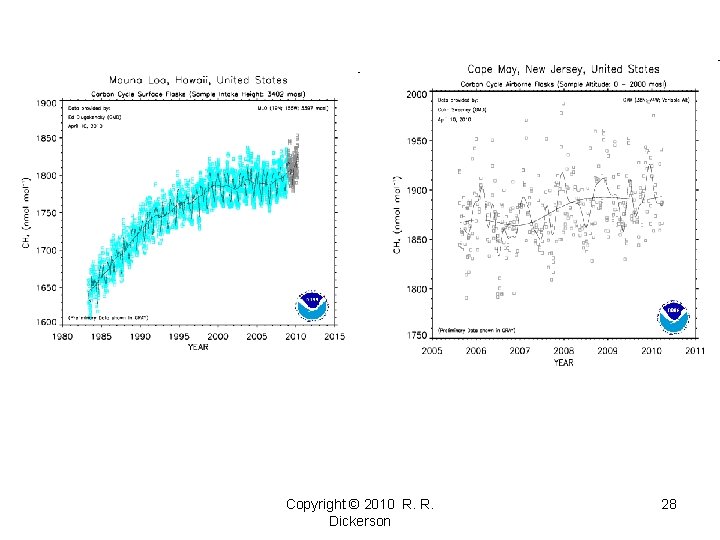
Copyright © 2010 R. R. Dickerson 28
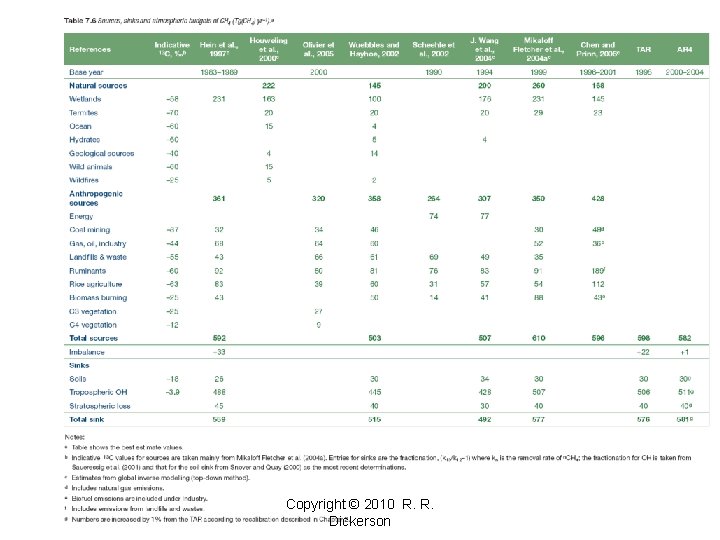
Remaining Challenges related to CH 4 in the atmosphere How accurate are the emissions? Bakerblocker et al. (1977) estimated 300 Tg/yr from wetlands. Zimmerman et al. Science, 1982. Termites 150 Tg. yr? ? Does chlorine consume much methane? CH 4 + Cl → CH 3 + HCl Copyright © 2010 R. R. Dickerson 29
By Tim Hirsch BBC News environment correspondent Last Updated: Wednesday, 11 January 2006, 23: 04 GMT Plants revealed as methane source Forests may add to methane levels, scientists say Scientists in Germany have discovered that ordinary plants produce significant amounts of methane, a powerful greenhouse gas which helps trap the sun's energy in the atmosphere. (despite aerobic conditions! RRD) http: //news. bbc. co. uk/2/hi/science/nature/4604332. stm Frank Keppler, John T. G. Hamilton, Marc Brass and Thomas Röckmann Methane emissions from terrestrial plants under aerobic conditions Nature, January 12, 2006 Copyright © 2010 R. R. Dickerson 30
In terms of total amount of production worldwide, the scientists' first guesses are between 60 and 240 million tonnes of methane per year. That means that about 10 to 30 percent of present annual methane production comes from plants. Problem with scaling from lab to world. Upper limit 125 Tg. S Houweling et al, Geophysical Research Letters, 2006, 33, DOI: 1029/2006 GL 026162. “The results of a single publication stating that terrestrial plants emit methane has sparked a discussion in several scientific journals, but an independent test has not yet been performed. Here it is shown, with the use of the stable isotope 13 C and a laser-based measuring technique, that there is no evidence for substantial aerobic methane emission by terrestrial plants, maximally 0. 3% (0. 4 ng g− 1 h− 1) of the previously published values. Data presented here indicate that the contribution of terrestrial plants to global methane emission is very small at best. ” Dueck, T. et al. New Phytol. 175, 29 -35 (2007). Copyright © 2010 R. R. Dickerson 31
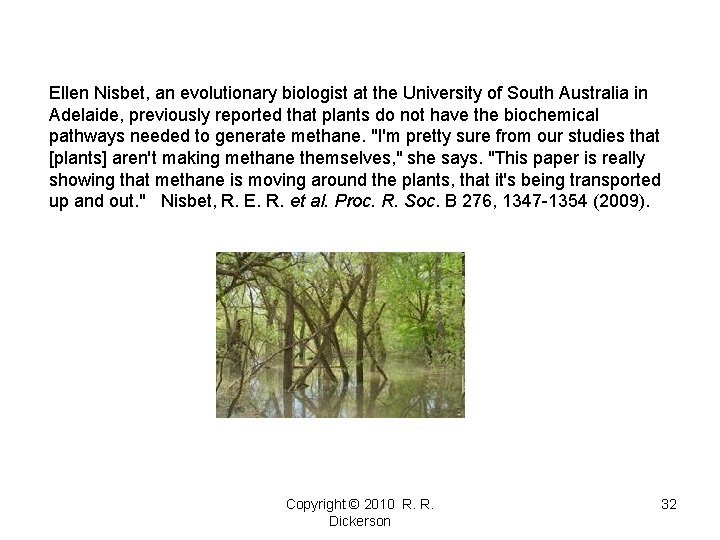
Ellen Nisbet, an evolutionary biologist at the University of South Australia in Adelaide, previously reported that plants do not have the biochemical pathways needed to generate methane. "I'm pretty sure from our studies that [plants] aren't making methane themselves, " she says. "This paper is really showing that methane is moving around the plants, that it's being transported up and out. " Nisbet, R. E. R. et al. Proc. R. Soc. B 276, 1347 -1354 (2009). Copyright © 2010 R. R. Dickerson 32
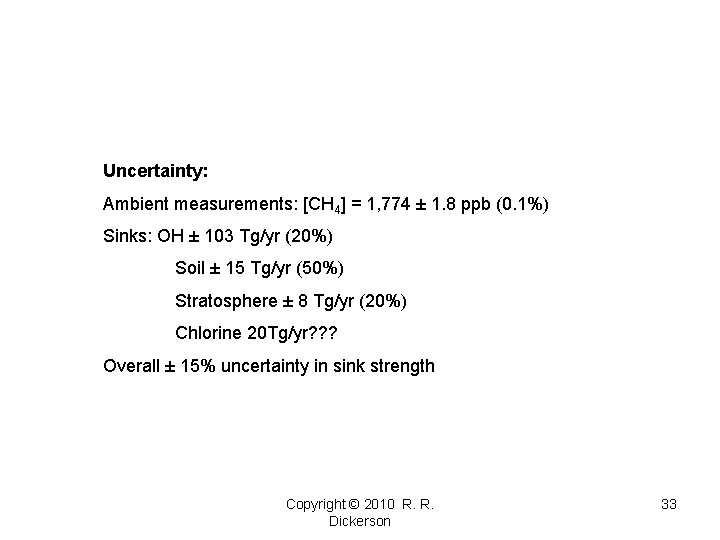
Uncertainty: Ambient measurements: [CH 4] = 1, 774 ± 1. 8 ppb (0. 1%) Sinks: OH ± 103 Tg/yr (20%) Soil ± 15 Tg/yr (50%) Stratosphere ± 8 Tg/yr (20%) Chlorine 20 Tg/yr? ? ? Overall ± 15% uncertainty in sink strength Copyright © 2010 R. R. Dickerson 33
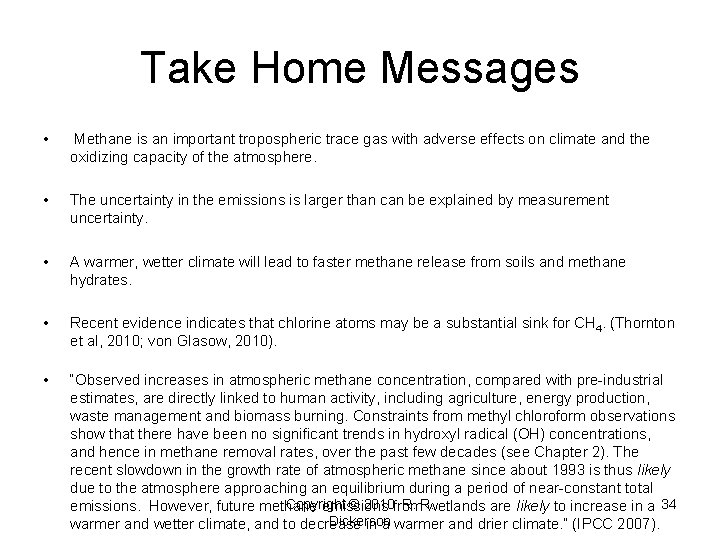
Take Home Messages • Methane is an important tropospheric trace gas with adverse effects on climate and the oxidizing capacity of the atmosphere. • The uncertainty in the emissions is larger than can be explained by measurement uncertainty. • A warmer, wetter climate will lead to faster methane release from soils and methane hydrates. • Recent evidence indicates that chlorine atoms may be a substantial sink for CH 4. (Thornton et al, 2010; von Glasow, 2010). • “Observed increases in atmospheric methane concentration, compared with pre-industrial estimates, are directly linked to human activity, including agriculture, energy production, waste management and biomass burning. Constraints from methyl chloroform observations show that there have been no significant trends in hydroxyl radical (OH) concentrations, and hence in methane removal rates, over the past few decades (see Chapter 2). The recent slowdown in the growth rate of atmospheric methane since about 1993 is thus likely due to the atmosphere approaching an equilibrium during a period of near-constant total Copyright © 2010 from R. R. emissions. However, future methane emissions wetlands are likely to increase in a 34 Dickerson warmer and wetter climate, and to decrease in a warmer and drier climate. ” (IPCC 2007).
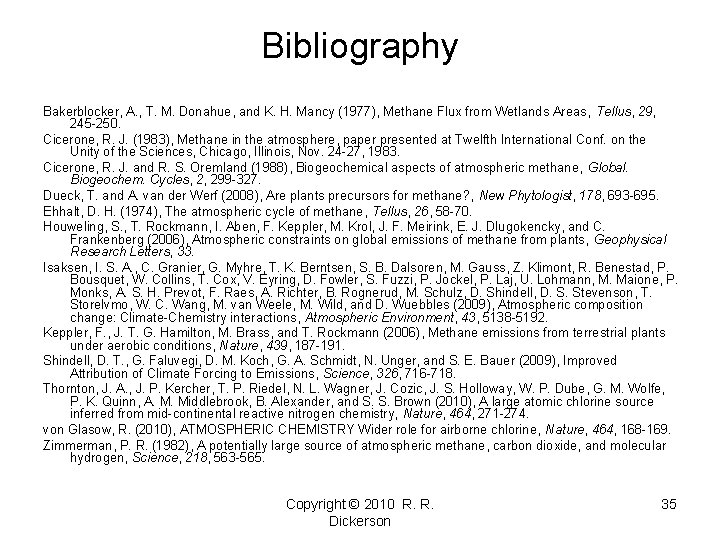
Bibliography Bakerblocker, A. , T. M. Donahue, and K. H. Mancy (1977), Methane Flux from Wetlands Areas, Tellus, 29, 245 -250. Cicerone, R. J. (1983), Methane in the atmosphere, paper presented at Twelfth International Conf. on the Unity of the Sciences, Chicago, Illinois, Nov. 24 -27, 1983. Cicerone, R. J. and R. S. Oremland (1988), Biogeochemical aspects of atmospheric methane, Global. Biogeochem. Cycles, 2, 299 -327. Dueck, T. and A. van der Werf (2008), Are plants precursors for methane? , New Phytologist, 178, 693 -695. Ehhalt, D. H. (1974), The atmospheric cycle of methane, Tellus, 26, 58 -70. Houweling, S. , T. Rockmann, I. Aben, F. Keppler, M. Krol, J. F. Meirink, E. J. Dlugokencky, and C. Frankenberg (2006), Atmospheric constraints on global emissions of methane from plants, Geophysical Research Letters, 33. Isaksen, I. S. A. , C. Granier, G. Myhre, T. K. Berntsen, S. B. Dalsoren, M. Gauss, Z. Klimont, R. Benestad, P. Bousquet, W. Collins, T. Cox, V. Eyring, D. Fowler, S. Fuzzi, P. Jockel, P. Laj, U. Lohmann, M. Maione, P. Monks, A. S. H. Prevot, F. Raes, A. Richter, B. Rognerud, M. Schulz, D. Shindell, D. S. Stevenson, T. Storelvmo, W. C. Wang, M. van Weele, M. Wild, and D. Wuebbles (2009), Atmospheric composition change: Climate-Chemistry interactions, Atmospheric Environment, 43, 5138 -5192. Keppler, F. , J. T. G. Hamilton, M. Brass, and T. Rockmann (2006), Methane emissions from terrestrial plants under aerobic conditions, Nature, 439, 187 -191. Shindell, D. T. , G. Faluvegi, D. M. Koch, G. A. Schmidt, N. Unger, and S. E. Bauer (2009), Improved Attribution of Climate Forcing to Emissions, Science, 326, 716 -718. Thornton, J. A. , J. P. Kercher, T. P. Riedel, N. L. Wagner, J. Cozic, J. S. Holloway, W. P. Dube, G. M. Wolfe, P. K. Quinn, A. M. Middlebrook, B. Alexander, and S. S. Brown (2010), A large atomic chlorine source inferred from mid-continental reactive nitrogen chemistry, Nature, 464, 271 -274. von Glasow, R. (2010), ATMOSPHERIC CHEMISTRY Wider role for airborne chlorine, Nature, 464, 168 -169. Zimmerman, P. R. (1982), A potentially large source of atmospheric methane, carbon dioxide, and molecular hydrogen, Science, 218, 563 -565. Copyright © 2010 R. R. Dickerson 35