Meteorological charts Surface weather chart for 3 January

 1110 km: 1° lat")


- Slides: 12
Meteorological charts
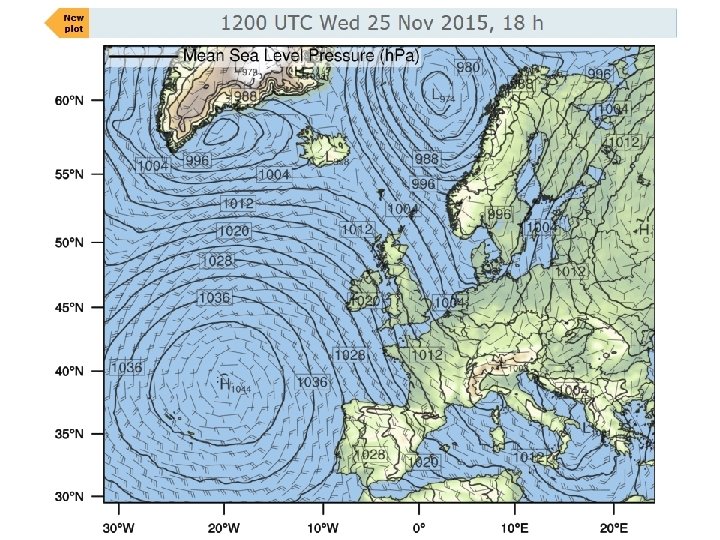
Surface weather chart for 3 January 2007 (UK Met Office) 1110 km: 1° lat = 111 km http: //www. wetterzentrale. de/topkarten/tknfax. html
Salient features • Surface pressure pattern dominated by highs and lows, on a scale ~ 103 km. We call this the synoptic scale
Salient features • Surface pressure pattern dominated by highs and lows, on a scale ~ 103 km. We call this the synoptic scale • Pressure excursions around ± 30 mb – much smaller than the total pressure of ~1000 mb.
Salient features • Isobars give an indication of the wind speed by the geostrophic relation: wind tends to flow along isobars and its strength is proportional to pressure gradient Wind is in knots – 1 knot = 0. 5 ms-1. The arrow points along the wind direction. This symbol is called a wind fleck.
Time scale 00 h 3/1/07 Weather system takes ~ 1 day to pass over the UK – so synoptic timescale is around a day (105 s) 00 h 4/1/07
Fronts AVHRR IR image 2317 2/1/07 http: //www. sat. dundee. ac. u
Warm airfronts Cold and warm Cold Air Motion of front Warm air Cold front: narrow (~100 km), steep, can get line convection particularly on leading edge www. quora. com Cold Air Warm front: broad (~300 km), layer cloud due to gentle upglide. Convection unusual.
Occluded front Warm air Cold, unstable air Cold, stable air
Radiosondes Vaisala RS 80 Vaisala RS 92 Launching a radiosonde European radiosonde stations (launch 00 and 12 UTC) Data available from: http: //weather. uwyo. edu/upperair/sounding. html
700 mb, 300 mb, ~ 3 km ~ 9 km Smoother patterns than at the surface; fronts not marked on these charts 700 and 300 mb charts show a similar pattern – synoptic scale features are generally coherent throughout the troposphere. That is, vertical scale of synoptic-scale features ~ 10 km Winds closer to geostrophic – no surface friction Very strong winds at 300 mb denote the jet stream. Jet stream is related to fronts, either at the surface or in the upper troposphere. Westerly winds increase with height: thermal wind equation