MetaAnalysis 101 7 3 Lecture 7 3 Metaanalysis

 § Meta-analysis 室 上機操作 (7 -17): 電腦教")


 sampling errors § Homogenicity 檢測 (individual patient data),")
依 weight衡量. § 在meta-analysis中,")
 95% CI 1 17/20 0. 28 10. 59")


 proposed a test for asymmetry of the funnel")


- Slides: 55
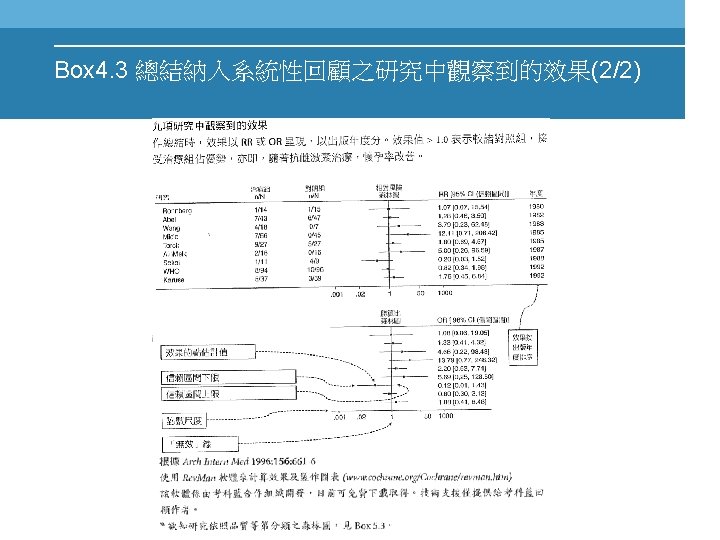
總結證據結果 & Meta-Analysis 101 -7 -3
§ Lecture (7 -3) § Meta-analysis 室 上機操作 (7 -17): 電腦教
Summary of the relevant references
Meta-Analysis § Why meta-analysis § Heterogeneity of the studies § Fixed effect methods for combining study estimate § Random effect methods for combining study estimate § Sensitivity analysis § Presenting the results of a meta-analysis
Meta-analysis § 積少成多 § 減少 (n大是王道) sampling errors § Homogenicity 檢測 (individual patient data), summary data結果一致 § 一致: IPD heterogenicity: summary data (metaanalysis) § 存在
Meta-analysis § Weight= 1/variance study的 重要性 ( 貢獻性)依 weight衡量. § 在meta-analysis中,
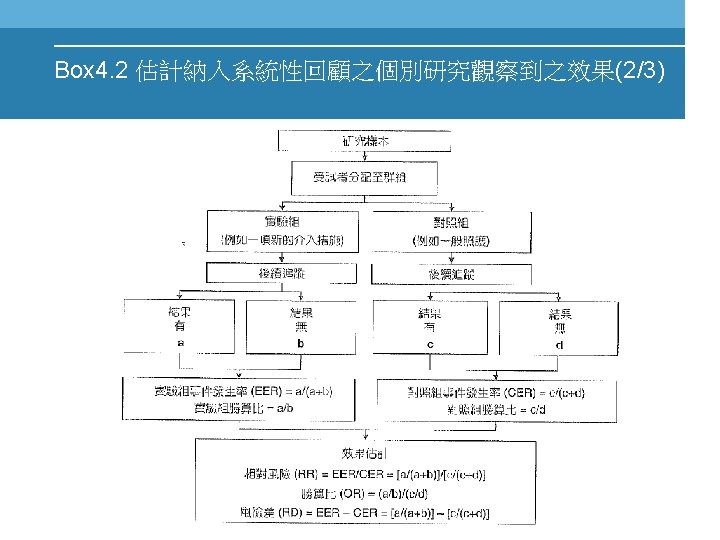
study n d s Var (d) 95% CI 1 17/20 0. 28 10. 59 0. 11 -0. 37 to 0. 93 2 39/40 -0. 81 16. 18 0. 05 -1. 27 to -0. 35 3 15/15 -0. 9 8. 86 0. 15 -1. 65 to -0. 15 126/139 -0. 85 12. 49 0. 02 -1. 1 to -0. 59 . . . 9.
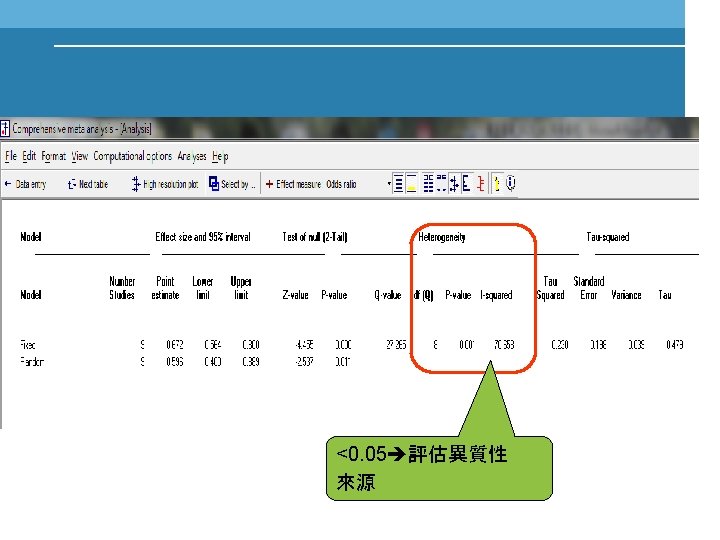
Due to heterogenicity, we do Meta-Analysis § Heterogenicity § Chi-square test: p<0. 05 異質性過高 個別分析, 評估 異質性來源 § Chi-square test: p>0. 05 進入 meta-analysis § 異質程度: I 2=(Q-df)/Q x 100% (df=study numbmer -1) low: <=0. 2; middle: 0. 2 -0. 5; high: >0. 5 § 但書: § 10篇studies以下, 改 用 0. 1當 cutpoint
§ P-value § >=0. 5 § for heterogenicity Fixed-effect model 0. 05 -0. 5 Random-effect model § <0. 05 評估異質性來源
§ Fixed-effect model: the between groups variance is ignored; only with-in study variance is considered § Random-effect model: consider both the between- and with-study variation; 較保守 策略 § Relative weight of study: 在random-effect model中, 小型study權重相對提高.
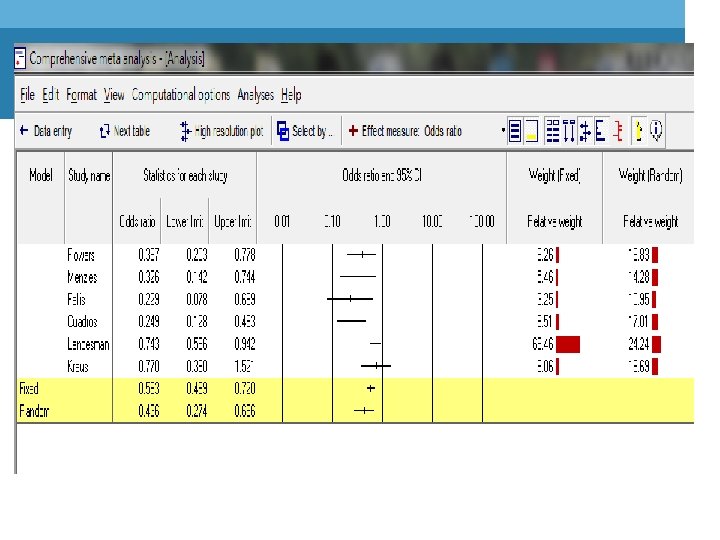
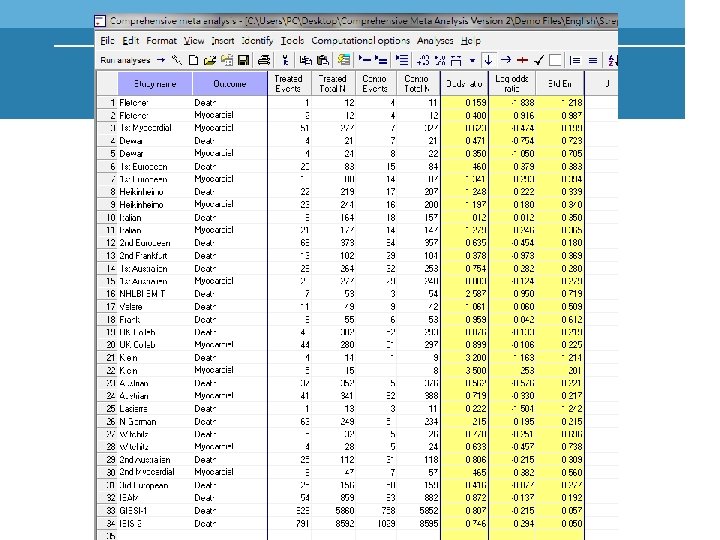
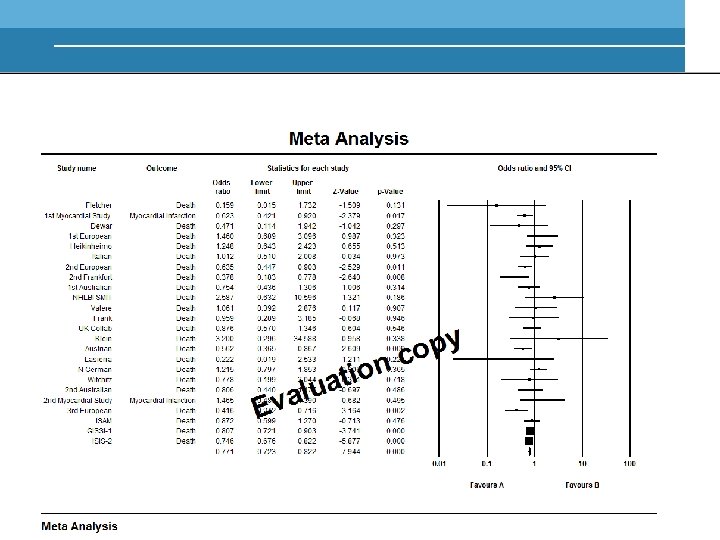
Example
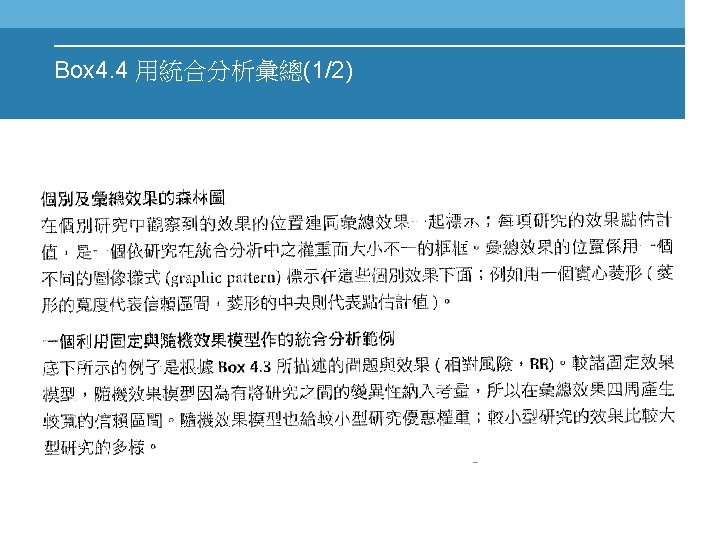
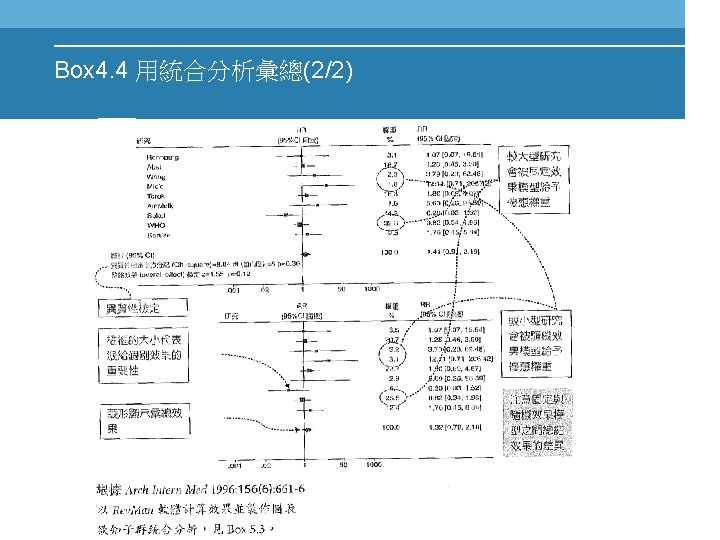
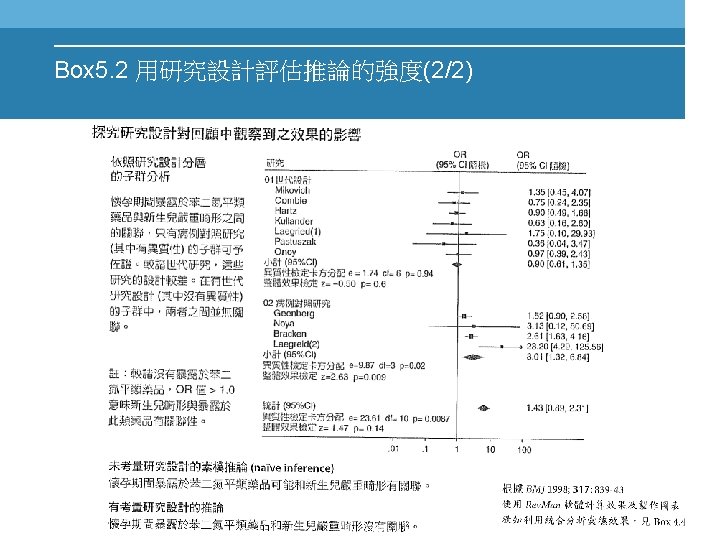
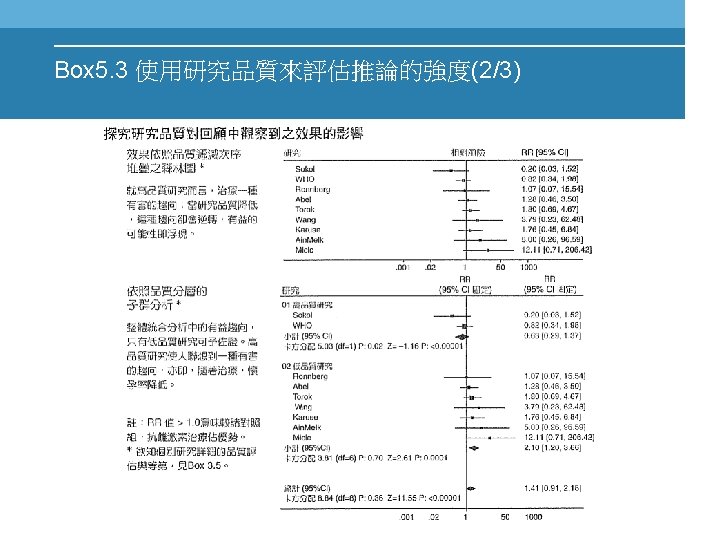
Forest plot
P=0. 065 random effect
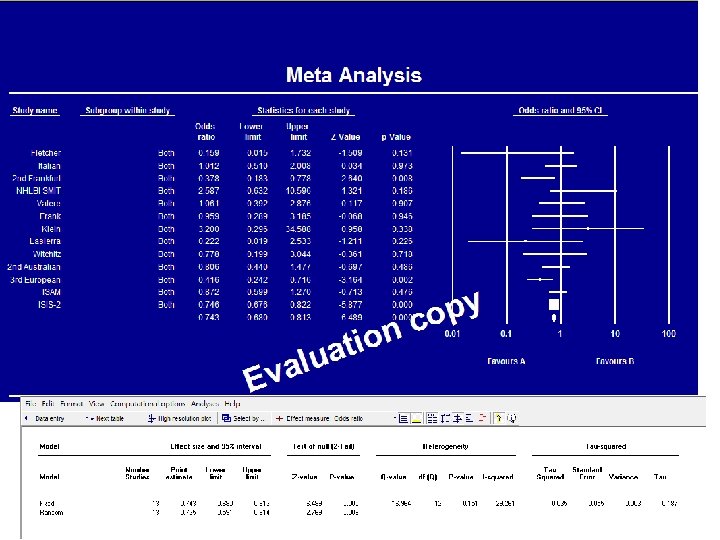
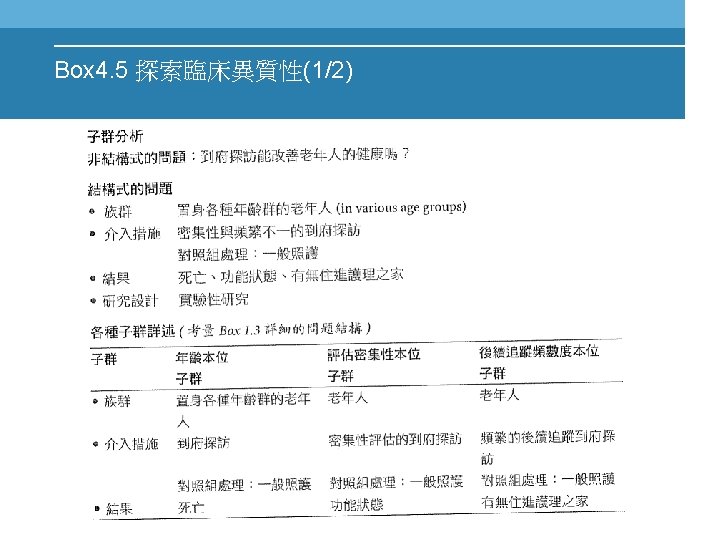
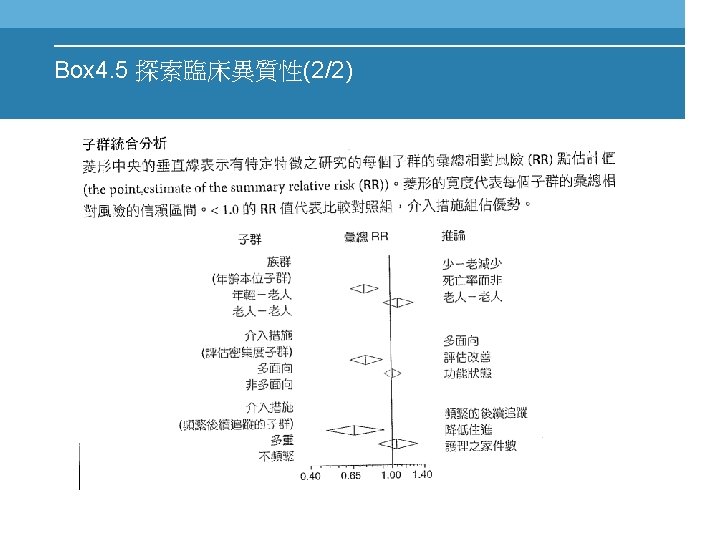
Subgroup analysis
Male
Female
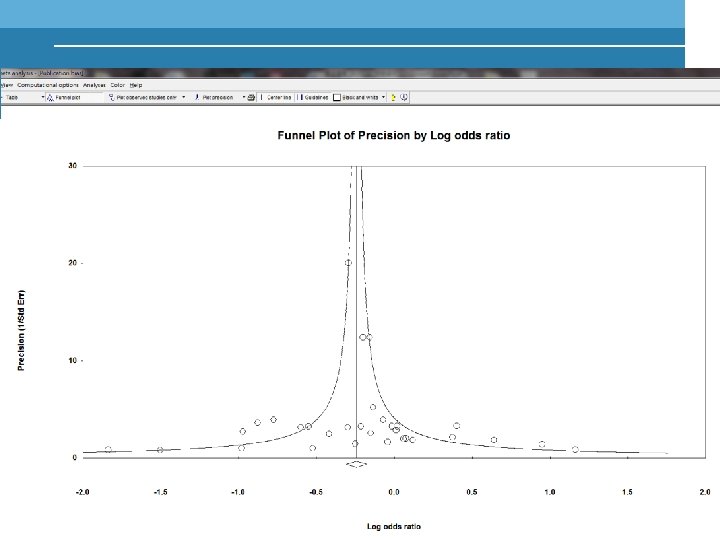
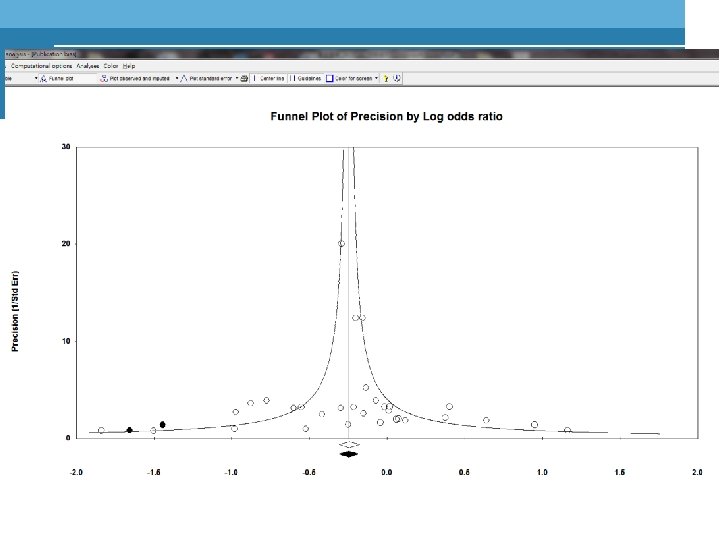
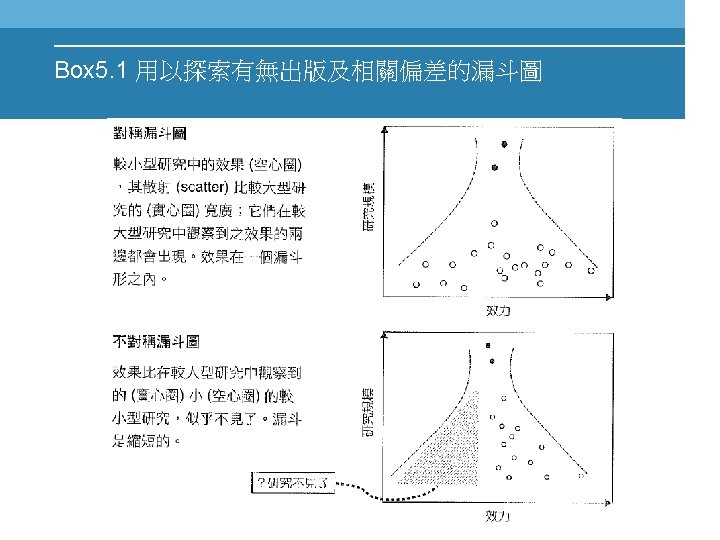
Publication bias: Funnel plot
Egger’s test Egger et al. (1997) proposed a test for asymmetry of the funnel plot. This is a test for the Y intercept = 0 from a linear regression of normalized effect estimate (estimate divided by its standard error) against precision (reciprocal of the standard error of the estimate). Stats. Direct provides this bias indicator method with all meta-analyses. Please note that the power of this method to detect bias will be low with small numbers of studies. 檢測 intercept是否為” 0”
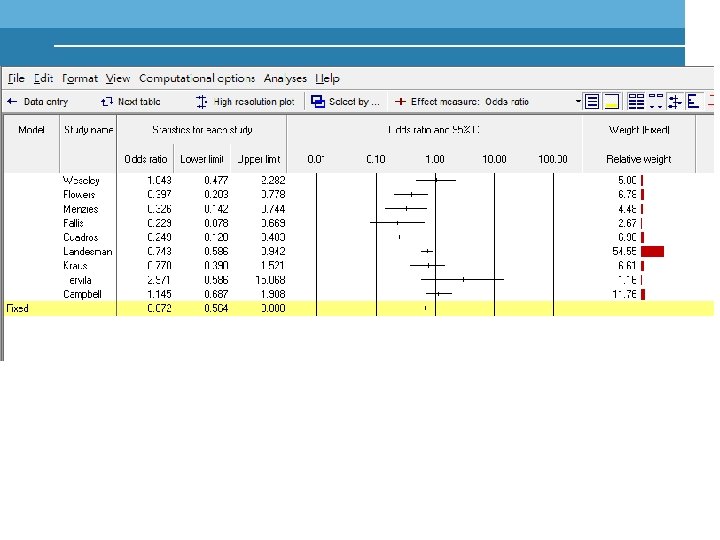
Sensitivity analysis § Sensitivity of results of inclusion of criteria: § delete some study § Sensitivity of results to meta-analysis methods (different weighting) § Weighting method
Log scale
其他 8個studies 9 個 studies
Sensitivity test
Summary § Abstract § Background § Hypothesis § Review methods § Details of studies included § Details of studies excluded § Results of the review § Analysis of the robustness of the results: sensitivity test § Discussion: included publication bias