mesoscale climate dynamics in Southern California IRI April


 associated with the onshore regime has significant spatial structure due")
 associated with each of the three wind regimes.")


 undertook a fire frequency analysis of these 9 fire-prone landscapes")


- Slides: 31
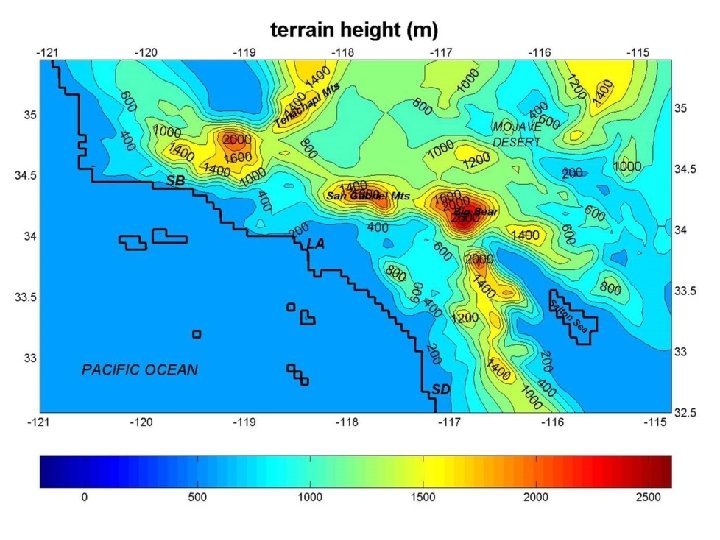
mesoscale climate dynamics in Southern California IRI, April 4, 2006 Sebastien Conil Alex Hall Southern California February 9, 2002 MISR
REGIONAL CLIMATE SIMULATION
Experimental Design model: MM 5 boundary conditions: eta model reanalysis resolution: domain 1, 54 km, domain 2, 18 km, domain 3, 6 km time period: 1995 to present. One can think of this as a reconstruction of weather conditions over this time period consistent with three constraints: (1) our best guess of the largescale conditions, (2) the physics of the MM 5 model, and (3) the prescribed topography, consistent with model resolution.
VALIDATION We evaluate the simulation’s fidelity by comparing available observations with model output from the grid points nearest observation stations.
CIRCULATION VARIABILITY
A view of the Santa Anas from space, taken by the Multiangle Imaging Spectro. Radiometer (MISR) on February 9, 2002.
The winds simulated by the model during the Santa Ana event of February 9 -12, 2002. Note the intense flow, reaching speeds on the order of 10 meters per second, being channeled through mountain passes.
VALIDATION This shows the correlation of daily-mean wind speed and direction between model and observations at 18 locations. Both wind speed and direction are reasonably well-correlated at all locations, in spite of many possible reasons for disagreement, including systematic and random measurement error. This gives confidence that the timing and magnitude of circulation anomalies are correct in the simulation.
Cluster Analysis To classify the regimes of wind variability in Southern California, we performed a probabalistic cluster analysis algorithm (Smyth et al. 1999) on the October to March dailymean winds. The clustering technique provides an quantitative means of defining preferred modes of wind variability. We chose to focus on the wet season because of the interesting combination of phenomena (Santa Ana events and precipitation) during this period. We found that the wind regimes can be well-described in terms of three clusters, which together account for 82% of the days.
A scatterplot of the wind anomalies in the space of the first two wind EOFs reveals asymmetries in the PDF of wind anomalies. These can be captured with three clusters.
The Santa Ana regime is characterized by intense offshore flow with significant spatial structure. The composite wind pattern is shown above, with winds in m/s. Its average duration is 1. 7 days and it accounts for 13% of the total days in the analysis.
The onshore regime is characterized by flow with an onshore component over land. Its average duration is 1. 6 days and it accounts for 27% of the total days in the analysis.
The common northwesterly regime is characterized by weak winds over land, and strong alongshore flow over the ocean. Its average duration is 2. 4 days and it accounts for 42% of the total days in the analysis. This is therefore the dominant wind regime in Southern California.
hydrology temperature Scatterplots of the daily wind anomalies for the 8 wet seasons in PC 1 -PC 2 space. The points are color-coded by the daily-mean rain fall rates averaged over the 6 -km domain. Red points are non precipitating or very days (rain rate less than 0. 00005 mm/hr), green points are moderately dry or slightly precipitating days (rain rates greater than 0. 00005 mm/hr and less than 0. 025 mm/hr), while blue points are precipitating days (rain rates greater than 0. 025 mm/hr).
The Santa Ana regime is also associated with extreme dryness in the zone between the mountains and the coast, as illustrated by this composite relative humidity (%) map.
The precipitation (in mm/hr) associated with the onshore regime has significant spatial structure due to orography.
The composite temperature anomalies (deg C) associated with each of the three wind regimes.
hydrology temperature Scatterplots of the daily wind anomalies for the 8 wet seasons in PC 1 -PC 2 space. The points are color-coded by the daily-mean 2 m temperature anomalies averaged over the coastal zone between Los Angeles and San Diego. Red points are warm days (2 m temperature anomalies above 0. 8 C), blue points are cool days (2 m temperature anomalies below -0. 8 C), while green points are neither warm nor cool (2 m temperature anomalies between 0. 8 C and 0. 8 C).
RELATION TO LARGER SCALE
PNA These are the primary modes of pressure variability during when the entire Siberian. Pacific-North American sector is considered. They are revealed by EOF analysis of 500 h. Pa NCEP reanalysis data. These correspond with known modes of variability. For example, the top pattern corresponds to the Pacific -North American pattern (PNA).
Here is the chance of occurrence of the Southern California wind regimes when the magnitude of the various large-scale modes is large. No one large-scale mode has significantly stronger relationship with a local regime than any of the other largescale modes. The large-scale modes therefore have very little predictive power of the local regimes.
Large-scale sea level pressure patterns associated with the three clusters. Cluster 1 is associated with a highly localized high over the Great American desert. Cluster 2 is associated with a dipole pattern, with a low over the western U. S. and a high over the central Pacific. The pattern associated with Cluster 3 is very similar to the climatology.
This is the sea level pressure pattern associated with the Santa Ana mode. It consists of a localized high over the Great Basin. Why is this pattern so important for Southern California?
APPLICATION TO FIRE
Moritz et al (2004) undertook a fire frequency analysis of these 9 fire-prone landscapes in Southern California. They quantified the probability that a given area will burn as a function of fuel age.
They found that all areas but one exhibit very little increase in fire hazard with fuel age.
This is the region that exhibits dependence of fire hazard on fuel age.
It’s also a region where downslope flow speeds are very low during Santa Ana events… This is the region that exhibits dependence of fire hazard on fuel age.
It’s also a region where downslope flow speeds are very low during Santa Ana events… This is the region that exhibits dependence of fire hazard on fuel age. …and relative humidity anomalies during Santa Ana events are relatively small
CONCLUSIONS VALIDATION: The quality of the simulated circulation variability in Southern California is high, as revealed by the fact that simulated nearsurface wind speed and direction both are highly correlated with point measurements of wind speed and direction made at 18 individual stations scattered throughout the model domain. TECHNIQUE: Cluster analysis applied to simulated daily-mean nearsurface winds was used to identify the dominant local modes of circulation variability: Common Northwesterly, Onshore, and Santa Ana. RELEVANCE: These wind regimes, together with the complex Southern California topography, are the main source of highly-structured perturbations in temperature and hydrology in Southern California. RELATION TO LARGE SCALE: The local circulation regimes are particularly sensitive to vacillations of the pressure over the Great Basin region, but are curiously insensitive to the large-scale teleconnections or weather regimes predominant in the Pacific--North American sector. APPLICATION EXAMPLE: The simulated fine-scale structure of the Santa Ana winds may explain observed geographical variations in fire hazard in Southern California.