Mediumterm Precipitation Projections with Neural Networks THE SEARCH


- Slides: 26
Medium-term Precipitation Projections with Neural Networks THE SEARCH FOR INSIGHTS INTO THE PHENOMENOLOGY OF DROUGHT AND EL NINO CONDITIONS JUSTIN LE, SCHMID COLLEGE OF SCIENCE AND TECHNOLOGY
California Drought
California Drought
Environmental Impacts of Drought Short-term: ◦ Detriments to Hydropower production and recreation ◦ Low farm yields Long-term: ◦ Groundwater storage lost ◦ Food and water shortages ◦ Over-pumping can cause permanent groundwater loss, land elevation sinking, and seawater intrusion ◦ Wildfire risks 2015 drought season estimated to have cost more than $2. 2 billion in economic loss.
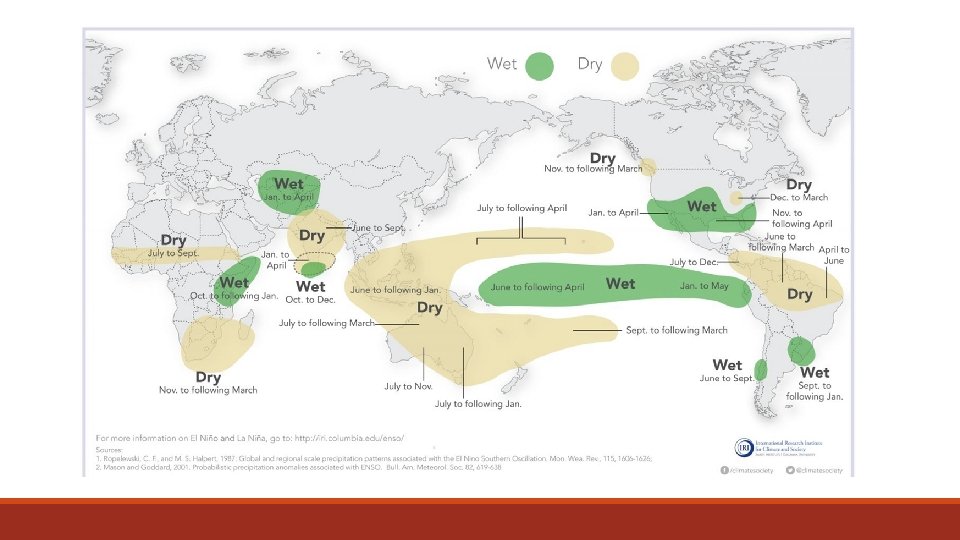
El Nino Global periodic phenomenon linked to high ocean temperatures near South American coast In California, manifests as a season of extreme rainfall, flooding, and warm temperatures. 1997 -1998 El Nino Season is estimated to have caused $25 billion in damages to the entire country.
2015 -2016 El Nino Season
Questions §Can machine learning techniques give us: § Autocorrelative patterns? § Insight on physical phenomenon?
Neural networks §“Universal Approximators” §Inspired by topology of human brain §Actively explored space of training algorithms to configure a network to approximate any function to arbitrary accuracy
Feed-Forward Neural Networks §Input comes in through input layer, and information proceeds through to the output. §Connections from layer to layer have different strength and transfer functions §“Training” involves selecting how strong each connection should be.
Issues §Search space very large and erratic compared to what common sense dictates §Strong potential of overfitting
Recurrent Neural Networks • Trainable state machines • Universal approximation of processes, not functions • Nodes receive delayed signals from their past outputs • Much more suited for time series, and topology is much closer to reality. • Much less parameters; “recentness” built in. • Training and prediction done over a series, not over a data point.
Ability to look at physical phenomenon Andrej Karpathy, “The Unreasonable Effectiveness of Recurrent Neural Networks” May 21 2015 http: //karpathy. github. io/2015/05/21/rnn-effectiveness/
Initial Results §Initial results demonstrated correlation, making this avenue apparently worth pursuing. §Strong signs of overfitting. §Parameter reduction (and removing hidden layers) tended to improve results, but hit a wall.
Combatting Overfitting with Noise §Realization: we are trying to model a distribution, not a function. §Train with noise! Forces robustness. §Instant decreases in overfitting observed, and higher correlations.
Combatting overfitting with Dropout §Train handicapped versions of networks in hopes that they find different features, and a way to work together despite missing neurons. §Inspired by sexual selection in evolution. Power in variation. §Overall effect is similar to running several networks at once, within only one network!
Increasing Expressivity with Rectified Linear Unit Activation Functions
Predicting the Future §Network is shaped to predict the next month of climate data/indices. But can it predict long-term? §“Leapfrogging into the future”. §Add noise to get confidence intervals.
Node Activation Maps §Developing visualizations to peek into the mind of networks to find new potential phenomenon §Might yield: § Features that correspond to known or unknown physical phenomenon § Correlate with outside data and find any links § The ability to identify weak nodes or overly correlated nodes, and delete them: “brain surgery” § A way to gauge the health of a neural network.
Training
Validation
Prediction
Historical El Nino Z Indices Season Peak Anomaly Month Annual Anomaly 1957 -1958 1982 -1983 1997 -1998 2009 -2010 2015 -2016* 3. 03 2. 22 4. 13 1. 10 0. 72 April February January March 0. 50 1. 15 1. 10 0. 45 0. 24 * Projected
2012 -2016 Annual Z-Index Anomalies Year 2012 2013 2014 2015 2016* Annual Anomaly -0. 93 -1. 30 -1. 17 -0. 85 0. 24 * Projected
Answers? §Definitely evidence of predictive power with high correlation (. 5 -. 7 depending on the index being predicted). §Drought conditions always predicted accurately. §What’s in the future? § Looks like milder, average-level precipitation with drought indices moving towards non-drought. § Predicting a steady climb out of drought