Medicaid and Population Health Designing a better system

Medicaid and Population Health: Designing a better system COLLEEN KRAFT, M. D. , FAAP

Presenter Disclosures Consultant/ Speakers bureaus No Disclosures Research funding Principle Investigator for Cincinnati Children’s site CARE Award from Center for Medicare and Medicaid Innovation No disclosures Stock ownership/Corporate boards-employment Off-label uses No disclosures

Learning Objectives • Recognize how the pediatric triple-aim differs from adult models • Understand one model of value-based payment and the effect on both pediatric population health and pediatric practice health

Our work thus far… • Outcomes, Experience, and Value • IOM Dimensions – – – Safe Effective Patient-centered Efficient Timely Equitable Improving the quality of care

Alina was admitted with status asthmatics • Aerosol frequency is weaned in standardized manner • Not likely to experience unnecessary radiography • Risks are assessed, and controller medications started in hospital (project ongoing to minimize cost) • PCP is in the communication loop • Medications are in parents’ hands prior to discharge • Discharged when medically ready • Benefited from a non-traditional home health visit
 Percent of children of eligible getting children")
Encounter performance vs. population performance (Hypothetical Data) Percent of children of eligible getting children a controller on controller medication currently in hospital

Where we are going… The Responsibility for the seen AND unseen

“De-facto” Triple Aim Lower Cost

Pediatric Triple Aim Healthy Child Healthy Adult Optimize Health and Development Reduce High Cost Care

What does addressing social determinants look like for a family? • Third admission for status asthmaticus in 4 weeks • Asthma is set off by fumes in her family’s apartment • Family desperately wants safe housing

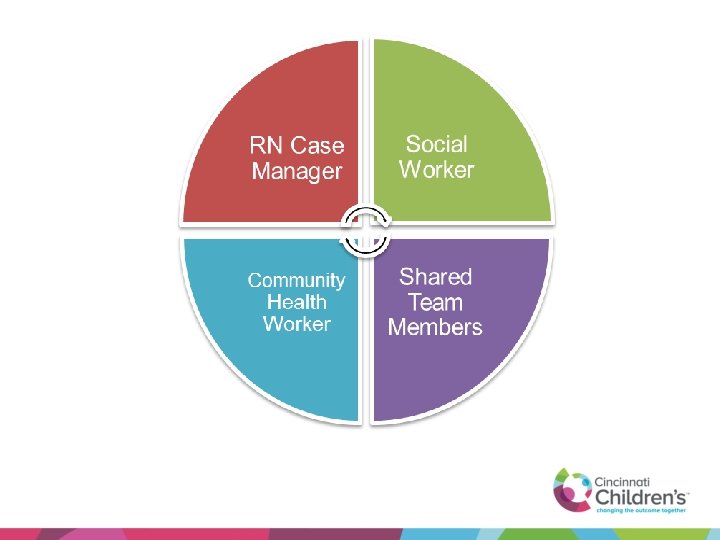
Population Health Principles to individual care • Team Alina – – Inpatient Team Nurse Case Manager Social Worker Family • Medical Legal Partnership • Temporary Housing

How Do Payment Portfolio Models of Risk Support Options Our Work? Encounter-Based Population-Based

Fee For Service Joey in hospital

Risk Model “Allowance” to keep Joey well When Joey Goes to INPT

Health Network by Cincinnati Children’s Experience with an Alternative Payment Model

Health Network by Cincinnati Children’s

Variable Capitation Model HNCC “Variable Capitation” Model • Gain experience with value-based care mode • Allows for innovation pilots • Alignment with primary care

What have we learned? • Risk Stratification with Targeted Population. Level Interventions • Patient Attribution • Measurement of Interventions and Outcomes • Trusted Relationships with Patient/Families and Providers • Intersection of Innovation & Value Based Care

HNCC Population

Alignment with Primary Care • HNCC Network Practices • Pay $2 PMPM for participation • Attribution • Address gaps in care Dr. Farooqi and Ginger, Office Manager at Clermont Pediatrics

Attribution Flow Diagram HNCC PCP Attribution Model Flowchart Most recent 12 -24 months of historical claims 1 analyzed for specialties of Family Practice, FQHC, Internal Medicine, OB/GYN, Pediatrician and RHC With which provider has the member had the most visits? ² Attribute member to this provider 1. 2. Visits defined on separate page. If there is a tie in number of visits the provider with the most recent visit is chosen. No claims for member? Select the MCO assigned PCP

Ap r-1 M 5 ay -1 5 Ju n 15 Ju l-1 Au 5 g 1 Se 5 p 15 O ct -1 N 5 ov -1 D 5 ec -1 5 Ja n 16 Fe b 16 M ar -1 6 Ap r-1 M 6 ay -1 6 Ju n 16 Ju l-1 Au 6 g 16 -1 5 ar 40% 15 15 50% M Fe b- Ja n- PCP Attribution 100% 90% 80% 70% 60% Attribution Model Built 30% 20% 10% 0% HNCC Attribution Percentage CCHMC Attribution %

Every child needs a medical home. Who needs universal interventions and who needs targeted interventions? We need to understand our population. Risk Stratification

Top 1% Cost

Triangle Weighted By Cost

High Risk Case Management • Identify the “highest risk” children in HNCC • Provide intensive, high-contact, care management, care coordination, and help with social needs • Hypothesis: providing this type of case management will be associated with decreased utilization and cost

Population Health Approach and Infant Mortality • Recently moved in with aunt, physical abuse at home • Aunt speaks little English • 17 years old, pregnant, now at 30 weeks • Had a previous child at 26 weeks who died • Had preeclampsia with first pregnancy • Finished up to 7 th grade

Community Level Intervention • Team Estela • • • Estela Adolescent Medicine Nurse Care Manager BH facilitator Social Worker • OB care • Home Visiting • Early Head Start • Positive parenting, will continue for 3 more years • Weekly BP checks • Depression, responded to Home based CBT (Moving Beyond Depression) • Started working on GED • Had a healthy girl at 37 weeks

Member Story • Mother called, “unable to cope” • Social work CM and Behavioral Health Facilitator kept her on the line • Community health worker met her in person, brought her to BH resource

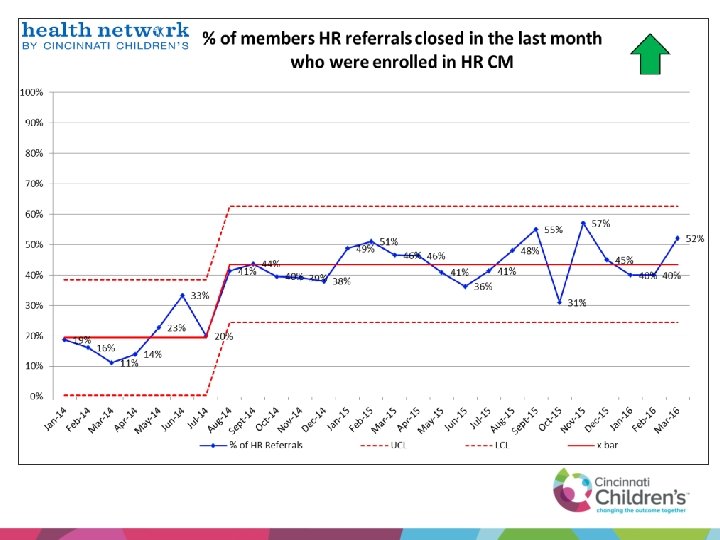
But Does CM Decrease Cost and Utilization? Compared members enrolled in HR CM to those members that were exclusively unable to contact – Intervention group: Any member who was in HRCM on Dec 31, 2014 – Unable to contact group: Any member who was eligible for HRCM at least during the period from Jun 1, 2014 through December 31, 2014 – Compared utilization from July-Dec 2014 to Jan-Jun 2015 ED Visit Admission Reduction $ PMPM Reduction Unable To Contact Group 27% 42% 34% Intervention Group 38% 57% 47% HNCC CM Model Effect -11% -16% -13%

Where is the intersection between innovation and population health?

Utilization Management • Relationship building with primary care • Opportunity to screen for need for care management • Streamlines processes – Preauthorization – Denials/Appeals

Payment for Medical-Legal Partnership • Child He. LP – Co-located in primary care clinics – Family needs addressed and shared with care team – Payment for: • • Housing Benefits School/IEP Domestic Violence

Marcel and Raynisha • Both children with asthma • Apartment with mold, rats • High Duke bill so could not move

Marcel and Raynisha • Duke bill paid • Child He. LP worked to end the lease • Family living in a safe place

Therapy by Telehealth • Speech Therapy • Evaluation face to face • 30 speech therapy sessions delivered via telehealth in the home • Evaluation to include: • Attendance • Achievement toward goals

Has Population Level Utilization changed?

$0. 00 Jul-13 Aug-13 Sep-13 Oct-13 Nov-13 Dec-13 Jan-14 Feb-14 Mar-14 Apr-14 May-14 Jun-14 Jul-14 Aug-14 Sep-14 Oct-14 Nov-14 Dec-14 Jan-15 Feb-15 Mar-15 Apr-15 May-15 Jun-15 Jul-15 Aug-15 Sep-15 Oct-15 Nov-15 Dec-15 Jan-16 Feb-16 Mar-16 Apr-16 May-16 Jun-16 Jul-16 HNCC Cost of Medical Care Medical Claims per Member per Month $250. 00 $200. 00 $150. 00 $100. 00 $50. 00 Note: 95% claims Inc. Mental Health Exc. Total PMPM Allowed 'UCL' 'LCL' 'x-Bar' Goal

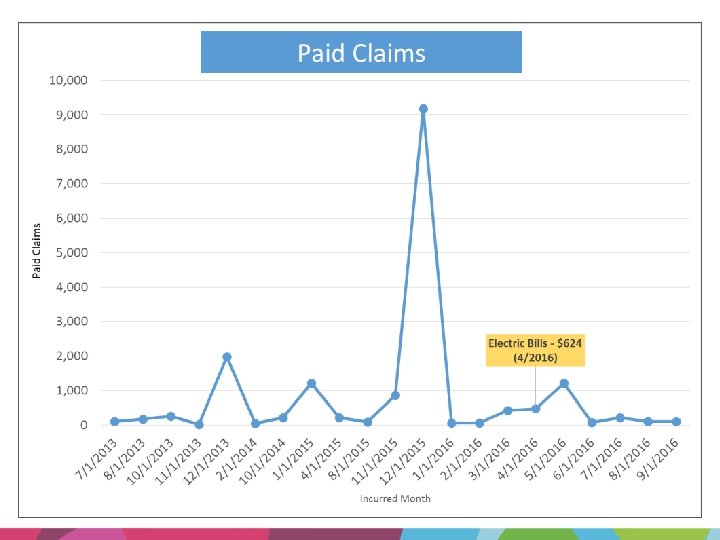
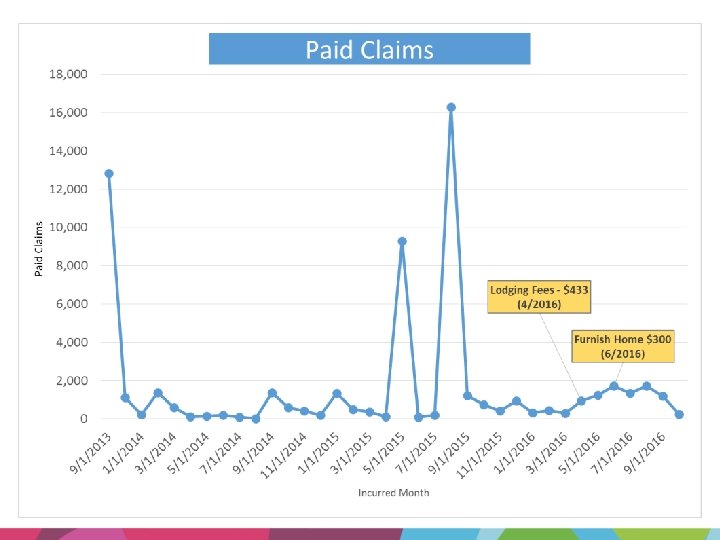
Social Investment Fund • Patients referred through care manager • Committee determines feasibility and sustainability of requests • Clinical/functional outcomes are reviewed monthly

Mariah • Cerebral Palsy • Severe Failure to Thrive • Family homeless, no transportation • Child not receiving needed medical care

Mariah • Paid temporary housing while new housing found • Helped with furnishing • Connected with CM team at PPC • G-tube, follow up weight checks • Child is gaining weight

Questions?

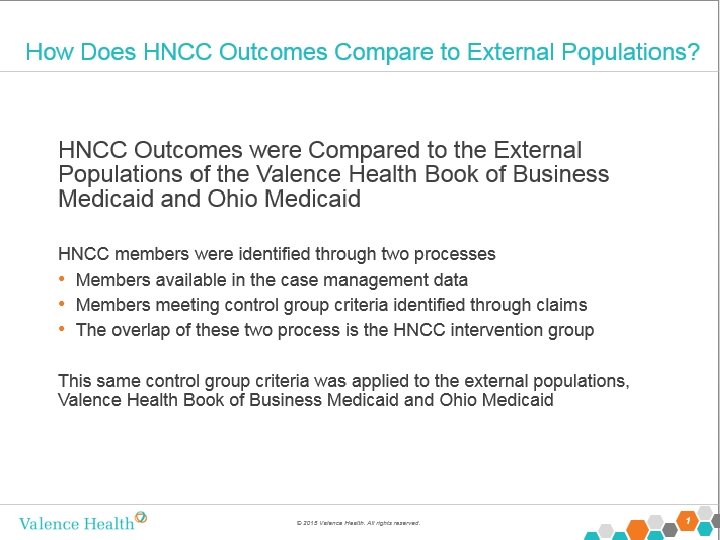
Goal = improved Population Health, Lower Cost • Population = Children with Molina and Paramount Medicaid in SW Ohio • What payment model can affect change?

Targeting Members for CM • 82% of top 1% members had HNCC Case Management • The 14% not in Care Management either declined or UTR • Average time in HNCC HRCM = 9 months

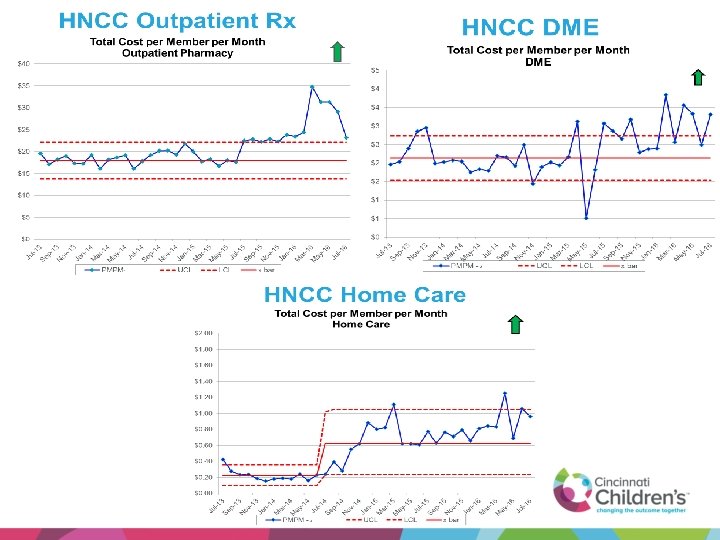
Ju l-1 Se 3 p 1 N 3 ov -1 3 Ja n 1 M 4 ar -1 M 4 ay -1 4 Ju l-1 Se 4 p 1 N 4 ov -1 4 Ja n 1 M 5 ar -1 M 5 ay -1 5 Ju l-1 Se 5 p 1 N 5 ov -1 5 Ja n 1 M 6 ar -1 M 6 ay -1 6 Ju l-1 6 HNCC Outpatient Rx Total Cost per Member per Month Outpatient Pharmacy $40 $35 $30 $25 $20 $15 $10 $5 $0 PMPM-Allowed UCL LCL x bar

Ju l-1 Se 3 p 1 N 3 ov -1 3 Ja n 1 M 4 ar -1 M 4 ay -1 4 Ju l-1 Se 4 p 1 N 4 ov -1 4 Ja n 1 M 5 ar -1 M 5 ay -1 5 Ju l-1 Se 5 p 1 N 5 ov -1 5 Ja n 1 M 6 ar -1 M 6 ay -1 6 Ju l-1 6 HNCC DME $5 Total Cost per Member per Month DME $4 $4 $3 $3 $2 $2 $1 $1 $0 PMPM - Alllowed UCL LCL x bar

HNCC Home Care $2. 00 Total Cost per Member per Month Home Care $1. 80 $1. 60 $1. 40 $1. 20 $1. 00 $0. 80 $0. 60 $0. 40 $0. 20 Ju l-1 Se 3 p 1 N 3 ov -1 3 Ja n 14 M ar -1 M 4 ay -1 4 Ju l-1 Se 4 p 1 N 4 ov -1 4 Ja n 15 M ar -1 M 5 ay -1 5 Ju l-1 Se 5 p 1 N 5 ov -1 5 Ja n 16 M ar -1 M 6 ay -1 6 Ju l-1 6 $0. 00 PMPM - Alllowed UCL LCL x bar

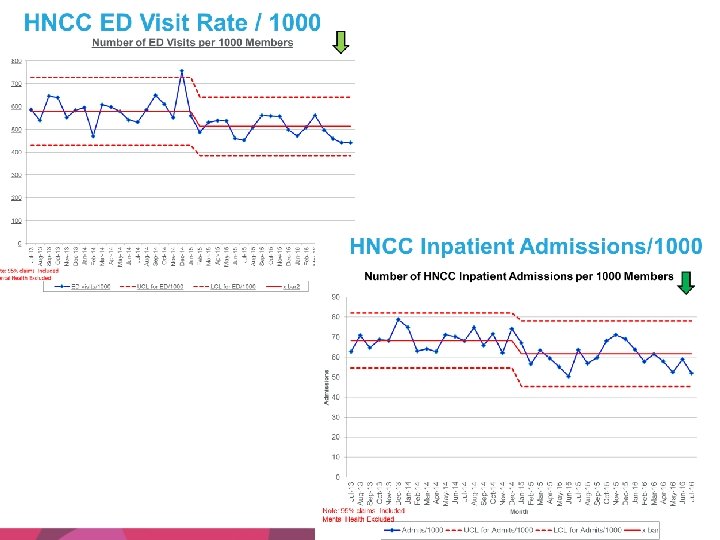
0 Jul-13 Aug-13 Sep-13 Oct-13 Nov-13 Dec-13 Jan-14 Feb-14 Mar-14 Apr-14 May-14 Jun-14 Jul-14 Aug-14 Sep-14 Oct-14 Nov-14 Dec-14 Jan-15 Feb-15 Mar-15 Apr-15 May-15 Jun-15 Jul-15 Aug-15 Sep-15 Oct-15 Nov-15 Dec-15 Jan-16 Feb-16 Mar-16 Apr-16 May-16 Jun-16 Jul-16 HNCC ED Visit Rate / 1000 Number of ED Visits per 1000 Members 800 700 600 500 400 300 200 100 ED visits/1000 UCL for ED/1000 LCL for ED/1000 x bar 2

0 Jul-13 Aug-13 Sep-13 Oct-13 Nov-13 Dec-13 Jan-14 Feb-14 Mar-14 Apr-14 May-14 Jun-14 Jul-14 Aug-14 Sep-14 Oct-14 Nov-14 Dec-14 Jan-15 Feb-15 Mar-15 Apr-15 May-15 Jun-15 Jul-15 Aug-15 Sep-15 Oct-15 Nov-15 Dec-15 Jan-16 Feb-16 Mar-16 Apr-16 May-16 Jun-16 Jul-16 Admissions HNCC Inpatient Admissions/1000 Number of HNCC Inpatient Admissions per 1000 Members 90 80 70 60 50 40 30 20 10 Note: 95% claims Included Mental Health Excluded Admits/1000 Month UCL for Admits/1000 LCL for Admits/1000 x bar
- Slides: 57