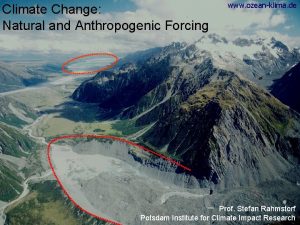
Mechanisms of change External forcing mechanisms concentrated around


- Slides: 20

Mechanisms of change: External forcing mechanisms concentrated around: • Changes in gravitational effects on fluids on earth (e. g. , tides, spring/neap tides (moon circles earth every 29 days)) • Changes in the solar constant (i. e. , solar energy output – e. g. , sunspot cycle) • Changes in the position of earth relative to sun (e. g. , orbital changes, seasons, day-night alternation)

The physical basis of climate and climate modelling: report of the international study conference in Stockholm, 29 July - 10 August 1974 Issue 16 of GARP publications series, Global Atmospheric Research Programme. Joint Organizing Committee, World Meteorological Organization, International Council of Scientific Unions, United Nations Environment Programme

External forcing: a very common effect: tides (N. B. not only these short-term effects, but also an 1, 800 year periodicity – may be important for palaeo-records) University of Southampton

Seasonal cycle, the cycle controlling the greatest periodic energy changes. Itself only rarely resolved in palaeo-records, but it plays a crucial role in precession cycle University of Southampton

First a reminder on what determines the seasonal cycle No tilt ==> No seasons! University of Southampton

Tilt of earth’s axis determines differences in time of exposure to the sun and angle of incidence of sunlight Angle of incidence through the seasons University of Southampton

More sunspots (cool areas) associated with more faculae (or plages), which are hot areas. Hot areas “win”, giving net result of enhanced solar output at times of sunspot maxima Courtesy of NASA: http: //noconsensus. files. wordpress. com/2009/01/raw-plot-of-sunspots. jpg click here for link to original image for the sunspots Sunspot cycle further organised on longer periods (reported: 22, 50+, ~80 years). Most prominent one defines ‘grand minima” - times of persistent low/no sunspot activity that re-occur every ~200 years

Cosmogenic isotopes (e. g. , 14 C and 10 Be) produced by cosmic radiation in upper atmosphere. Elevated solar output ==> more shielding of atmosphere against cosmic radiation ==> lower cosmogenic isotope production Reduced solar output Reproduced figure, Data source is NOAA, GISP 2 ice core A (quasi-)periodical cycle of ~2500 year repeated “grand minima” can be recognised during the last 10, 000 years. We do not know at all how these weak fluctuations in the solar output could have become important in the climate system, but it’s one of the main topics in climatology at the moment.

Astronomical cycles The main energy supply to climate is the solar radiation greenhouse gases merely determine how much of it is retained. Hence, greenhouse studies are only one side of the coin. We need to know how the earth-sun variables affect climate. 1930 s - Serbian engineer Milutin Milankovitch develops the first detailed calculation of impacts on insolation per latitude circle of changes in earth-sun orbital parameters, in a bid to explain the Pleistocene ice ages: • eccentricity (main periods ~ 100, 000 and 400, 000 years) • obliquity (main period of about 41, 000 years) • precession (main periods 19, 000 and 23, 000 years)

University of Southampton

Precession: the “wobble of the spinning top University of Southampton

Precession (‘wobble): main periods of impact on insolation: 19 and 23 kyrs Eccentricity (1 -6%) and precession have a closely interdependent impact on insolation distribution University of Southampton

University of Southampton

The degree of orbital eccentricity “modulates” the impact of precession Courtesy of Cambridge university press: Burroughs, W. J. , 1992, Weather Cycles: Real or Imaginary, Cambridge University Press, Cambridge, U. K. ; New York, U. S. A.

Sea-breeze “model” for monsoon variations University of Southampton

Obliquity or Tilt (varies between 22. 5 and 24. 5 deg) over 41, 000 years Obliquity especially important at high latitudes Strong tilt poles receive more sunlight & sun’s rays reach the polar surface at less shallow angle, decreasing reflection and increasing heat absorption University of Southampton

Orbital parameters can be used to calculate insolation per latitude band, and those insolation records can be compared with relevant observations of climate (proxy) change. This is what Milankovitch pioneered. Alternatively, the orbital parameters can be compared directly with relevant proxy records. In both cases, the orbital parameters (with their well-known variations through time) are used as a template for variability, and proxy records can thus be “dated” using the orbitally controlled variations. This underlies the practice of “orbital tuning” or “astronomical tuning”.

Orbital tuning of timescales 1 Orbital cycles and their timings well understood, and they affect insolation distribution. These variations very similar to observed climate fluctuations ==> calculated timings can be used to fine-tune time-frames of observed variations (records) = “orbital tuning” Reprinted by permission from Macmillan Publishers Ltd: Petit, J. R. , Jouzel, J. , Raynaud, D. , Barkov, N. I. , Barnola, J. M. , Basile, I. , Bender, M. , Chappellaz, J. , Davis, M. , Delaygue, G. , Delmotte, M. , Kotlyakov, V. M. , Legrand, M. , Lipenkov, V. Y. , Lorius, C. , Pepin, L. , Ritz, C. , Saltzman, E. , Stievenard, M. , Climate and atmospheric history of the past 420, 000 years from the Vostok ice core, Antarctica. Nature, v. 399, p. 429 -436. Copyright (1999). Not under CC licence.

d by permission of American Geophysical Union: Hilgen, F. J. , Lourens, L. J. , Berger, A. . , Loutre, M. F. , of the Astronomically Calibrated Time Scale for the Late Pliocene and Earliest Pleistocene ography, v. 8, no. 5, p. 549– 565. October 1993. Copyright [1993] American Geophysical Union. Orbital tuning of timescales 2

Copyright statement • This resource was created by the University of Southampton and released as an open educational resource through the 'C -change in GEES' project exploring the open licensing of climate change and sustainability resources in the Geography, Earth and Environmental Sciences. The C-change in GEES project was funded by HEFCE as part of the JISC/HE Academy UKOER programme and coordinated by the GEES Subject Centre. • This resource is licensed under the terms of the Attribution-Non-Commercial-Share Alike 2. 0 UK: England & Wales license (http: //creativecommons. org/licenses/by-nc-sa/2. 0/uk/). • However the resource, where specified below, contains other 3 rd party materials under their own licenses. The licenses and attributions are outlined below: • The University of Southampton and the National Oceanography Centre, Southampton and its logos are registered trade marks of the University. The University reserves all rights to these items beyond their inclusion in these CC resources. • The JISC logo, the C-change logo and the logo of the Higher Education Academy Subject Centre for the Geography, Earth and Environmental Sciences are licensed under the terms of the Creative Commons Attribution -non-commercial-No Derivative Works 2. 0 UK England & Wales license. All reproductions must comply with the terms of that license. • All content reproduced from copyrighted material of the American Geophysical Union (AGU) are subject to the terms and conditions as published at: http: //www. agu. org/pubs/authors/usage_permissions. shtml AGU content may be reproduced and modified for non-commercial and classroom use only. Any other use requires the prror written permission from AGU. • All content reproduced from Macmillan Publishers Ltd remains the copyright of Macmillan Publishers Ltd. Reproduction of copyrighted material is permitted for noncommercial personal and/or classroom use only. Any other use requires the prior written permission of Macmillan Publishers Ltd
 Troisième couleur forcing
 No stem curl
 Importance of vegetable farming in points
 Differential equations with discontinuous forcing functions
 Differential equations with discontinuous forcing functions
 Radiative forcing definition
 Discontinuous forcing functions
 Internal service delivery mechanisms
 What goes around comes around example
 Goes around comes around meaning
 External-external trips
 Electrolysis of copper sulphate products
 Xultopy
 Market segmentation targeting and positioning of coca cola
 Dilute and concentrated solutions
 The most concentrated energy source in the body is
 Bill nye reflection and refraction
 Dilute and concentrated
 Monteverdi orfeo youtube
 Concentrated marketing
 Geographically concentrated buyers


