Mechanical and Electrical Events of the Cardiac Cycle


![Mechanical Events of the Cardiac Cycle Ventricular Filling Period [ventricular diastole, atrial systole] 2.](https://slidetodoc.com/presentation_image_h2/7bd02dec79742395509ef3a7881c4ac1/image-3.jpg "Mechanical Events of the Cardiac Cycle Ventricular Filling Period [ventricular diastole, atrial systole] 2.")


 node is the normal pacemaker of")


- Slides: 41
Mechanical and Electrical Events of the Cardiac Cycle PEP 3510: Exercise Physiology PEP 4370: Exercise Management for Special Populations
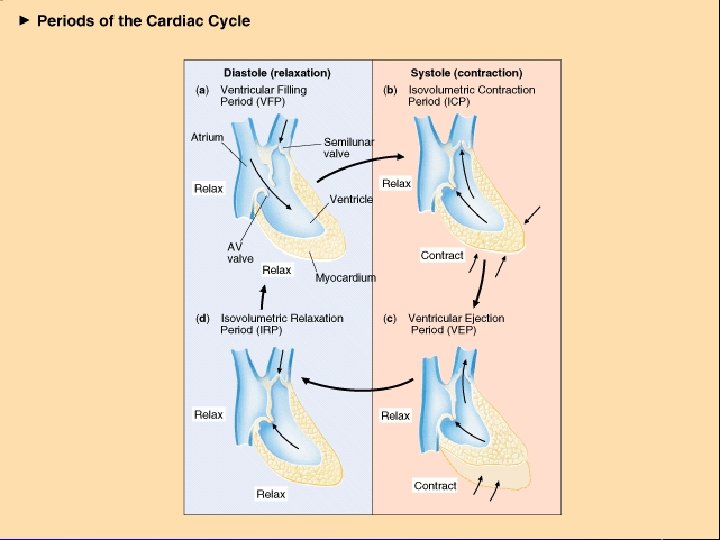
Cardiac Cycle: the electrical, pressure and volume changes that occur in a functional heart between successive heart beats. • Phase of the cardiac cycle when myocardium is relaxed is termed diastole. • Phase of the cardiac cycle when the myocardium contracts is termed systole. – Atrial systole: when atria contract. – Ventricular systole: when ventricles contract.
Mechanical Events of the Cardiac Cycle Ventricular Filling Period [ventricular diastole, atrial systole] 2. Isovolumetric Contraction Period [ventricular systole] 3. Ventricular Ejection Period [ventricular systole] 4. Isovolumetric Relaxation Period [ventricular diastole, atrial diastole] 1.
Cardiac Cycle l Electrical changes in heart tissue cause mechanical changes, i. e. muscle contraction. l Thus, changes in electrical membrane potential of specific parts of the heart tissue represent mechanical events in specific areas of the heart tissue.
Electrocardiography l Two common abbreviations for electrocardiogram: EKG and ECG. l EKG comes from German language where cardiogram is written as kardiogram. l The ECG records the electrical activity of the heart. l Mechanical activity of the heart is sensed by echocardiography.
Electrocardiography ECG - electrocardiogram – graphic recording of electrical events – established electrode pattern results in specific tracing pattern – electrical pattern reveals blood supply problems
Electrophysiology l If an electrode is placed so that wave of depolarization spreads toward the recording electrode, the ECG records a positive (upward) deflection. l If wave of depolarization spreads away from recording electrode, a negative (downward) deflection occurs.
Electrophysiology
Electrophysiology
Electrophysiology
Electrophysiology l When myocardial muscle is completely polarized or depolarized, the ECG will not record any electrical potential but rather a flat line, isoelectric line. l After depolarization, myocardial cells undergo repolarization to return to electrical state at rest.
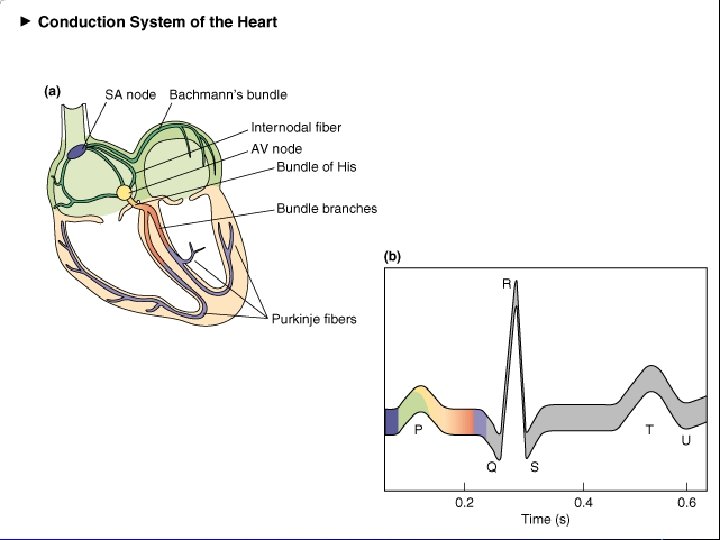
Electrical Events of the Cardiac Cycle Sinoatrial (SA) node is the normal pacemaker of heart and is located in right atrium. • Depolarization spreads from SA node across atria and results in the P wave. • Three tracts within atria conduct depolarization to atrioventricular (AV) node. • • Conduction slows in AV node to allow atria to empty blood into ventricles before vent. systole. Bundle of His connects AV to bundle branches. • Purkinje fibers are terminal bundle branches. •
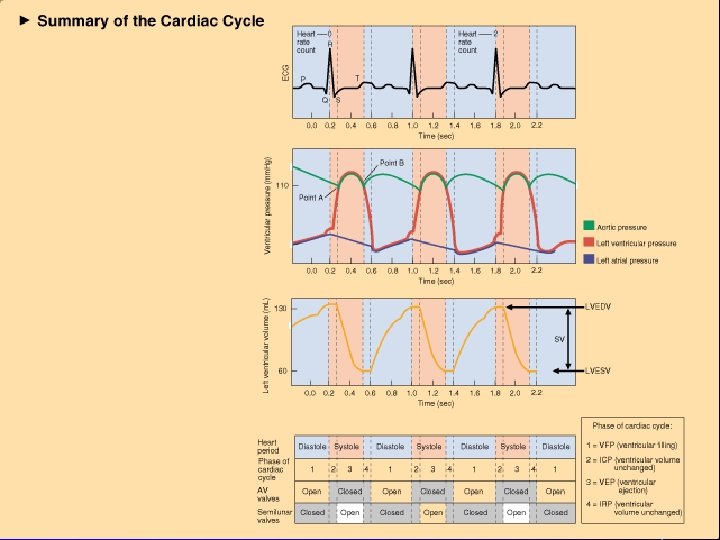
Cardiac Cycle Coordination of : l Electrical Changes l Pressure Changes in Left Atria, Left Ventricle and Aorta l Ventricular Volume Changes l Cardiac Valves
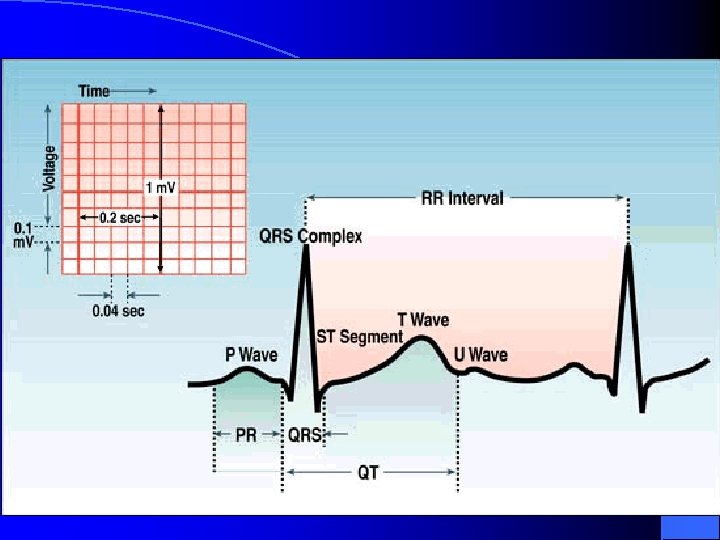
ECG Time & Voltage • • • ECG machines can run at 50 or 25 mm/sec. Major grid lines are 5 mm apart; at standard 25 mm/s, 5 mm corresponds to. 20 seconds. Minor lines are 1 mm apart; at standard 25 mm/s, 1 mm corresponds to. 04 seconds. Voltage is measured on vertical axis. Standard calibration is 0. 1 m. V per mm of deflection.
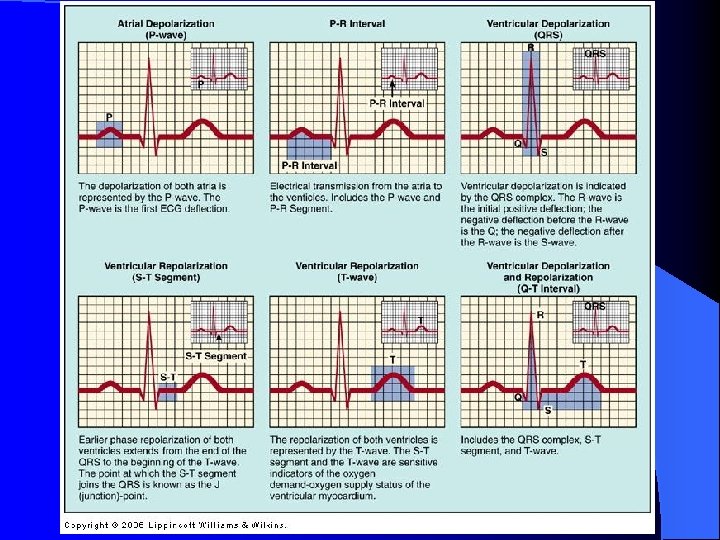
Basic Electrographic Complexes • • • P wave represents depolarization of atria which causes atrial contraction Repolarization of atria not normally detectable on an ECG Excitation of bundle of His and bundle branches occur in middle of PR interval QRS complex reflects depolarization of ventricles T wave reflects repolarization of muscle fibers in ventricles
Electrocardiogram l l l Normal P wave has amplitude of ≤ 0. 25 m. V Q wave is first downward deflection after P wave; signals start of ventricular depolarization R wave is positive deflection after Q wave S wave is negative deflection preceded by Q or R waves T wave follows QRS
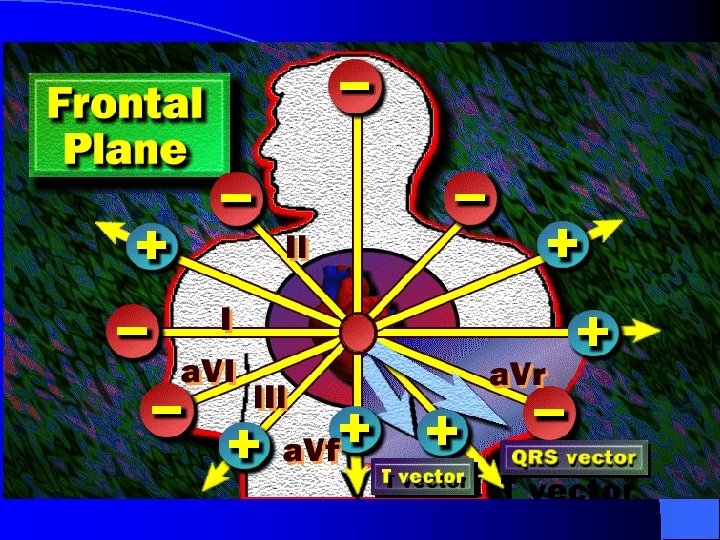
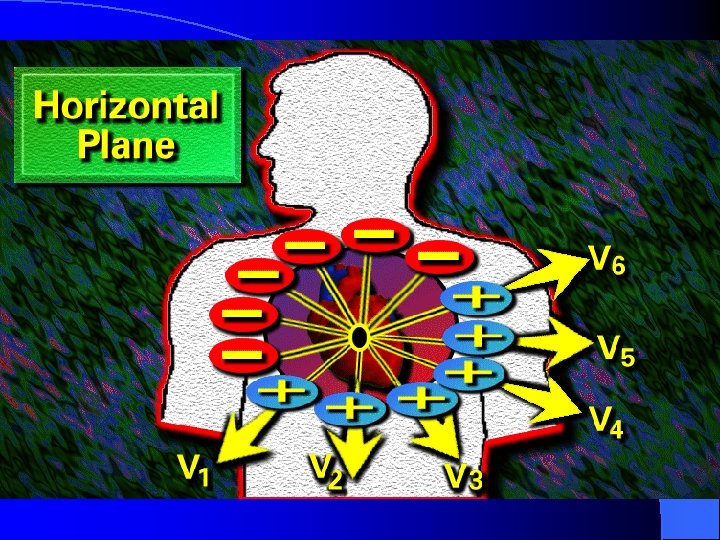
Standard 12 -Lead ECG l Usually performed when person is resting in supine position. l Composed of three bipolar limb leads: I, II, and III; three augmented voltage leads: a. VR, a. VL, a. VF; and six chest or precordial leads: V 1 – V 6. l All limb leads lie in frontal plane. l Chest leads circle heart in transverse plane.
ECG Limb Leads
ECG Augmented Limb Leads
ECG Precordial Leads
Standard 12 -Lead ECG Each lead provides a different electrical angle or picture of the heart. l Anterior part of heart by looking at V 1 – V 4. l Lateral view of heart: I, a. VL, V 5 and V 6. l Inferior view of heart: II, III, and a. VF. l
Exercise 12 -Lead ECG
12 -Lead ECG Limb lead II shows large R amplitude because left ventricle current vector lies parallel with electrode placement. l Chest lead V 1 has large S wave because left ventricle current vector is directed away from electrode. l
12 -Lead ECG Strip
Interpretation of ECG: Rate First measurement to calculate is heart rate. PQRST waves represent one complete cardiac cycle. 1. At standard paper speed, divide 1500 by distance between R to R waves. 2. Find R wave on heavy line. Count off 300, 150, 100, 75, 60 for each following line. Where next R lands is quick estimate. 3. Multiply number of cycles in 6 second marks by 10.
Interpretation of ECG: Rate
Interpretation of ECG: Rhythm Normal heart rhythm has consistent R-R interval. • Mild variations due to breathing also normal. •
Interpretation of ECG: Rhythm Normal Sinus Rhythm • • • Rate: 60 -100 b/min Rhythm: regular P waves: upright in leads I, II, a. VF PR interval: <. 20 s QRS: <. 10 s Sinus Bradycardia Rate: < 60 bpm • Rhythm: regular • Sinus Tachycardia • Rate: > 100 bpm
AV Conduction Disturbances o Atrioventricular conduction disturbances refer to blockage of electrical impulse at AV node. o 1 st degree P waves result in delayed QRS. o 2 nd degree some but not all P waves have QRS.
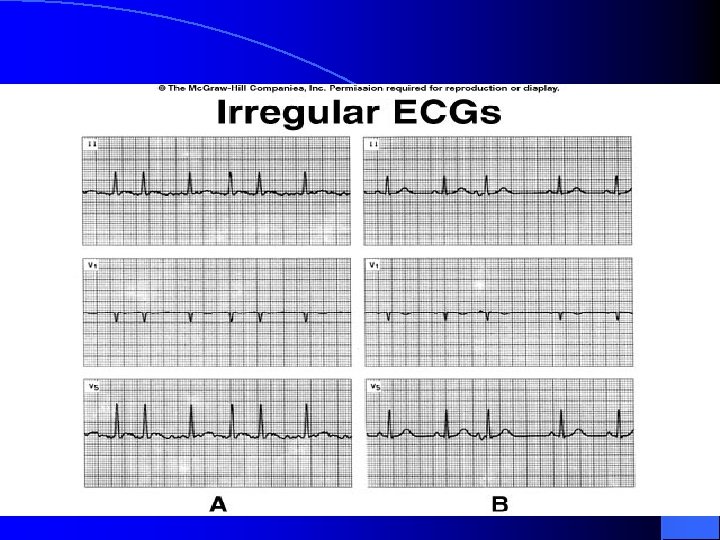
Arrhythmias Arrhythmia: an irregular heartbeat. Sinus arrhythmia- P wave precedes @ QRS but RR interval varies. • Premature Atrial Contraction (PAC) • Premature Ventricular Contraction (PVC) •
Arrhythmias
Myocardial Ischemia ST segment depression. • Hallmark of myocardial ischemia. • Reduction of oxygen-rich blood supply alters normal cellular action causing ST segment displacement ≥ 1 mm below line. • Upsloping, horizontal, downsloping
Illustration References l Mc. Ardle, Katch, Katch. 2000. Essentials of Exercise Physiology Image Collection, 2 nd ed. Lippincott Williams & Wilkins l Foss and Keteyian. 1998. Physiological Basis for Exercise and Sport, 6 th ed. WCB Mc. Graw-Hill. l Robergs and Keteyian. 2003. Fundamentals of Exercise Physiology, 2 nd ed. Mc. Graw. Hill.