
MECH 373 Instrumentation and Measurements Lecture 5 Course
- Slides: 24
MECH 373 Instrumentation and Measurements Lecture 5 (Course Website: Access from your “My Concordia” portal) Measurement Systems with Electrical Signals (Chapter 3) • Electrical signal measurement systems • Signal conditioners Amplification Attenuation Filtering Lecture 5 Lecture Notes on MECH 373 – Instrumentation and Measurements 1
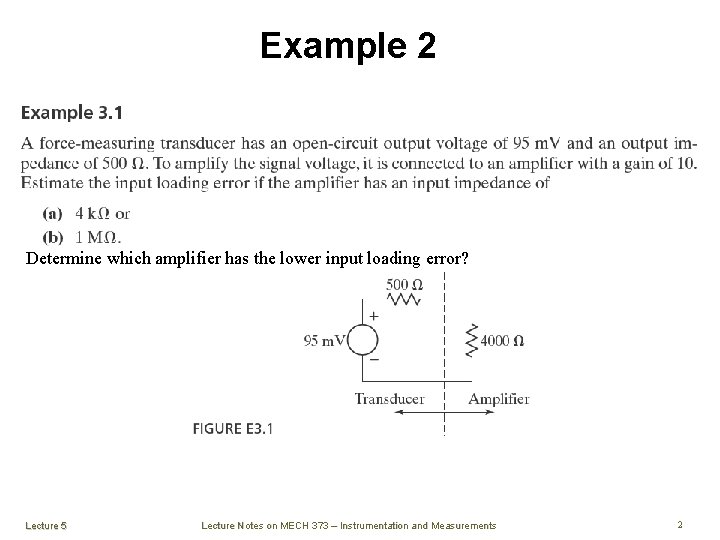
Example 2 Determine which amplifier has the lower input loading error? Lecture 5 Lecture Notes on MECH 373 – Instrumentation and Measurements 2
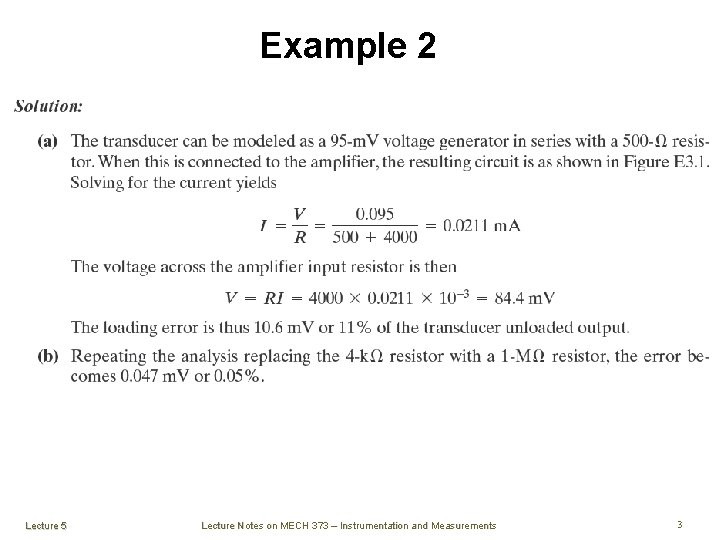
Example 2 Lecture 5 Lecture Notes on MECH 373 – Instrumentation and Measurements 3
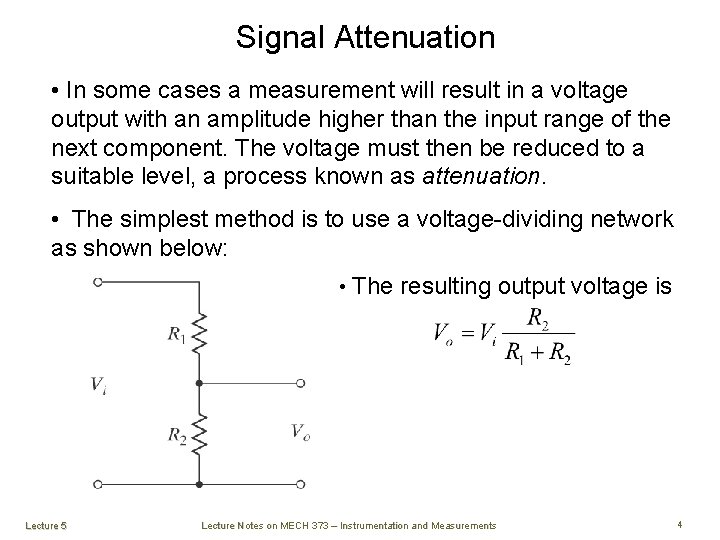
Signal Attenuation • In some cases a measurement will result in a voltage output with an amplitude higher than the input range of the next component. The voltage must then be reduced to a suitable level, a process known as attenuation. • The simplest method is to use a voltage-dividing network as shown below: • The resulting output voltage is Lecture 5 Lecture Notes on MECH 373 – Instrumentation and Measurements 4
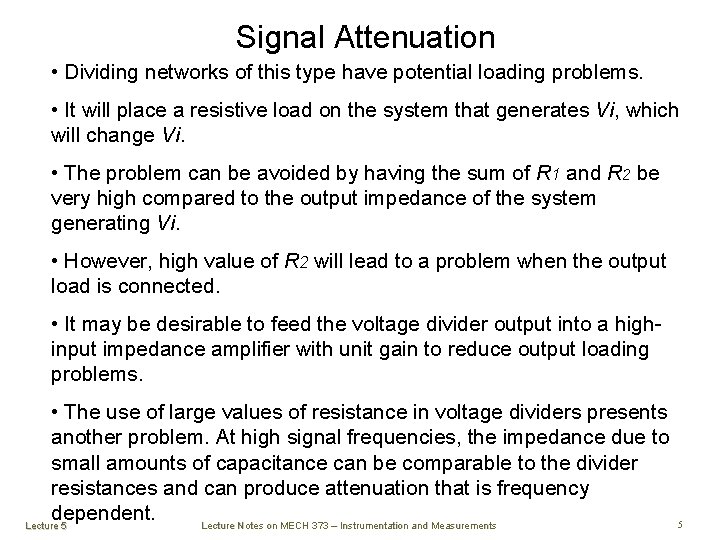
Signal Attenuation • Dividing networks of this type have potential loading problems. • It will place a resistive load on the system that generates Vi, which will change Vi. • The problem can be avoided by having the sum of R 1 and R 2 be very high compared to the output impedance of the system generating Vi. • However, high value of R 2 will lead to a problem when the output load is connected. • It may be desirable to feed the voltage divider output into a highinput impedance amplifier with unit gain to reduce output loading problems. • The use of large values of resistance in voltage dividers presents another problem. At high signal frequencies, the impedance due to small amounts of capacitance can be comparable to the divider resistances and can produce attenuation that is frequency dependent. Lecture Notes on MECH 373 – Instrumentation and Measurements Lecture 5 5
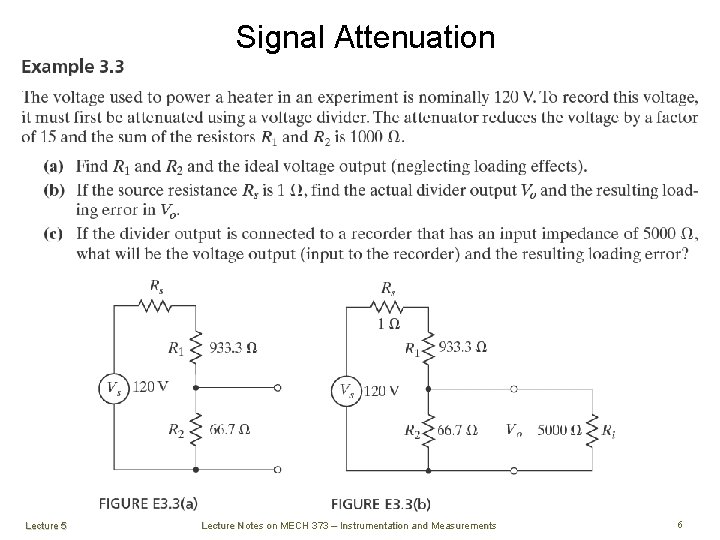
Signal Attenuation Lecture 5 Lecture Notes on MECH 373 – Instrumentation and Measurements 6
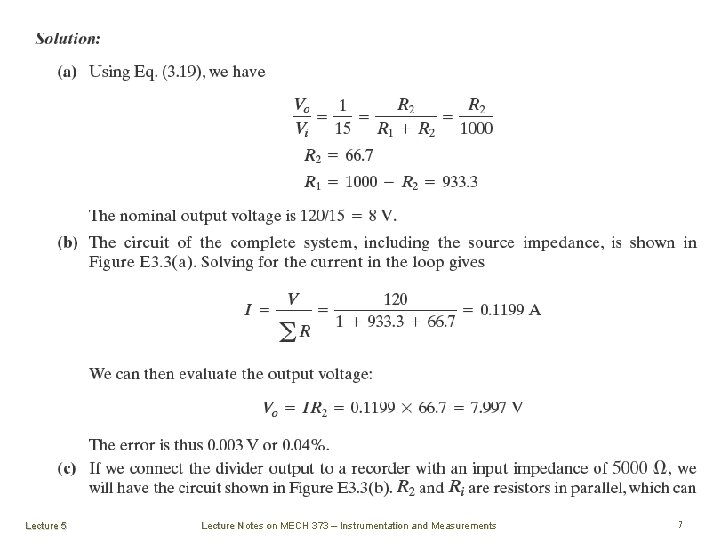
Lecture 5 Lecture Notes on MECH 373 – Instrumentation and Measurements 7
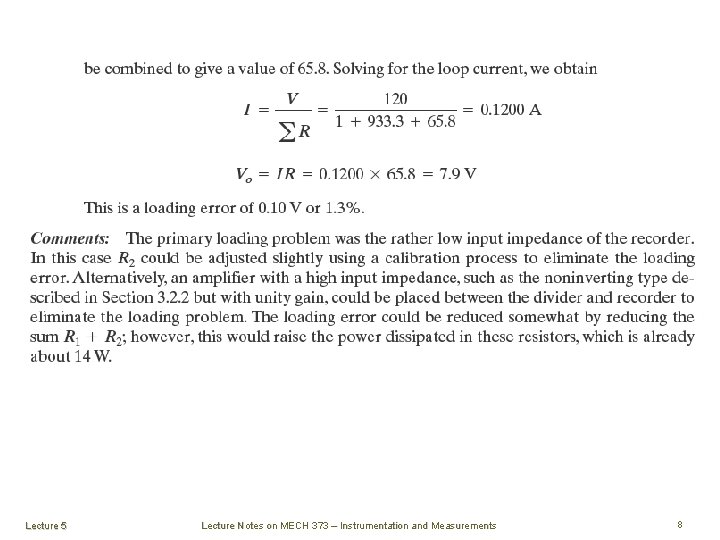
Lecture 5 Lecture Notes on MECH 373 – Instrumentation and Measurements 8
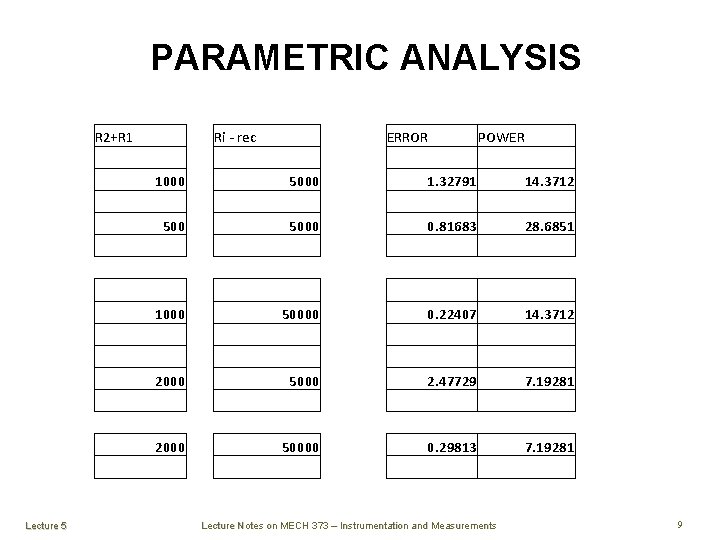
PARAMETRIC ANALYSIS R 2+R 1 Ri - rec ERROR POWER 1. 32791 14. 3712 0. 81683 28. 6851 1000 500 5000 1000 50000 2000 Lecture 5 0. 22407 5000 2000 14. 3712 2. 47729 50000 7. 19281 0. 29813 7. 19281 Lecture Notes on MECH 373 – Instrumentation and Measurements 9
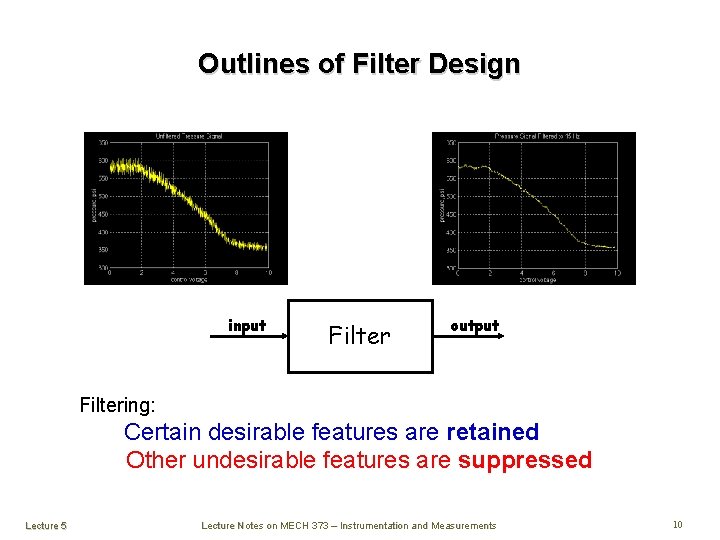
Outlines of Filter Design input Filter output Filtering: Certain desirable features are retained Other undesirable features are suppressed Lecture 5 Lecture Notes on MECH 373 – Instrumentation and Measurements 10
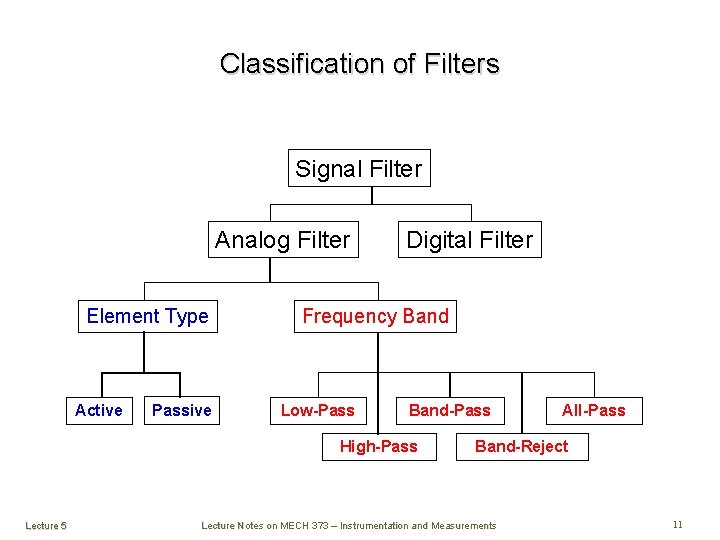
Classification of Filters Signal Filter Analog Filter Element Type Active Passive Digital Filter Frequency Band Low-Pass Band-Pass High-Pass Lecture 5 All-Pass Band-Reject Lecture Notes on MECH 373 – Instrumentation and Measurements 11
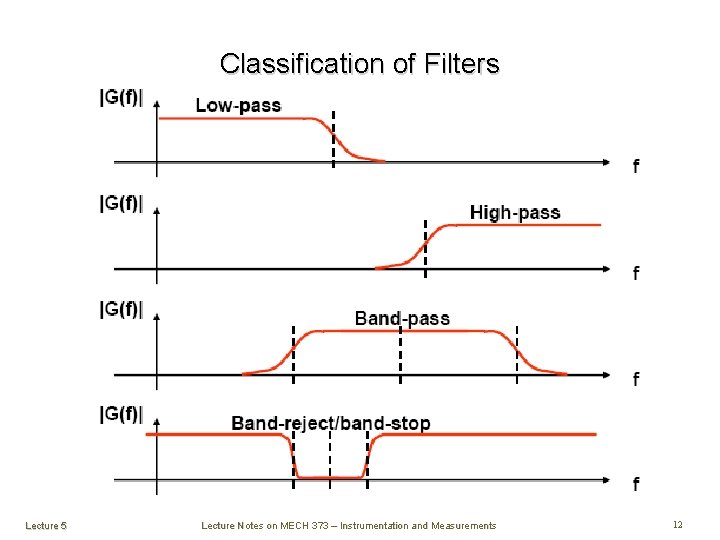
Classification of Filters Lecture 5 Lecture Notes on MECH 373 – Instrumentation and Measurements 12
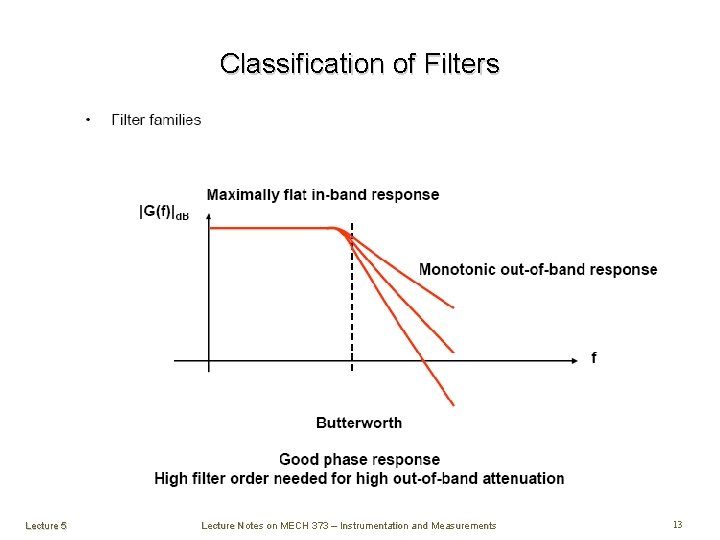
Classification of Filters Lecture 5 Lecture Notes on MECH 373 – Instrumentation and Measurements 13
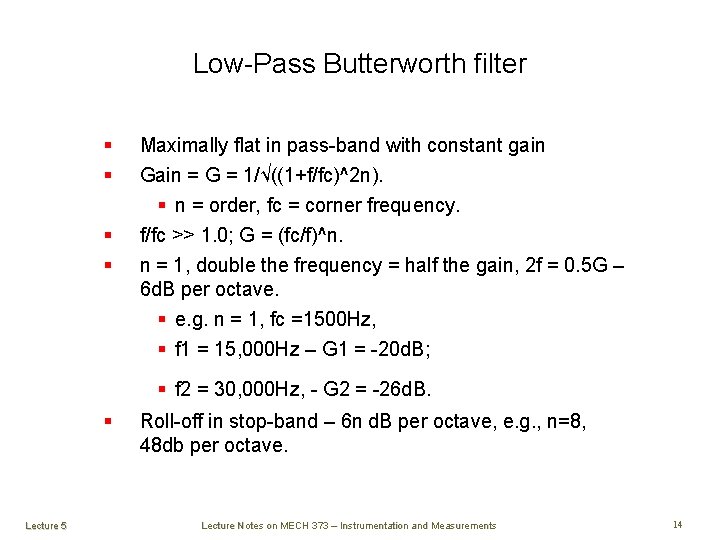
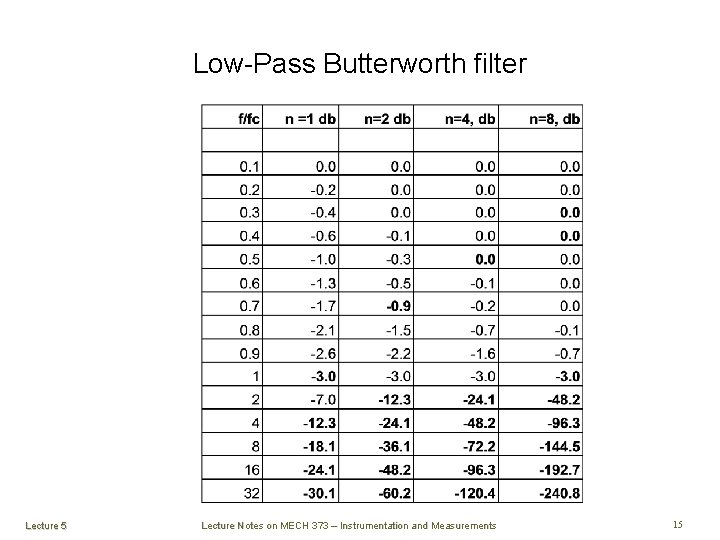
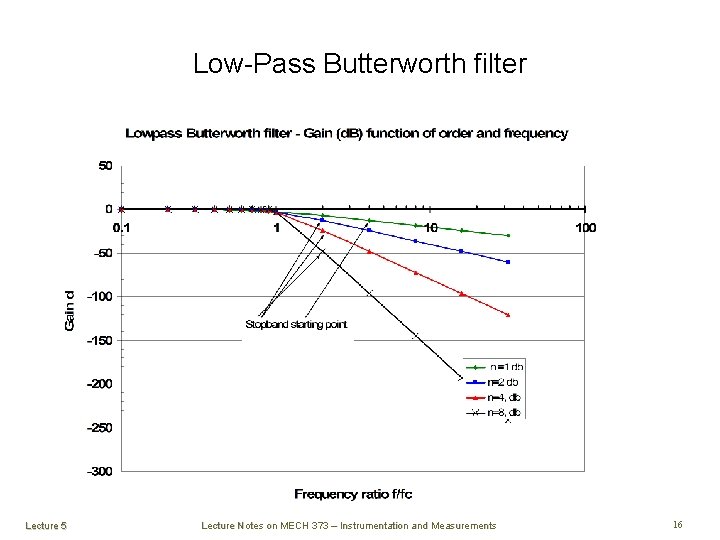
Low-Pass Butterworth filter § § Maximally flat in pass-band with constant gain Gain = G = 1/√((1+f/fc)^2 n). § n = order, fc = corner frequency. f/fc >> 1. 0; G = (fc/f)^n. n = 1, double the frequency = half the gain, 2 f = 0. 5 G – 6 d. B per octave. § e. g. n = 1, fc =1500 Hz, § f 1 = 15, 000 Hz – G 1 = -20 d. B; § f 2 = 30, 000 Hz, - G 2 = -26 d. B. § Lecture 5 Roll-off in stop-band – 6 n d. B per octave, e. g. , n=8, 48 db per octave. Lecture Notes on MECH 373 – Instrumentation and Measurements 14
Low-Pass Butterworth filter Lecture 5 Lecture Notes on MECH 373 – Instrumentation and Measurements 15
Low-Pass Butterworth filter § Lecture 5 Lecture Notes on MECH 373 – Instrumentation and Measurements 16
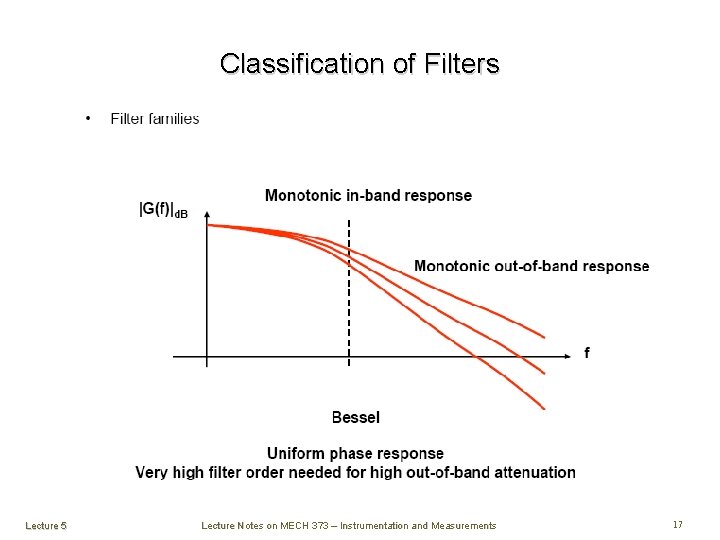
Classification of Filters Lecture 5 Lecture Notes on MECH 373 – Instrumentation and Measurements 17
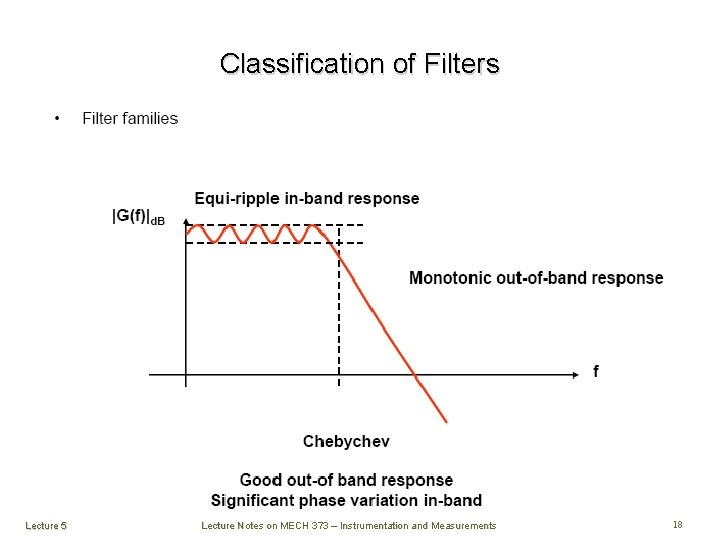
Classification of Filters Lecture 5 Lecture Notes on MECH 373 – Instrumentation and Measurements 18
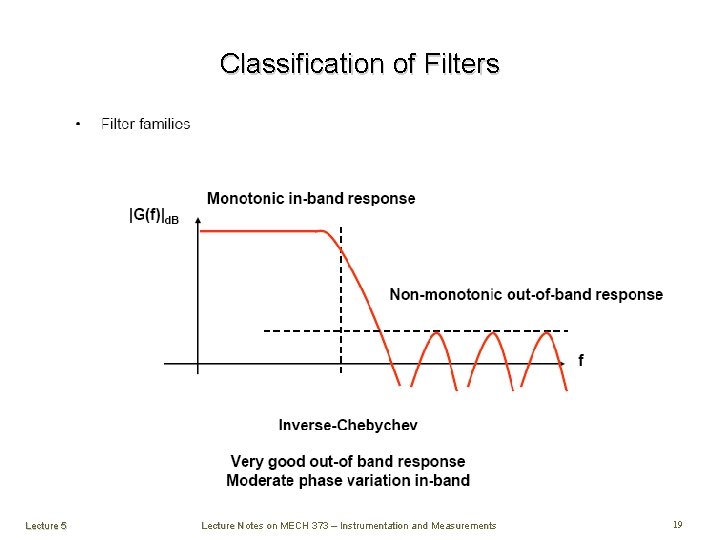
Classification of Filters Lecture 5 Lecture Notes on MECH 373 – Instrumentation and Measurements 19
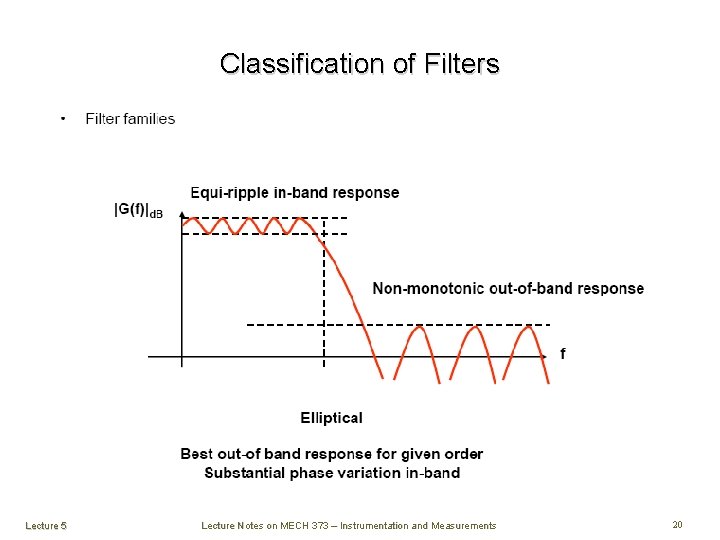
Classification of Filters Lecture 5 Lecture Notes on MECH 373 – Instrumentation and Measurements 20
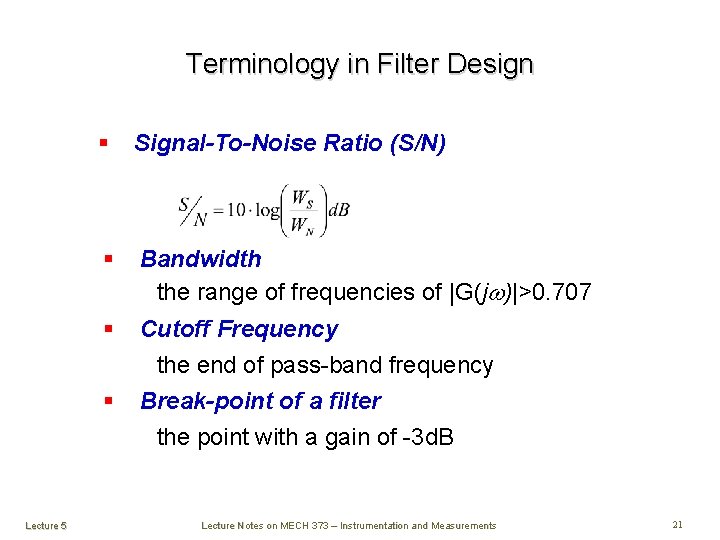
Terminology in Filter Design § Signal-To-Noise Ratio (S/N) § Bandwidth the range of frequencies of |G(jw)|>0. 707 § Cutoff Frequency the end of pass-band frequency Break-point of a filter the point with a gain of -3 d. B § Lecture 5 Lecture Notes on MECH 373 – Instrumentation and Measurements 21
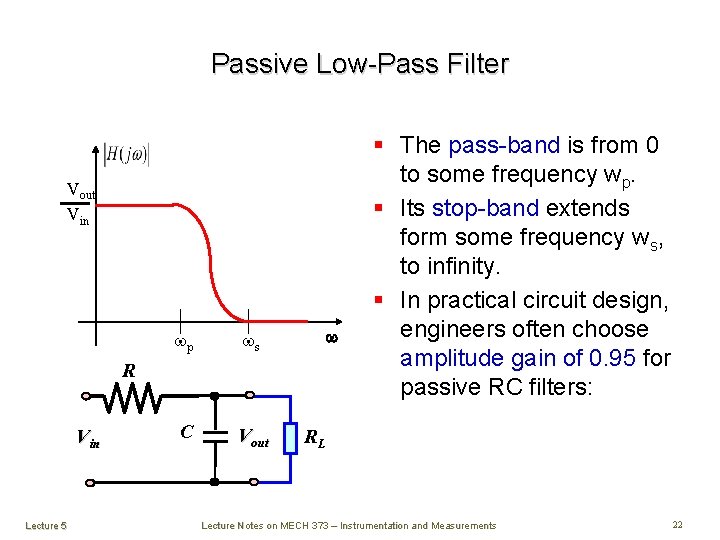
Passive Low-Pass Filter Vout Vin wp ws C Vout w R Vin Lecture 5 § The pass-band is from 0 to some frequency wp. § Its stop-band extends form some frequency ws, to infinity. § In practical circuit design, engineers often choose amplitude gain of 0. 95 for passive RC filters: RL Lecture Notes on MECH 373 – Instrumentation and Measurements 22
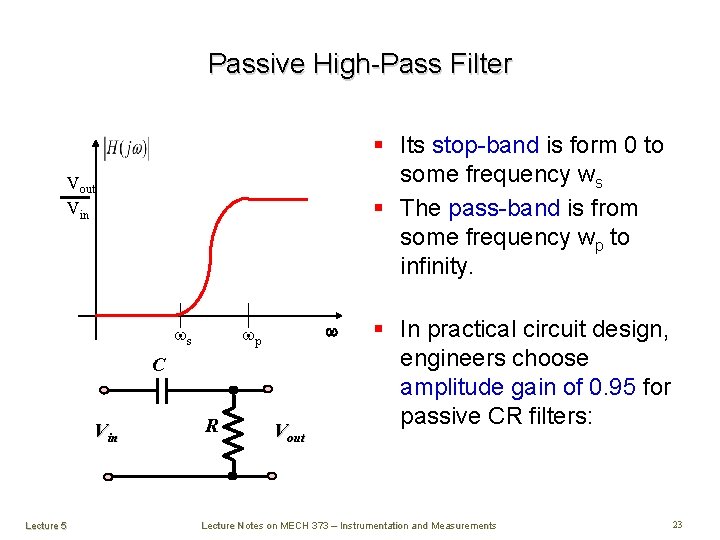
Passive High-Pass Filter § Its stop-band is form 0 to some frequency ws § The pass-band is from some frequency wp to infinity. Vout Vin ws w wp C Vin Lecture 5 R Vout § In practical circuit design, engineers choose amplitude gain of 0. 95 for passive CR filters: Lecture Notes on MECH 373 – Instrumentation and Measurements 23
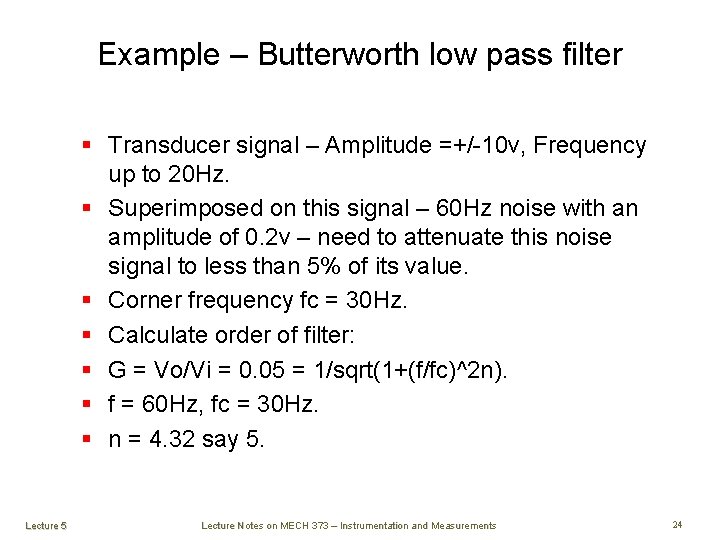
Example – Butterworth low pass filter § Transducer signal – Amplitude =+/-10 v, Frequency up to 20 Hz. § Superimposed on this signal – 60 Hz noise with an amplitude of 0. 2 v – need to attenuate this noise signal to less than 5% of its value. § Corner frequency fc = 30 Hz. § Calculate order of filter: § G = Vo/Vi = 0. 05 = 1/sqrt(1+(f/fc)^2 n). § f = 60 Hz, fc = 30 Hz. § n = 4. 32 say 5. Lecture 5 Lecture Notes on MECH 373 – Instrumentation and Measurements 24