
MECE 5005 Fluid Power Dynamics L 5 cr


- Slides: 46
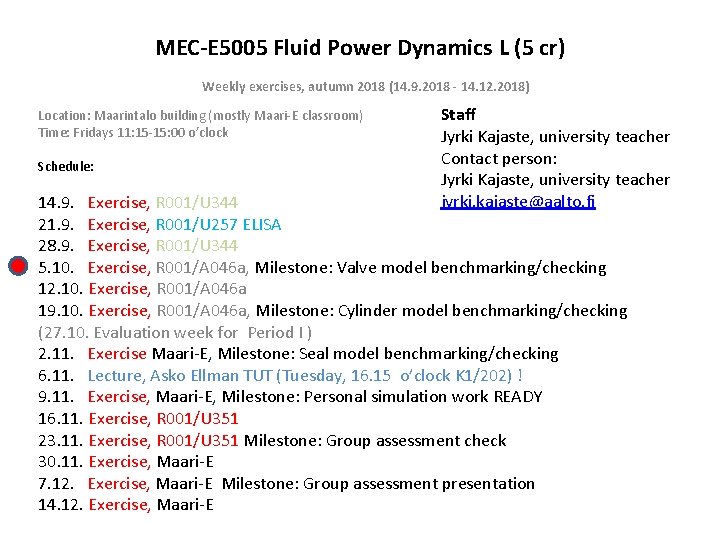
MEC-E 5005 Fluid Power Dynamics L (5 cr) Weekly exercises, autumn 2018 (14. 9. 2018 - 14. 12. 2018) Location: Maarintalo building (mostly Maari-E classroom) Time: Fridays 11: 15 -15: 00 o’clock Schedule: Staff Jyrki Kajaste, university teacher Contact person: Jyrki Kajaste, university teacher jyrki. kajaste@aalto. fi 14. 9. Exercise, R 001/U 344 21. 9. Exercise, R 001/U 257 ELISA 28. 9. Exercise, R 001/U 344 5. 10. Exercise, R 001/A 046 a, Milestone: Valve model benchmarking/checking 12. 10. Exercise, R 001/A 046 a 19. 10. Exercise, R 001/A 046 a, Milestone: Cylinder model benchmarking/checking (27. 10. Evaluation week for Period I ) 2. 11. Exercise Maari-E, Milestone: Seal model benchmarking/checking 6. 11. Lecture, Asko Ellman TUT (Tuesday, 16. 15 o’clock K 1/202) ! 9. 11. Exercise, Maari-E, Milestone: Personal simulation work READY 16. 11. Exercise, R 001/U 351 23. 11. Exercise, R 001/U 351 Milestone: Group assessment check 30. 11. Exercise, Maari-E 7. 12. Exercise, Maari-E Milestone: Group assessment presentation 14. 12. Exercise, Maari-E
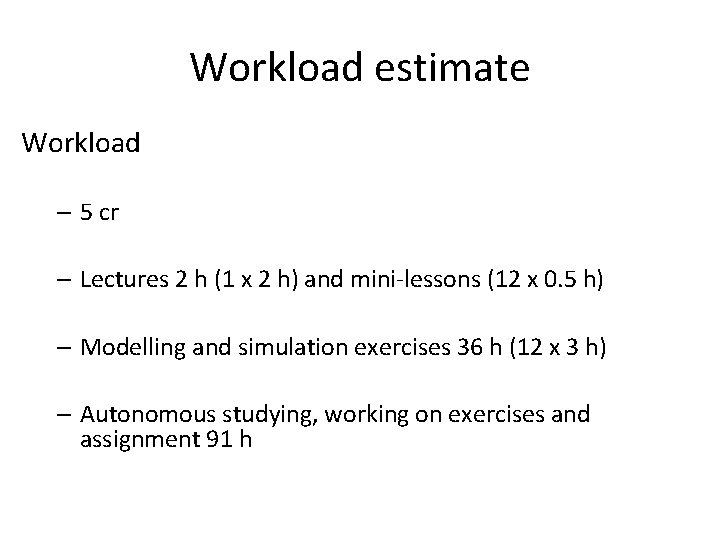
Workload estimate Workload – 5 cr – Lectures 2 h (1 x 2 h) and mini-lessons (12 x 0. 5 h) – Modelling and simulation exercises 36 h (12 x 3 h) – Autonomous studying, working on exercises and assignment 91 h
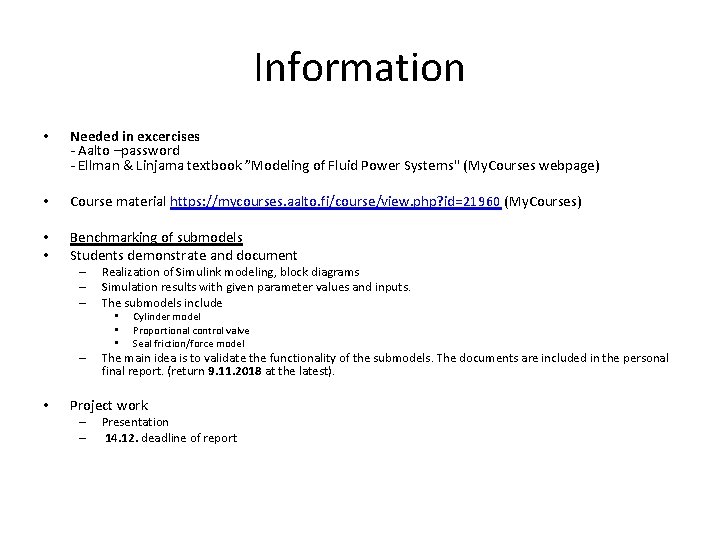
Information • Needed in excercises - Aalto –password - Ellman & Linjama textbook ”Modeling of Fluid Power Systems" (My. Courses webpage) • Course material https: //mycourses. aalto. fi/course/view. php? id=21960 (My. Courses) • • Benchmarking of submodels Students demonstrate and document – – – Realization of Simulink modeling, block diagrams Simulation results with given parameter values and inputs. The submodels include • • • – • Cylinder model Proportional control valve Seal friction/force model The main idea is to validate the functionality of the submodels. The documents are included in the personal final report. (return 9. 11. 2018 at the latest). Project work – – Presentation 14. 12. deadline of report
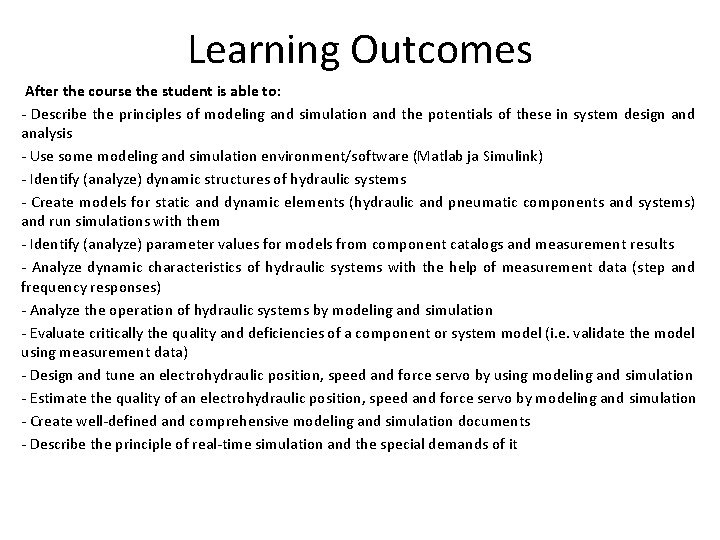
Learning Outcomes After the course the student is able to: - Describe the principles of modeling and simulation and the potentials of these in system design and analysis - Use some modeling and simulation environment/software (Matlab ja Simulink) - Identify (analyze) dynamic structures of hydraulic systems - Create models for static and dynamic elements (hydraulic and pneumatic components and systems) and run simulations with them - Identify (analyze) parameter values for models from component catalogs and measurement results - Analyze dynamic characteristics of hydraulic systems with the help of measurement data (step and frequency responses) - Analyze the operation of hydraulic systems by modeling and simulation - Evaluate critically the quality and deficiencies of a component or system model (i. e. validate the model using measurement data) - Design and tune an electrohydraulic position, speed and force servo by using modeling and simulation - Estimate the quality of an electrohydraulic position, speed and force servo by modeling and simulation - Create well-defined and comprehensive modeling and simulation documents - Describe the principle of real-time simulation and the special demands of it
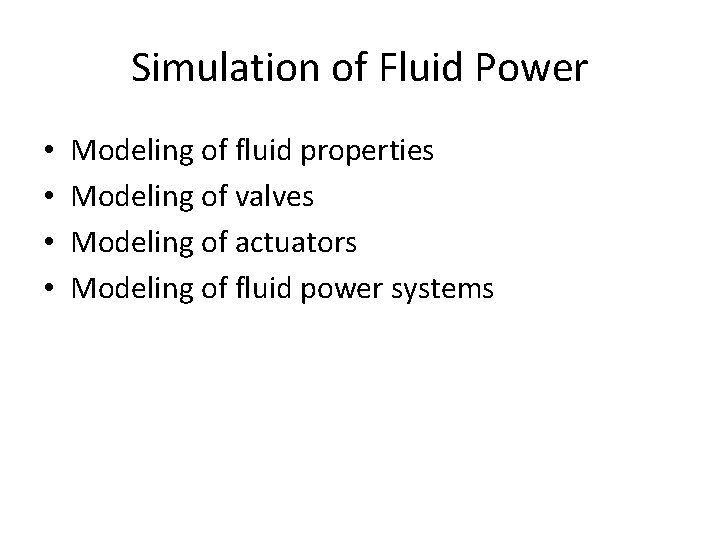
Simulation of Fluid Power • • Modeling of fluid properties Modeling of valves Modeling of actuators Modeling of fluid power systems
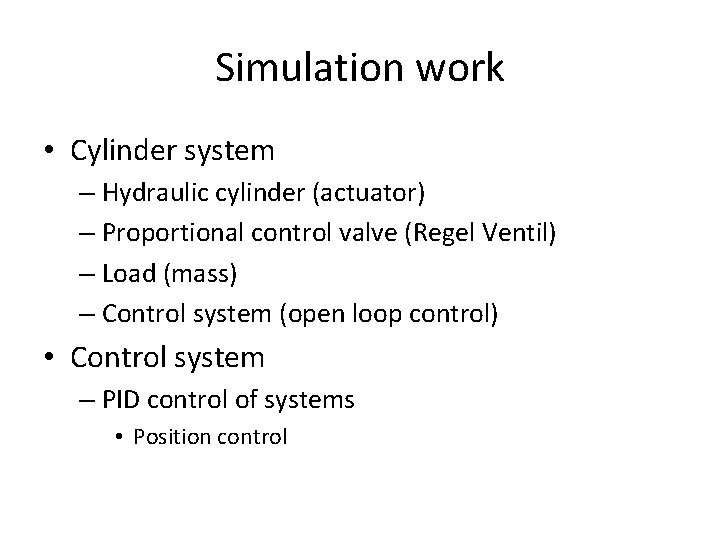
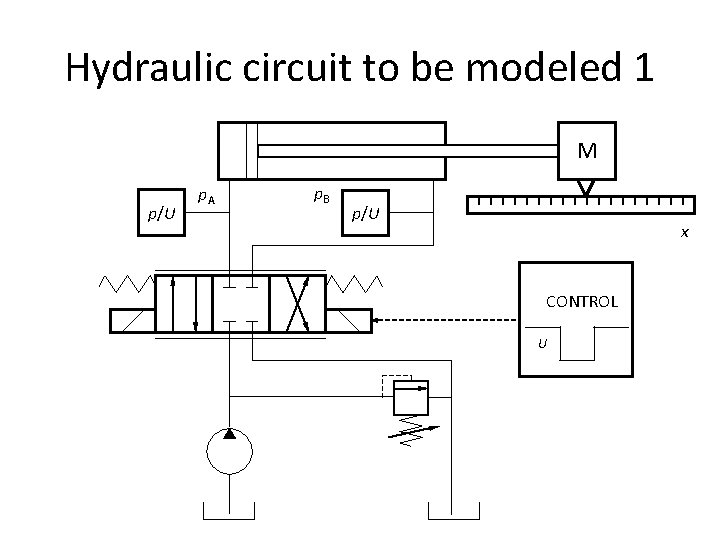
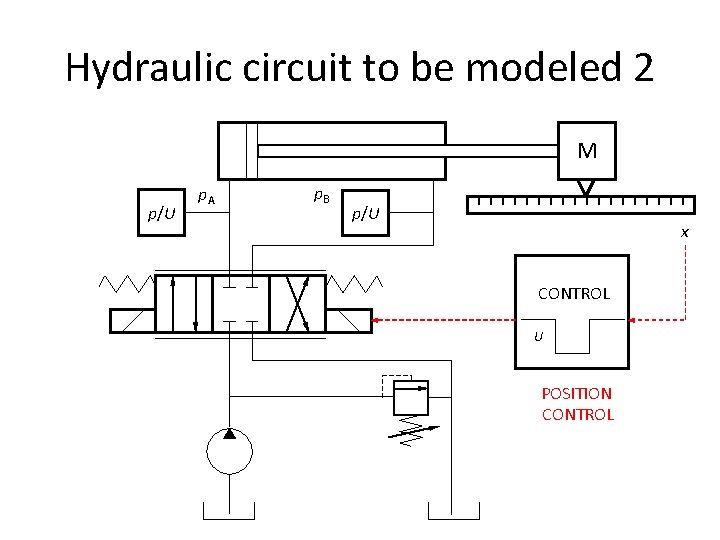
Simulation work • Cylinder system – Hydraulic cylinder (actuator) – Proportional control valve (Regel Ventil) – Load (mass) – Control system (open loop control) • Control system – PID control of systems • Position control
Hydraulic circuit to be modeled 1 M p/U p. A p. B p/U x CONTROL U
Hydraulic circuit to be modeled 2 M p/U p. A p. B p/U x CONTROL U POSITION CONTROL
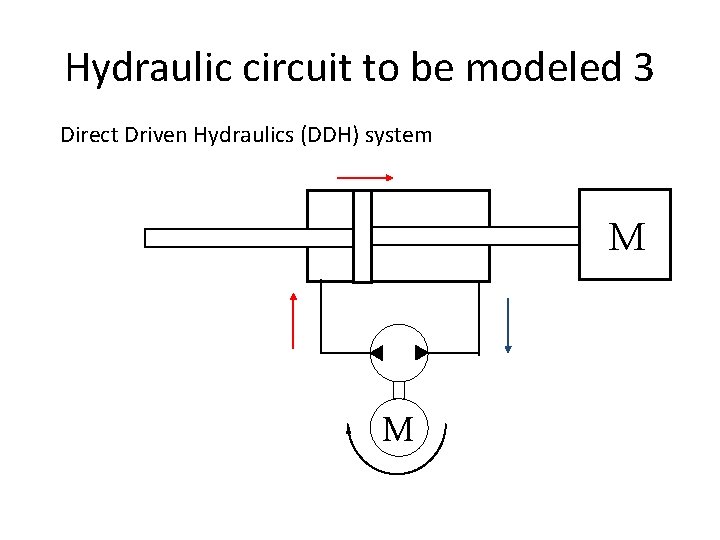
Hydraulic circuit to be modeled 3 Direct Driven Hydraulics (DDH) system M M
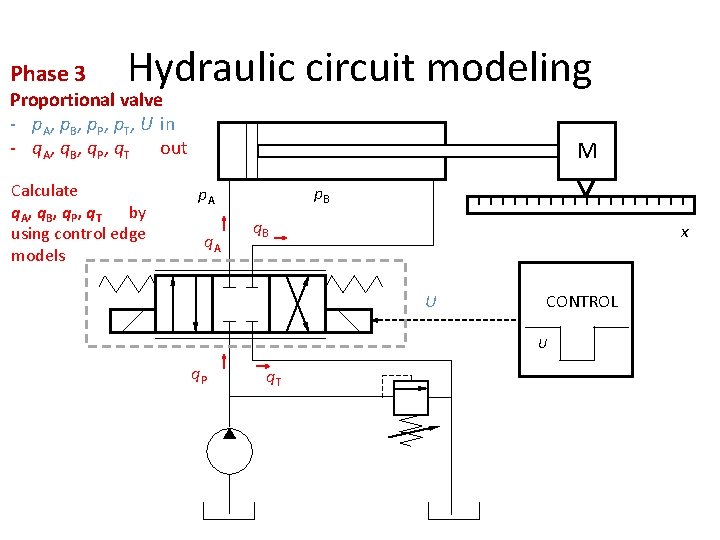
Phase 3 Hydraulic circuit modeling Proportional valve - p. A, p. B, p. P, p. T, U in - q. A, q. B, q. P, q. T out Calculate q. A, q. B, q. P, q. T by using control edge models M p. B p. A q. B x U CONTROL U q. P q. T
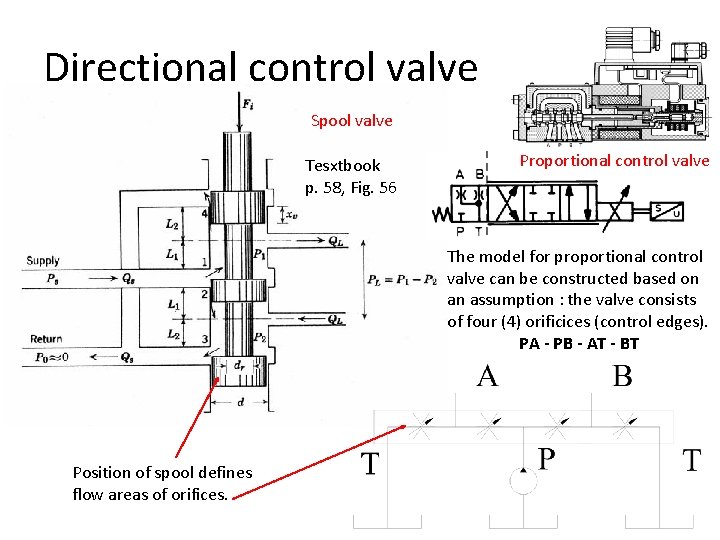
Directional control valve Spool valve Tesxtbook p. 58, Fig. 56 Proportional control valve The model for proportional control valve can be constructed based on an assumption : the valve consists of four (4) orificices (control edges). PA - PB - AT - BT Position of spool defines flow areas of orifices.
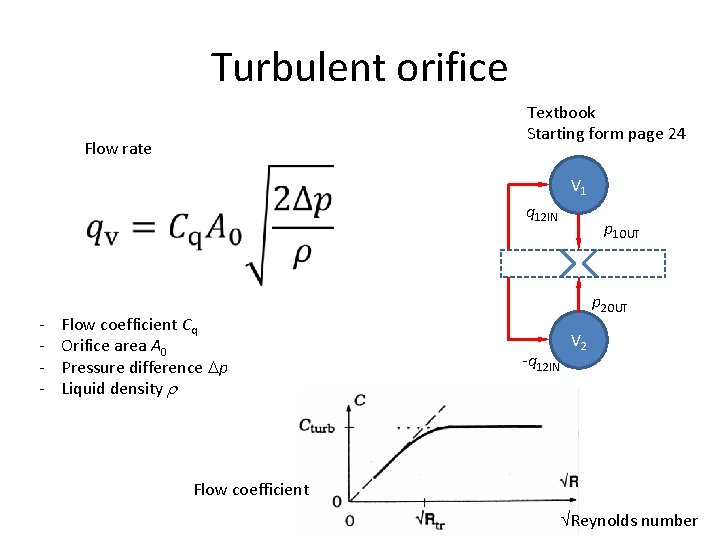
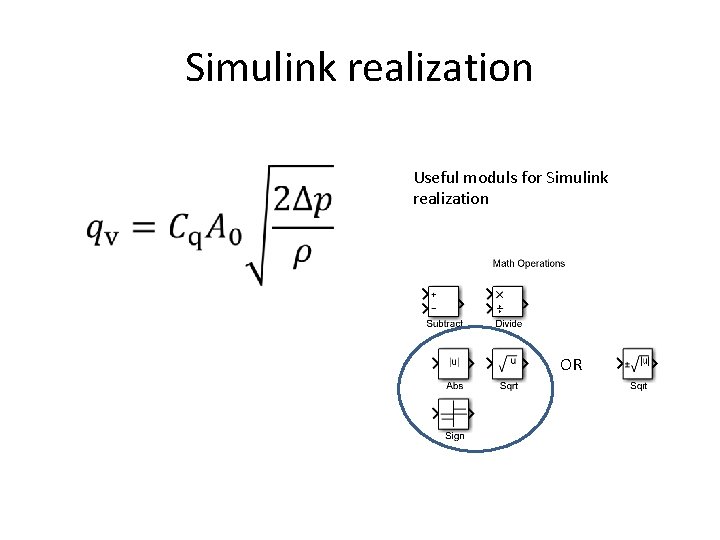
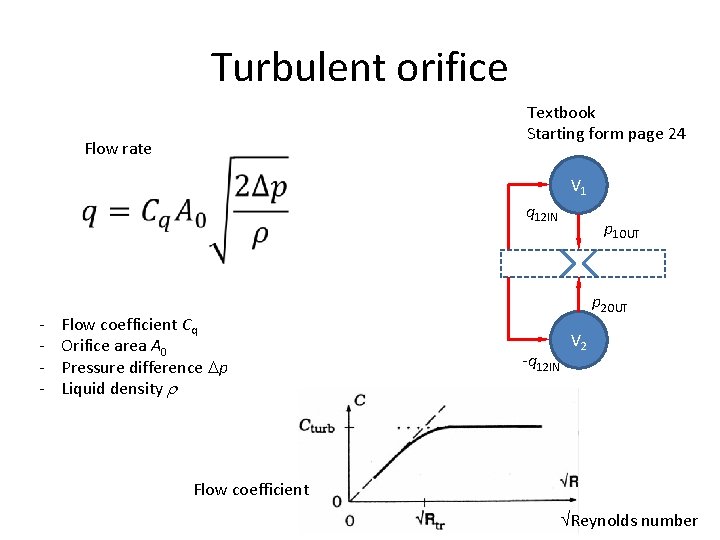
Turbulent orifice Textbook Starting form page 24 Flow rate V 1 q 12 IN - Flow coefficient Cq Orifice area A 0 Pressure difference p Liquid density p 1 OUT p 2 OUT -q 12 IN V 2 Flow coefficient Reynolds number
Simulink realization Useful moduls for Simulink realization OR
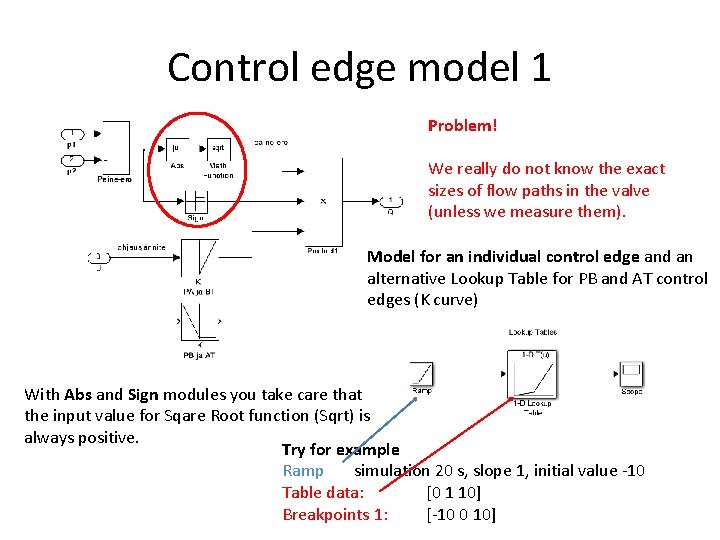
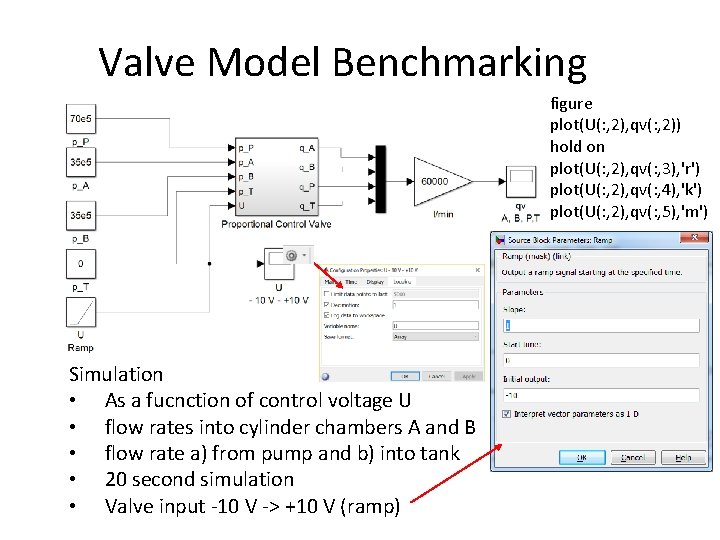
Control edge model 1 Problem! We really do not know the exact sizes of flow paths in the valve (unless we measure them). Model for an individual control edge and an alternative Lookup Table for PB and AT control edges (K curve) With Abs and Sign modules you take care that the input value for Sqare Root function (Sqrt) is always positive. Try for example Ramp simulation 20 s, slope 1, initial value -10 Table data: [0 1 10] Breakpoints 1: [-10 0 10]
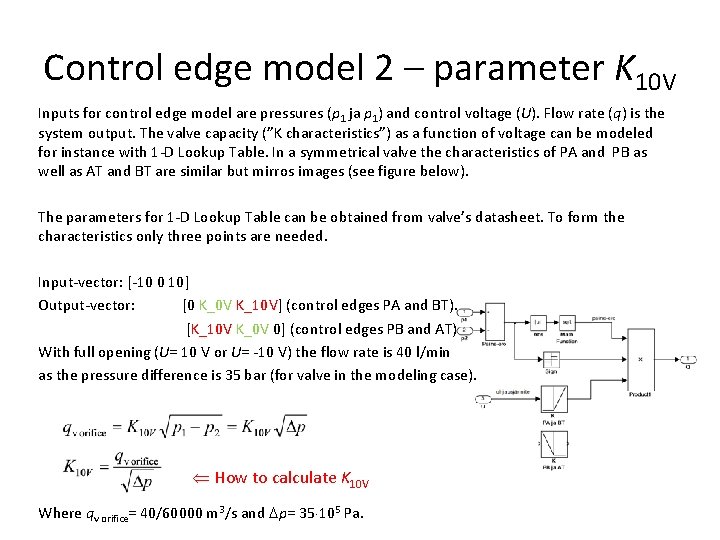
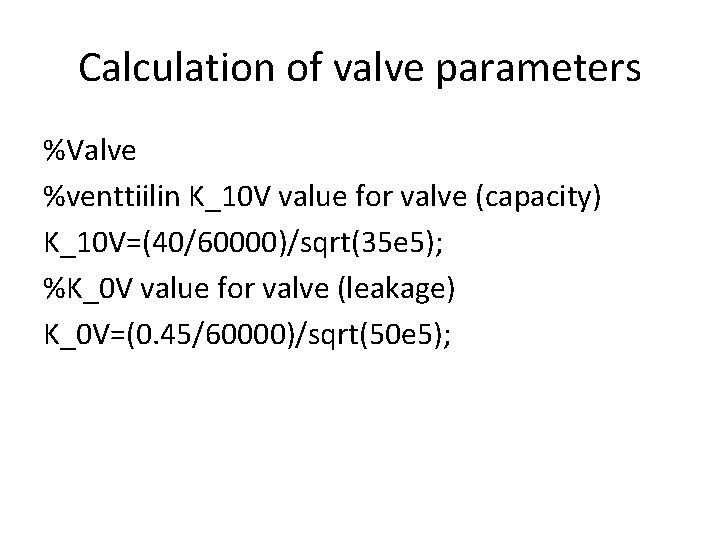
Control edge model 2 – parameter K 10 V Inputs for control edge model are pressures (p 1 ja p 1) and control voltage (U). Flow rate (q) is the system output. The valve capacity (”K characteristics”) as a function of voltage can be modeled for instance with 1 -D Lookup Table. In a symmetrical valve the characteristics of PA and PB as well as AT and BT are similar but mirros images (see figure below). The parameters for 1 -D Lookup Table can be obtained from valve’s datasheet. To form the characteristics only three points are needed. Input-vector: [-10 0 10] Output-vector: [0 K_0 V K_10 V] (control edges PA and BT). [K_10 V K_0 V 0] (control edges PB and AT) With full opening (U= 10 V or U= -10 V) the flow rate is 40 l/min as the pressure difference is 35 bar (for valve in the modeling case). How to calculate K 10 V Where qv orifice= 40/60000 m 3/s and p= 35 105 Pa.
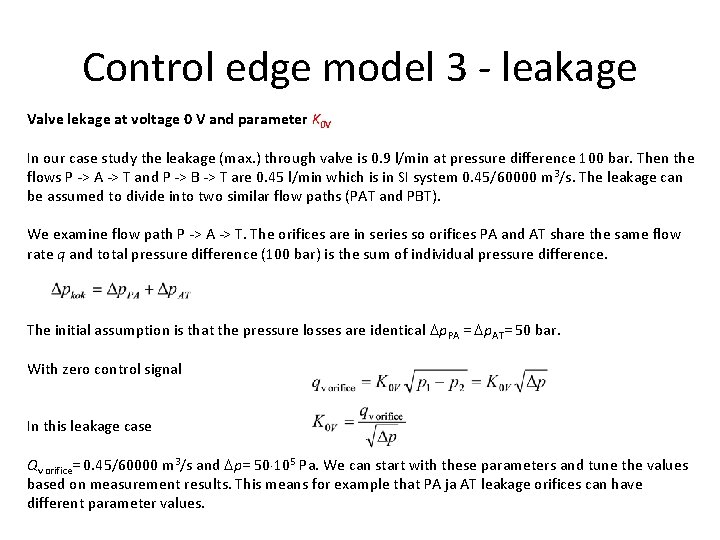
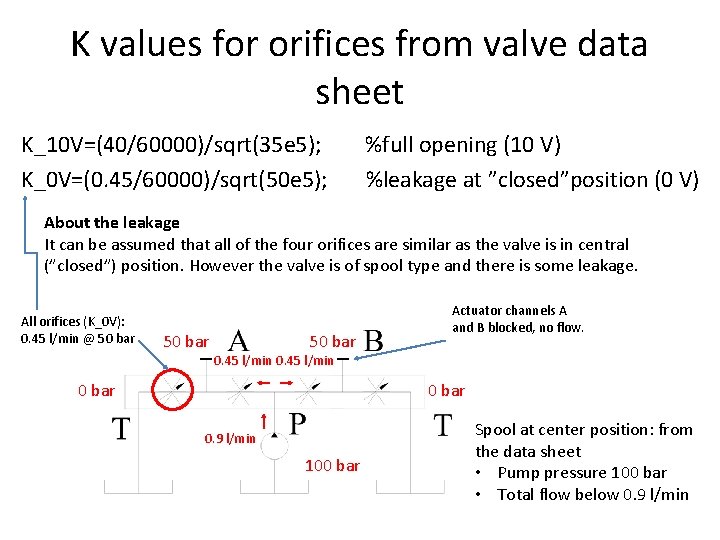
Control edge model 3 - leakage Valve lekage at voltage 0 V and parameter K 0 V In our case study the leakage (max. ) through valve is 0. 9 l/min at pressure difference 100 bar. Then the flows P -> A -> T and P -> B -> T are 0. 45 l/min which is in SI system 0. 45/60000 m 3/s. The leakage can be assumed to divide into two similar flow paths (PAT and PBT). We examine flow path P -> A -> T. The orifices are in series so orifices PA and AT share the same flow rate q and total pressure difference (100 bar) is the sum of individual pressure difference. The initial assumption is that the pressure losses are identical p. PA = p. AT= 50 bar. With zero control signal In this leakage case Qv orifice= 0. 45/60000 m 3/s and p= 50 105 Pa. We can start with these parameters and tune the values based on measurement results. This means for example that PA ja AT leakage orifices can have different parameter values.
K values for orifices from valve data sheet K_10 V=(40/60000)/sqrt(35 e 5); %full opening (10 V) K_0 V=(0. 45/60000)/sqrt(50 e 5); %leakage at ”closed”position (0 V) About the leakage It can be assumed that all of the four orifices are similar as the valve is in central (”closed”) position. However the valve is of spool type and there is some leakage. All orifices (K_0 V): 0. 45 l/min @ 50 bar Actuator channels A and B blocked, no flow. 0. 45 l/min 0 bar 0. 9 l/min 100 bar Spool at center position: from the data sheet • Pump pressure 100 bar • Total flow below 0. 9 l/min
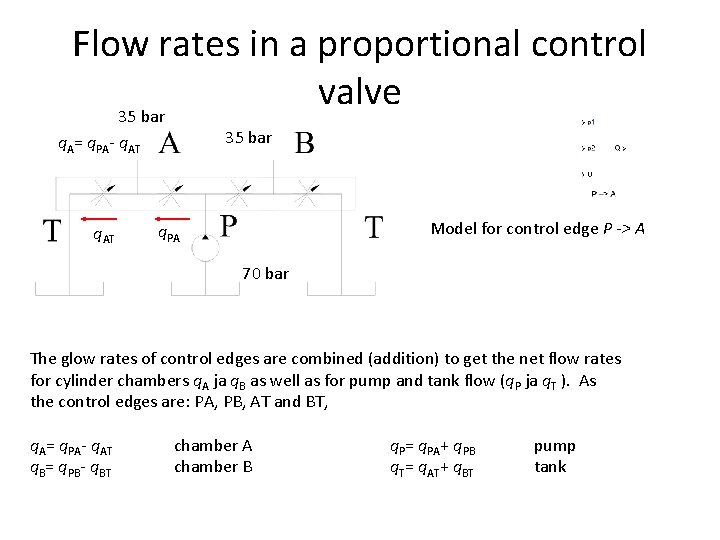
Flow rates in a proportional control valve 35 bar q. A= q. PA- q. AT Model for control edge P -> A q. PA 70 bar The glow rates of control edges are combined (addition) to get the net flow rates for cylinder chambers q. A ja q. B as well as for pump and tank flow (q. P ja q. T ). As the control edges are: PA, PB, AT and BT, q. A= q. PA- q. AT chamber A q. P= q. PA+ q. PB pump q. B= q. PB- q. BT chamber B q. T= q. AT+ q. BT tank
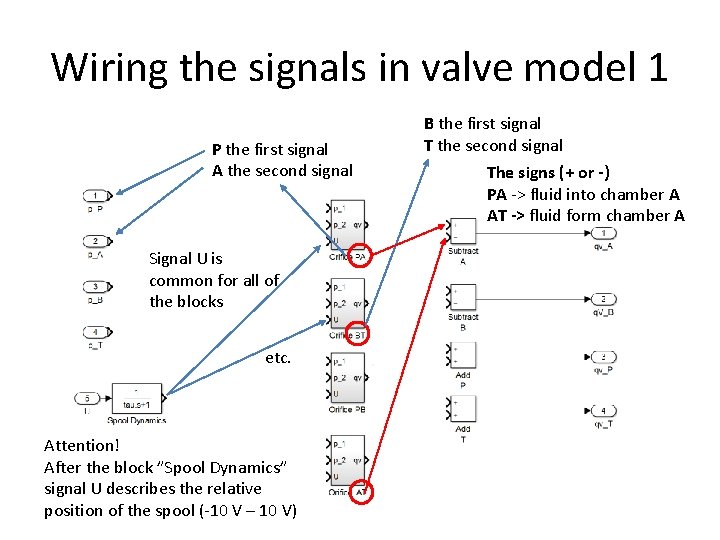
Wiring the signals in valve model 1 P the first signal A the second signal Signal U is common for all of the blocks etc. Attention! After the block ”Spool Dynamics” signal U describes the relative position of the spool (-10 V – 10 V) B the first signal T the second signal The signs (+ or -) PA -> fluid into chamber A AT -> fluid form chamber A
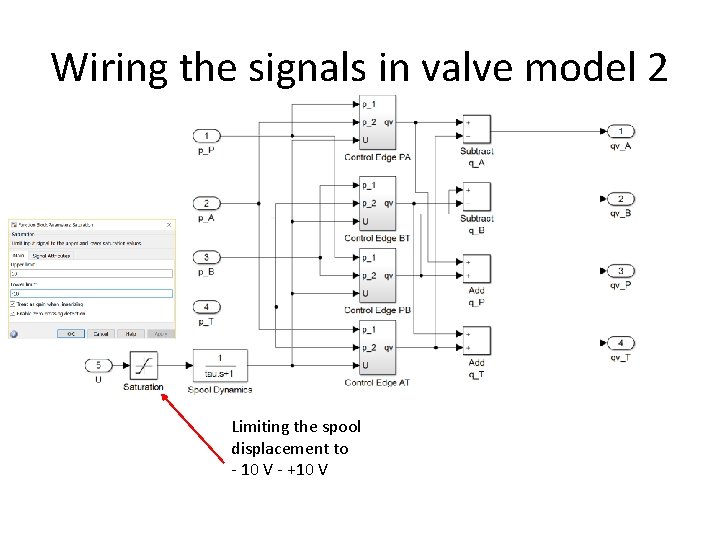
Wiring the signals in valve model 2 Limiting the spool displacement to - 10 V - +10 V
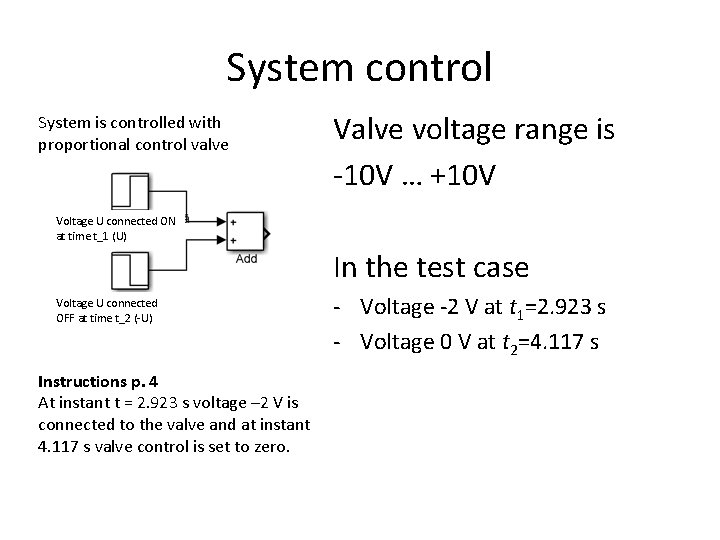
System control System is controlled with proportional control valve Valve voltage range is -10 V … +10 V Voltage U connected ON at time t_1 (U) In the test case Voltage U connected OFF at time t_2 (-U) Instructions p. 4 At instant t = 2. 923 s voltage – 2 V is connected to the valve and at instant 4. 117 s valve control is set to zero. - Voltage -2 V at t 1=2. 923 s - Voltage 0 V at t 2=4. 117 s
Calculation of valve parameters %Valve %venttiilin K_10 V value for valve (capacity) K_10 V=(40/60000)/sqrt(35 e 5); %K_0 V value for valve (leakage) K_0 V=(0. 45/60000)/sqrt(50 e 5);
Turbulent orifice Textbook Starting form page 24 Flow rate V 1 q 12 IN - Flow coefficient Cq Orifice area A 0 Pressure difference p Liquid density p 1 OUT p 2 OUT -q 12 IN V 2 Flow coefficient Reynolds number
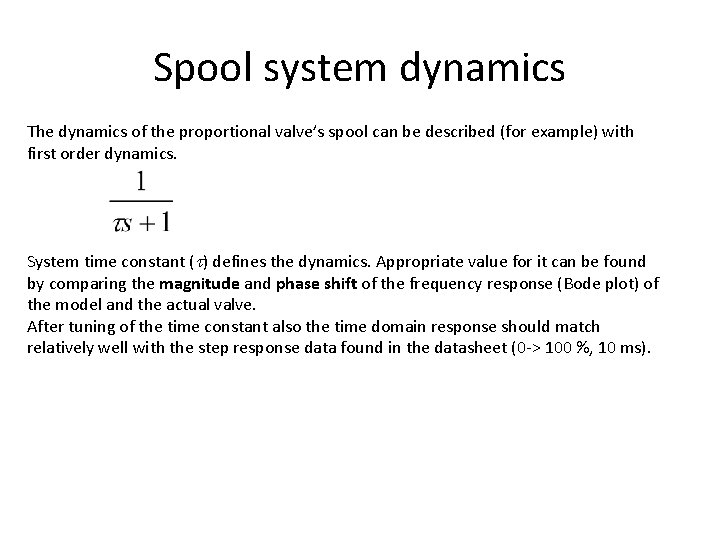
Spool system dynamics The dynamics of the proportional valve’s spool can be described (for example) with first order dynamics. System time constant ( ) defines the dynamics. Appropriate value for it can be found by comparing the magnitude and phase shift of the frequency response (Bode plot) of the model and the actual valve. After tuning of the time constant also the time domain response should match relatively well with the step response data found in the datasheet (0 -> 100 %, 10 ms).
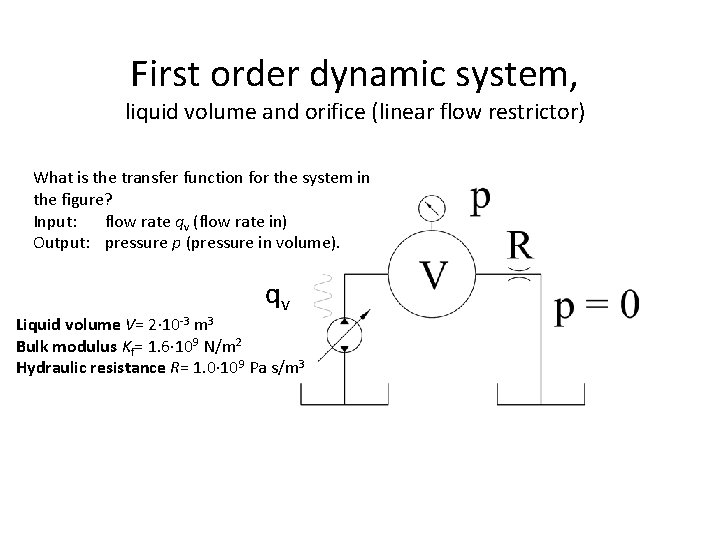
First order dynamic system, liquid volume and orifice (linear flow restrictor) What is the transfer function for the system in the figure? Input: flow rate qv (flow rate in) Output: pressure p (pressure in volume). qv Liquid volume V= 2 10 -3 m 3 Bulk modulus Kf= 1. 6 109 N/m 2 Hydraulic resistance R= 1. 0 109 Pa s/m 3
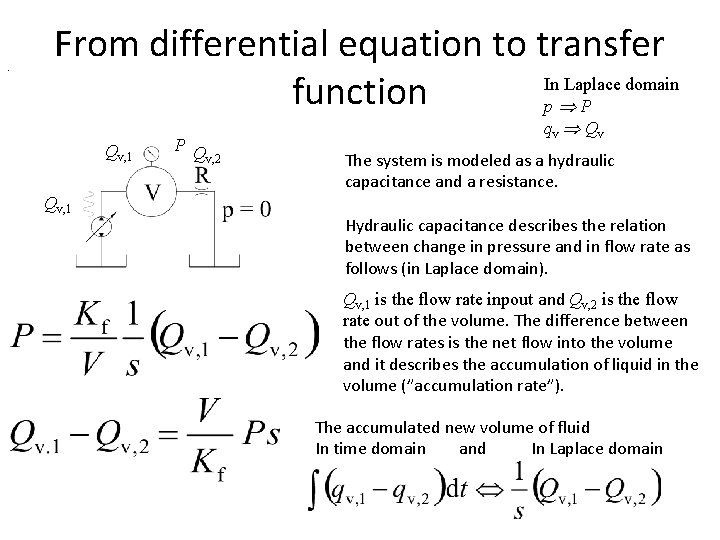
. From differential equation to transfer In Laplace domain function p P Qv, 1 P Q v, 2 qv Qv The system is modeled as a hydraulic capacitance and a resistance. Hydraulic capacitance describes the relation between change in pressure and in flow rate as follows (in Laplace domain). Qv, 1 is the flow rate inpout and Qv, 2 is the flow rate out of the volume. The difference between the flow rates is the net flow into the volume and it describes the accumulation of liquid in the volume (”accumulation rate”). The accumulated new volume of fluid In time domain and In Laplace domain
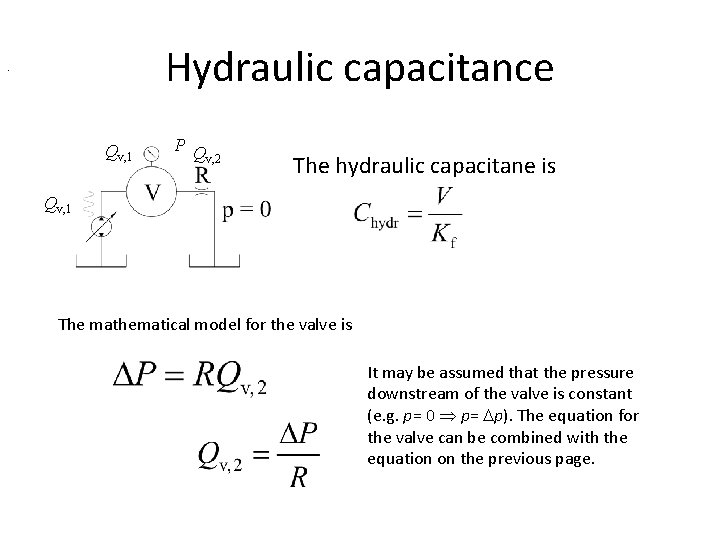
Hydraulic capacitance . Qv, 1 P Q v, 2 The hydraulic capacitane is Qv, 1 The mathematical model for the valve is It may be assumed that the pressure downstream of the valve is constant (e. g. p= 0 p= p). The equation for the valve can be combined with the equation on the previous page.
Combining the equations Qv, 2 is replaced with this. The transfer function for the system is
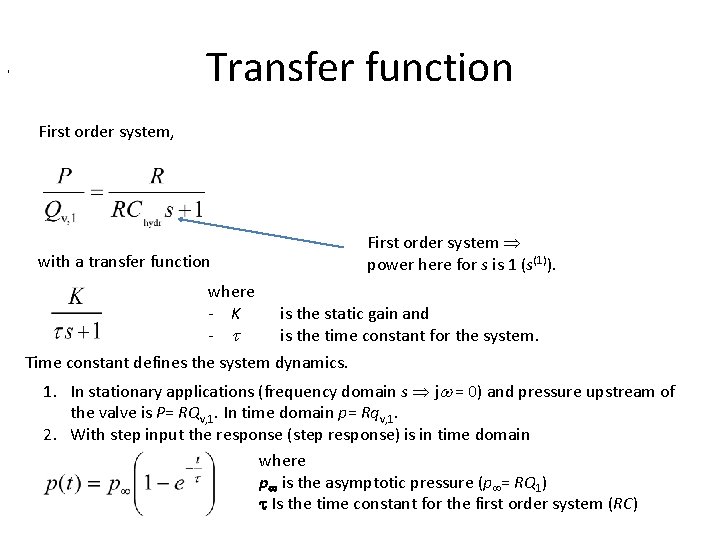
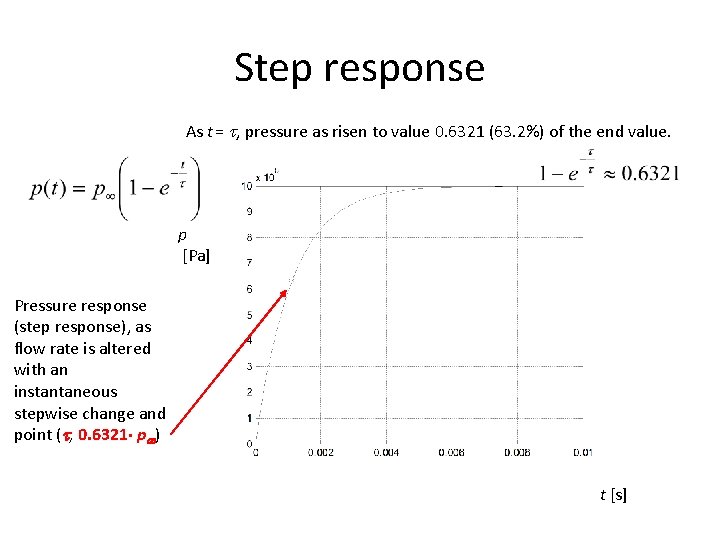
Transfer function , First order system power here for s is 1 (s(1)). with a transfer function where - K - is the static gain and is the time constant for the system. Time constant defines the system dynamics. 1. In stationary applications (frequency domain s j = 0) and pressure upstream of the valve is P= RQv, 1. In time domain p= Rqv, 1. 2. With step input the response (step response) is in time domain where p is the asymptotic pressure (p = RQ 1) Is the time constant for the first order system (RC)
Step response As t = , pressure as risen to value 0. 6321 (63. 2%) of the end value. p [Pa] Pressure response (step response), as flow rate is altered with an instantaneous stepwise change and point ( , 0. 6321 p ) t [s]
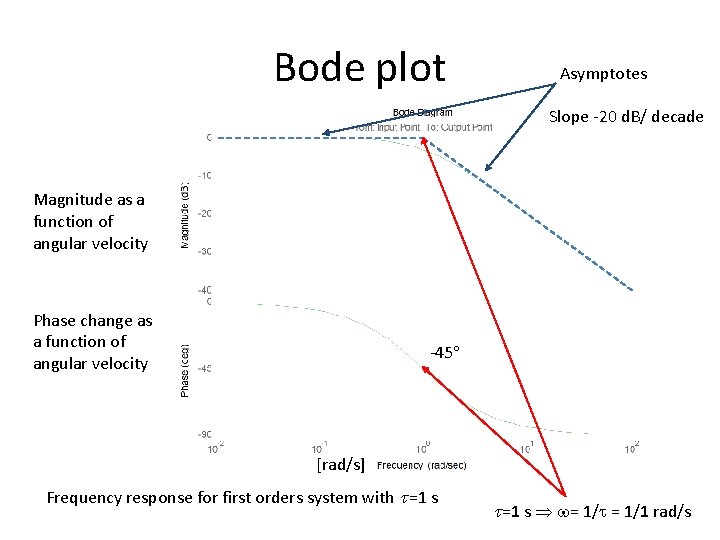
Bode plot Asymptotes Slope -20 d. B/ decade Magnitude as a function of angular velocity Phase change as a function of angular velocity -45 [rad/s] Frequency response for first orders system with =1 s = 1/1 rad/s
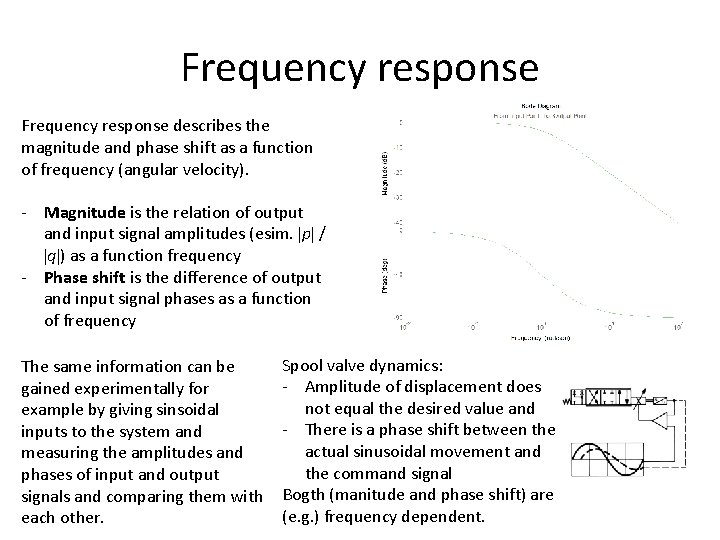
Frequency response describes the magnitude and phase shift as a function of frequency (angular velocity). - Magnitude is the relation of output and input signal amplitudes (esim. p / q ) as a function frequency - Phase shift is the difference of output and input signal phases as a function of frequency The same information can be gained experimentally for example by giving sinsoidal inputs to the system and measuring the amplitudes and phases of input and output signals and comparing them with each other. Spool valve dynamics: - Amplitude of displacement does not equal the desired value and - There is a phase shift between the actual sinusoidal movement and the command signal Bogth (manitude and phase shift) are (e. g. ) frequency dependent.
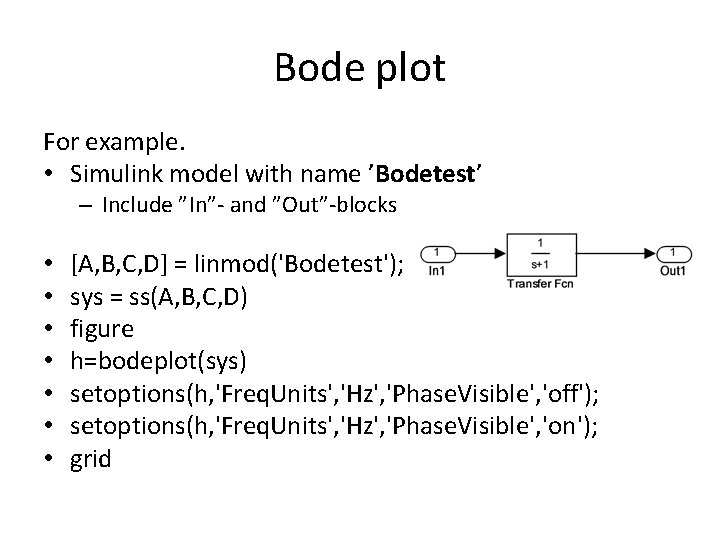
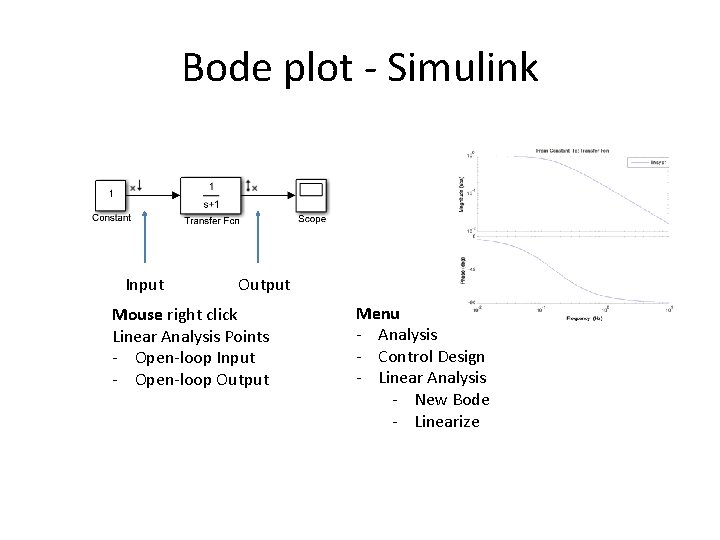
Bode plot For example. • Simulink model with name ’Bodetest’ – Include ”In”- and ”Out”-blocks • • [A, B, C, D] = linmod('Bodetest'); sys = ss(A, B, C, D) figure h=bodeplot(sys) setoptions(h, 'Freq. Units', 'Hz', 'Phase. Visible', 'off'); setoptions(h, 'Freq. Units', 'Hz', 'Phase. Visible', 'on'); grid
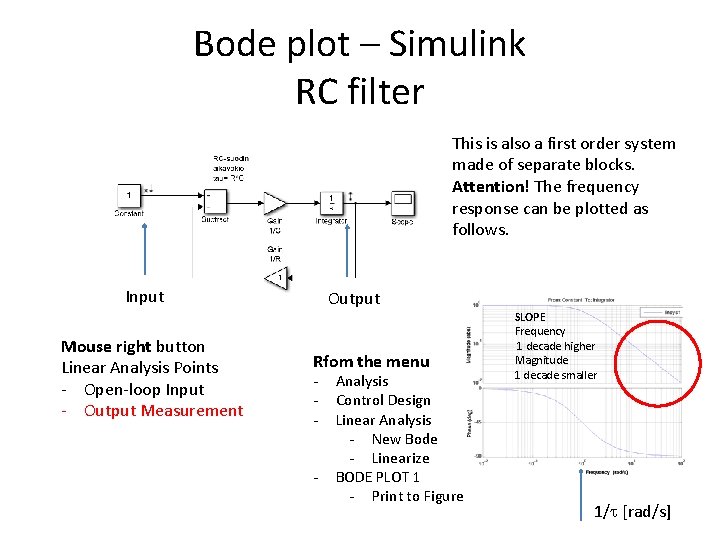
Bode plot - Simulink Input Output Mouse right click Linear Analysis Points - Open-loop Input - Open-loop Output Menu - Analysis - Control Design - Linear Analysis - New Bode - Linearize
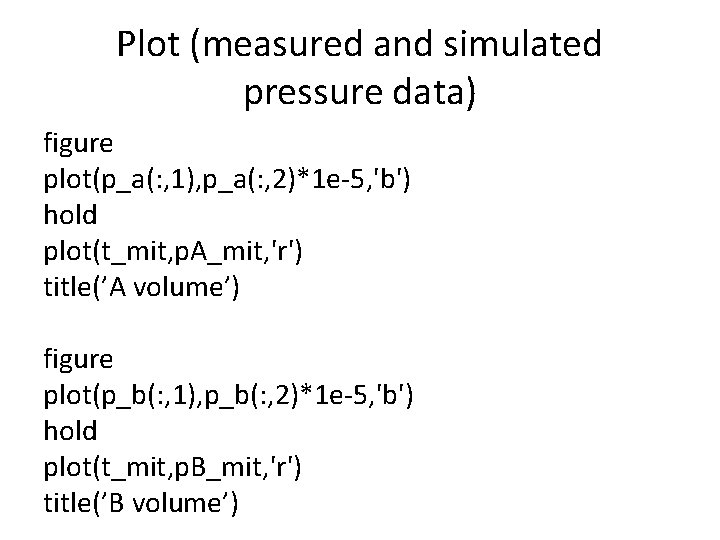
Plot (measured and simulated pressure data) figure plot(p_a(: , 1), p_a(: , 2)*1 e-5, 'b') hold plot(t_mit, p. A_mit, 'r') title(’A volume’) figure plot(p_b(: , 1), p_b(: , 2)*1 e-5, 'b') hold plot(t_mit, p. B_mit, 'r') title(’B volume’)
Valve Model Benchmarking figure plot(U(: , 2), qv(: , 2)) hold on plot(U(: , 2), qv(: , 3), 'r') plot(U(: , 2), qv(: , 4), 'k') plot(U(: , 2), qv(: , 5), 'm') Simulation • As a fucnction of control voltage U • flow rates into cylinder chambers A and B • flow rate a) from pump and b) into tank • 20 second simulation • Valve input -10 V -> +10 V (ramp)
Distributed structure - feedback Feedback loop -> 1 st order system
Bode plot – Simulink RC filter This is also a first order system made of separate blocks. Attention! The frequency response can be plotted as follows. Input Mouse right button Linear Analysis Points - Open-loop Input - Output Measurement Output Rfom the menu - Analysis Control Design Linear Analysis - New Bode - Linearize BODE PLOT 1 - Print to Figure SLOPE Frequency 1 decade higher Magnitude 1 decade smaller 1/ [rad/s]
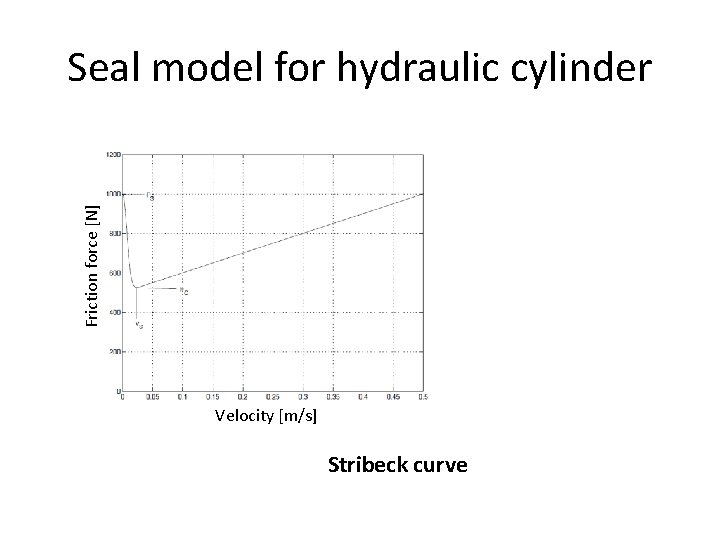
Friction force [N] Seal model for hydraulic cylinder Velocity [m/s] Stribeck curve
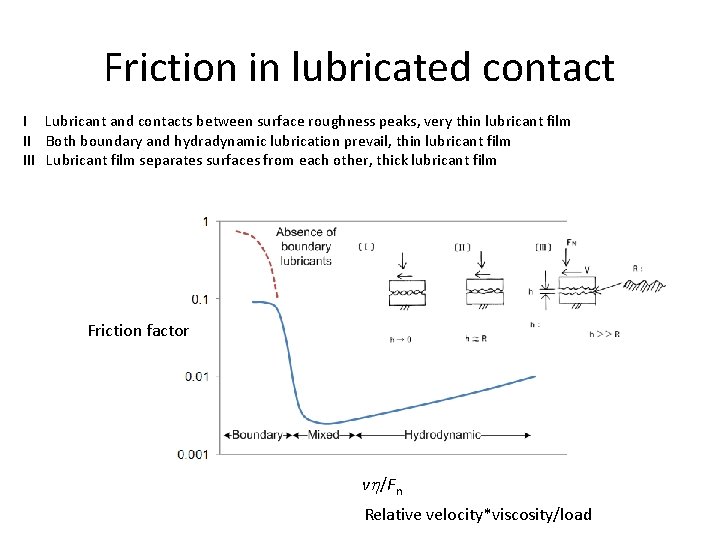
Friction in lubricated contact I Lubricant and contacts between surface roughness peaks, very thin lubricant film II Both boundary and hydradynamic lubrication prevail, thin lubricant film III Lubricant film separates surfaces from each other, thick lubricant film Friction factor v /Fn Relative velocity*viscosity/load
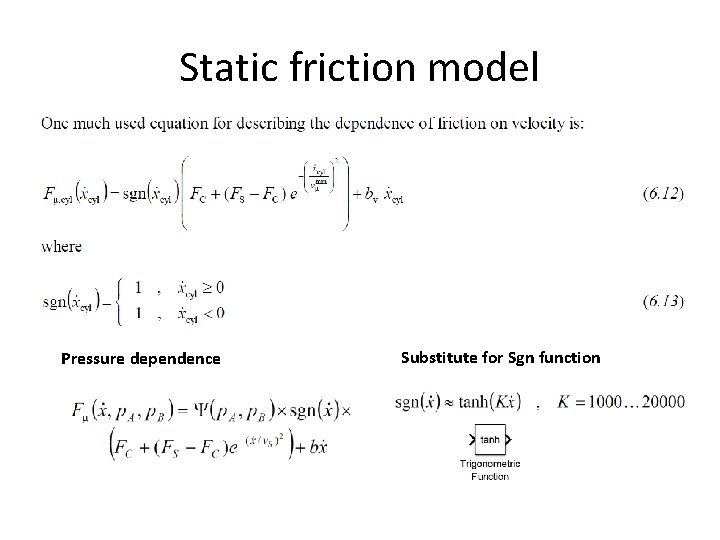
Static friction model Pressure dependence Substitute for Sgn function
Realization of static friction model Parameters vs FS FC b Divide by constant vs Square Change the sign Exponential function Subtraction, two constants (FS and FC ) Multiplication Addition (FC and expression) Signum function Multiplication with a constant (b) Addition describes the velocity realated to minimum force static friction force Coulomb friction force viscous friction coefficient Gain block -> 1/ vs Math function -> square Gain block -> -1 Math function -> exp Subtract Product Add Testing: Sgn vs n. 0. 02 m/s Product FS 1000 N FC 500 N Gain block -> b b 1000 N/(m/s) Add
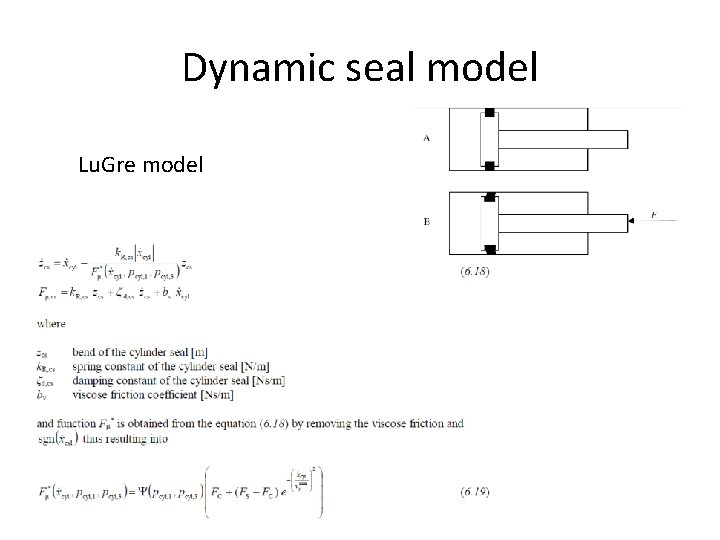
Dynamic seal model Lu. Gre model
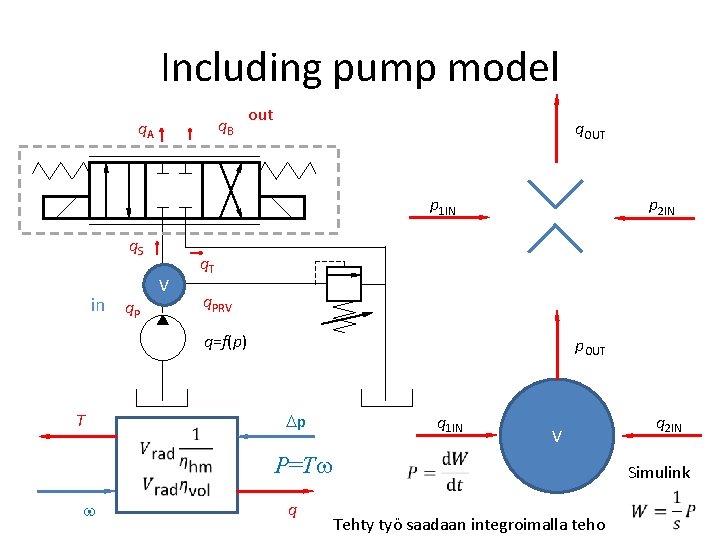
Including pump model q. B q. A out q. OUT p 1 IN q. S in q. P V p 2 IN q. T q. PRV q=f(p) T p. OUT p q 1 IN P=T q q 2 IN V Simulink Tehty työ saadaan integroimalla teho
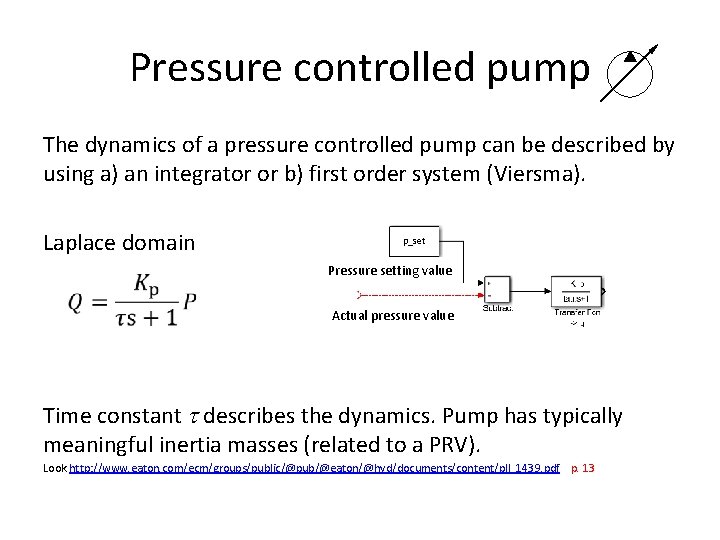
Pressure controlled pump The dynamics of a pressure controlled pump can be described by using a) an integrator or b) first order system (Viersma). Laplace domain p_set Pressure setting value Input P Actual pressure value Time constant describes the dynamics. Pump has typically meaningful inertia masses (related to a PRV). Look http: //www. eaton. com/ecm/groups/public/@pub/@eaton/@hyd/documents/content/pll_1439. pdf p. 13
Pressure relief valve Under costruction! - Look Textbook - Viersma’s book -> first order system as valve dynamics • http: //www. mathworks. se/help/physmod/hy dro/ref/pressurereliefvalve. html