Measuring water depth Echosounding Historical Note to measure


 ise • ses dalgalarını kullanarak cismin boyut, uzaklık ve")


 T: temperature (°C)")


 only")


- Slides: 28
Measuring water depth: Echosounding
Historical Note • to measure ocean water depths: – a heavy line was lowered to the seafloor – called "sounding". • The Challenger expedition in 1872 – 492 soundings using a heavy line
Echo sounder • Seyir halinde ultrasonik ses dalgaları yardımıyla deniz dibi derinliğini ölçer • dikey deniz ortamındaki cisimlerin yüzeye olan mesafesini tesbit eder. • ultrasonik ses dalgalarının kullanılma nedenizde daha çabuk yayılma özelliğine sahip olmaları. • Cihaz deniz suyuna 14 -200 k. Hz frekanslı pals şeklinde bir enerji gönderir. • Geminin omurga hizasından deniz suyuna dik olarak gönderilen hüzme şeklindeki bu enerji palsi deniz ortamındaki yansıtıcı hedeflere çarpıp yankı olarak geri döner. • Cihaz alıcısı tarafından bu ekolar alınıp genliği yükseltilir ve bir kayıt edicide kaydedilir.
Sonar (Sound Navigation And Ranging) ise • ses dalgalarını kullanarak cismin boyut, uzaklık ve diğer verileri görmeğe yarar. • Sesin sualtında yayılmasını kullanarak su altındaki cisimleri tesbit etmeyi sağlayan teknik.
Echosounders • An electrical depth sounder that uses sound echoes to determine water depth. • sends an outgoing sound pulse into the water • sound energy travels through the water to the ocean bottom
Echosounders • sometimes called Fathometers • attached to the hull of a ship or a towed vehicle
The speed of sound in the ocean V: sound speed (m/sec) T: temperature (°C) S: salinity (‰) D: depth (m)
• Water depth is determined from the travel time and the speed of sound in water. • Water depth can be estimated simply by using an average sound speed and the following relationship: – Distance = speed multiplied by time/2
Q? • a sound pulse takes 2 seconds to travel to the seafloor and return to the ship, what is the depth to the seafloor? • (Use 1500 m/sec as the speed of sound).
Comparison of Echo Sounding with Seismic Reflection Profiling • Attenuation of Sound Energy – Function of Frequency • • high frequency - rapid attenuation low frequency - slow attenuation • Resolution of Reflectors – Function of Wavelength • • short wavelength - excellent resolution long wavelength - poor resolution – Related to Frequency & Velocity • • Wavelength = Velocity / Frequency , or Velocity = Wavelength X Frequency so: 0. 571 m. = 2000 m/sec / 3. 5 k. Hz, 2 m. = 2000 m/sec / 1000 Hz, & 20 m. = 2000 m/sec / 100 Hz thus: high frequency - excellent resolution low frequency - poor resolution
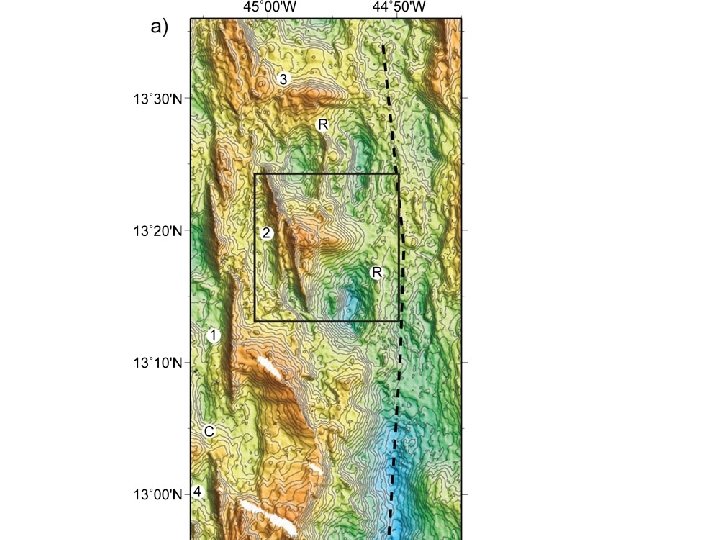
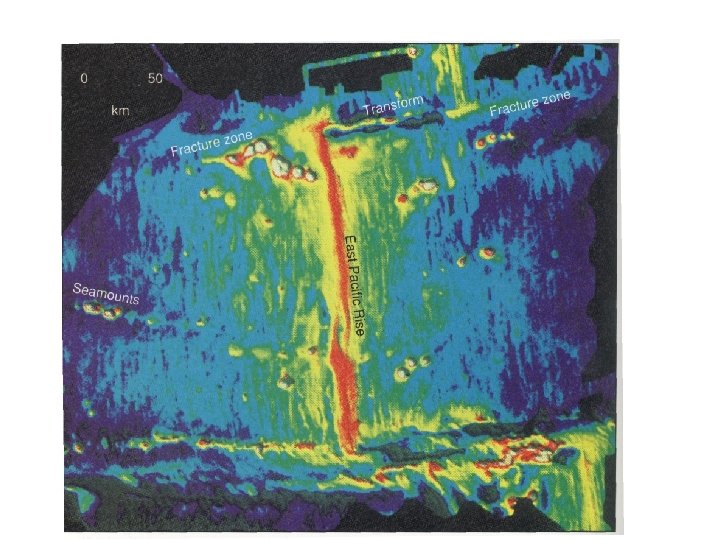
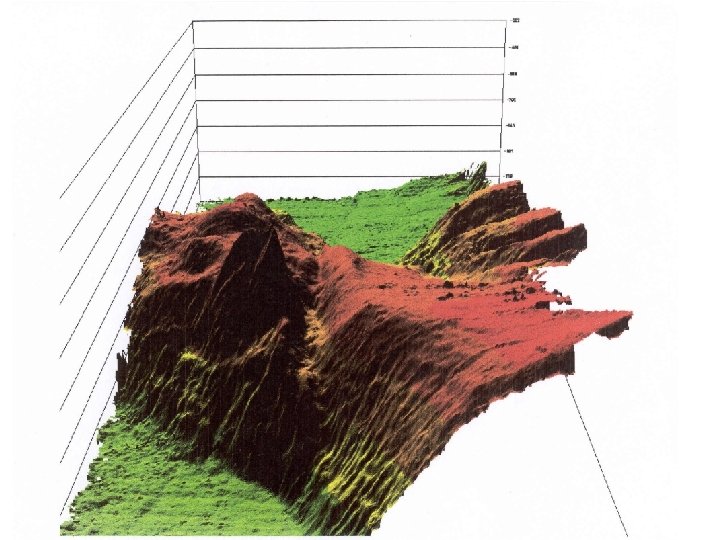
acoustic imaging of the Sea Floor • bathymetry ≡ measurement of water depth • detailed bathymetry ≡ depth morphology high-resolution of seafloor
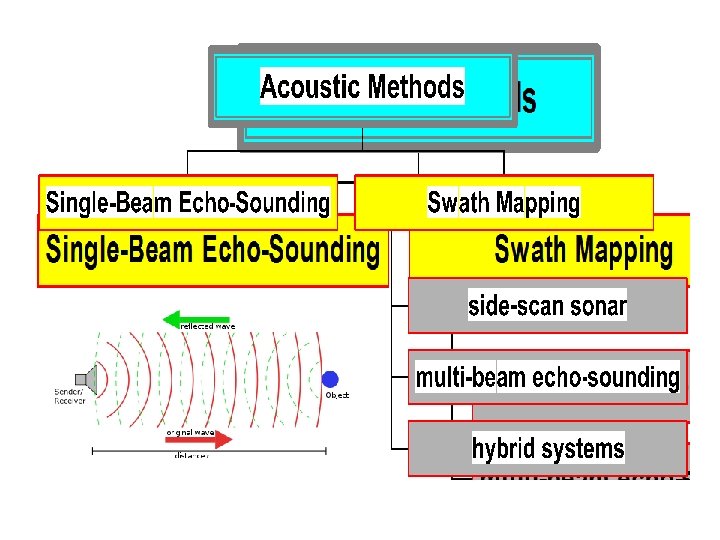
SINGLE-BEAM ECHO-SOUNDING
echo sounder evolution • the Multibeam or Fan Echosounder for imaging the sea floor relief and other objects (the successor to the classical echosounder) • the Sidescan Echosounder, for imaging the small -scale morphology of the seafloor and shape of structures • the Sediment Penetrating Echosounder for imaging the internat structure of layers and detect buired objects
Echo Sounding • 40 k. Hz - Fathometer - shallow water (<100 m) only • 12 k. Hz - PDR - Bathymetry in deep water (up to 12 km) – no subbottom penetration • 3. 5 k. Hz - PDR - Bathymetry in deep water (up to 12 km) – up to 100 m of subbottom penetration
Multi-beam Swath Mapping • • • Deep-water and shelf surveys sonar array sounding system bathymetric plots contoured bathymetry shaded relief image = swath bathymetry
Single vs multibeam echo sounding of the seafloor • Single beam systems typically have beam widths of 10 -30 degrees and estimate depth by measuring the shortest slant range to the seafloor within the main beam. • Multibeam (swath sonar) sonar systems provide a series of slant range and elevation angle estimates along a fixed azimuth. • This method is preferred because it measures an entire area rather than a single line on the seafloor.
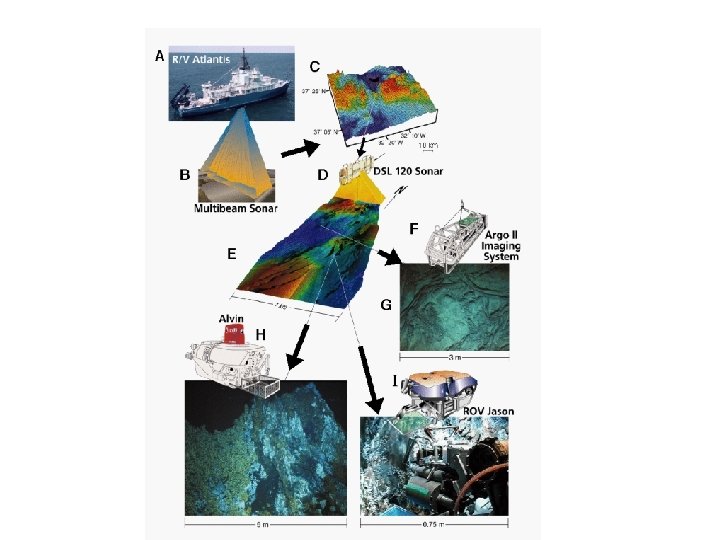
Multibeam Sonar Ship-mounted multibeam sonar systems provides a fan-shaped coverage of the seafloor – instead of recording the strength of the return echoes, – measure and record the time elapsed between the emission of the signal from the transducer to the seafloor or object, and back again – instead of a “line” of soundings, multibeam sonars produce a “swath” of soundings.
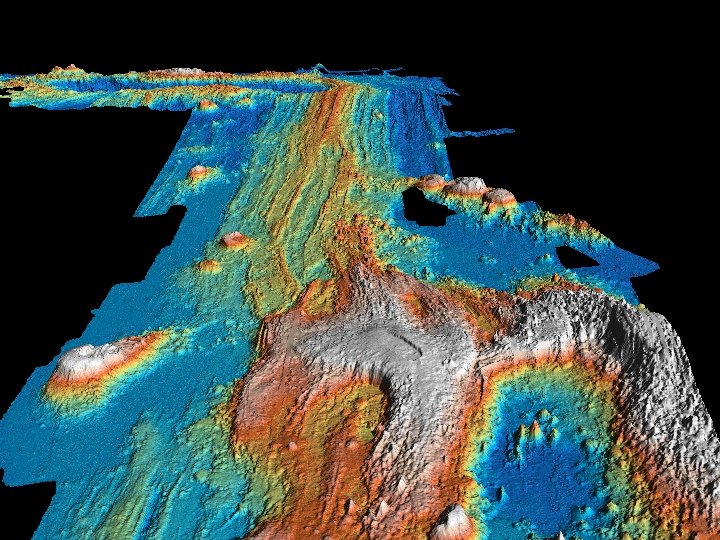
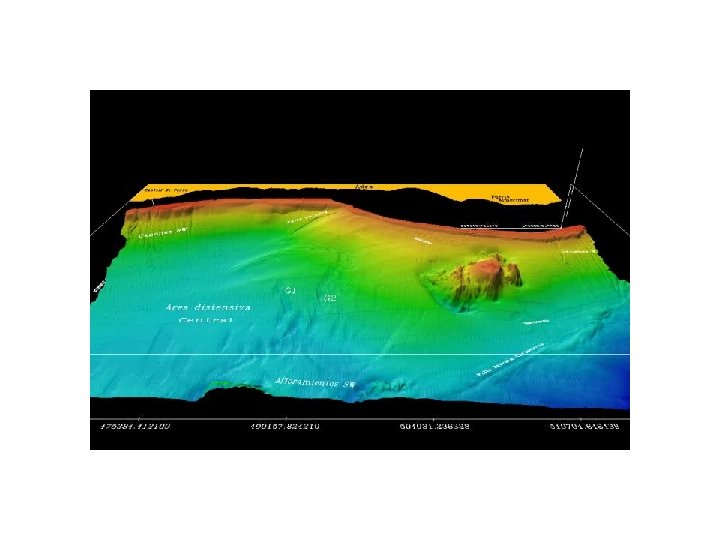
a seafloor volcano w/ a large crater: • This bathymetric contours are lines of equal water depth; • the color also represents water depth with reds being the shallowest and dark greens the deepest. • The volcano stands about 150 meters above the surrounding seafloor. • The side-scan sonar image of the volcano: • the volcano casts a shadow to the left, and the slope facing to the right is very bright. • Smaller bumps also cast small shadows making the topography look lumpy. • Each image is 3 km wide.
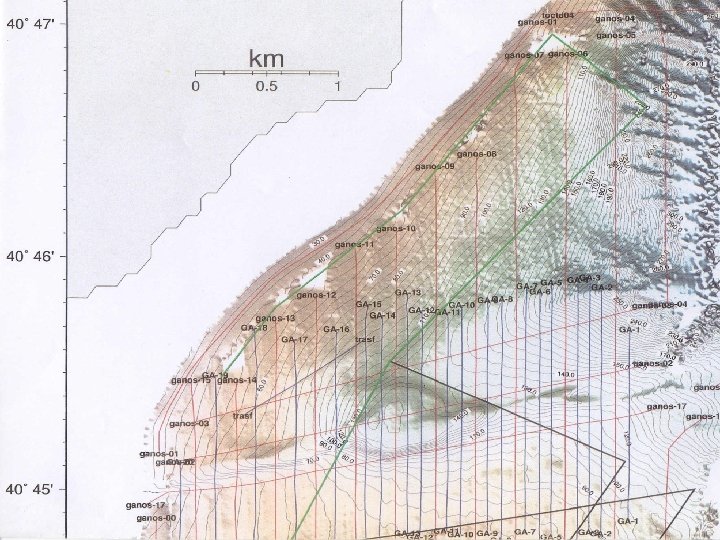
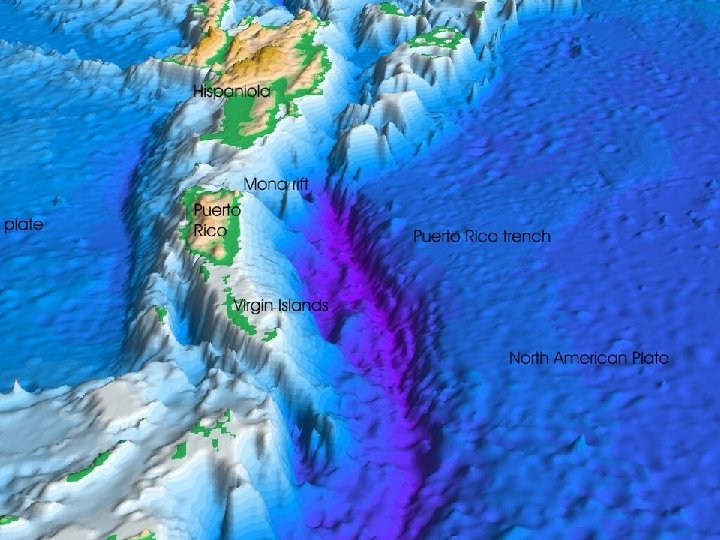
Detailed bathymetric data of the coastal ocean