Measuring prognosis Patients want to know likely outcome


- Slides: 13
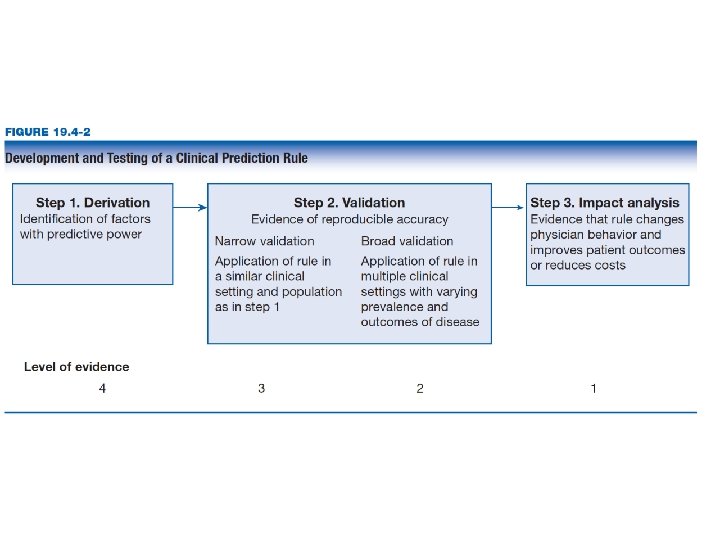
Measuring prognosis Patients want to know likely outcome Baseline risk for treatment decisions Best way: clinical prediction guide Measure large number of variables, outcome Construct regression model Test in varied clinical settings RCT to see if it changes practice
Prognostic power Discrimination versus calibration ROC and AUC Discrimination 1 Area under the ROC curve 0. 8 0. 7 Sensitivity Time-to-event: c-statistic ▪ 0. 5 to 1. 0 ▪ Less than 0. 6 not useful ▪ 0. 6 to 0. 75 possibly useful ▪ > 0. 75 clearly useful A 0. 9 B 0. 6 0. 5 C 0. 4 0. 3 0. 2 0. 1 0 0 0. 1 0. 2 0. 3 0. 4 0. 5 0. 6 0. 7 0. 8 0. 9 1 - Specificity 1
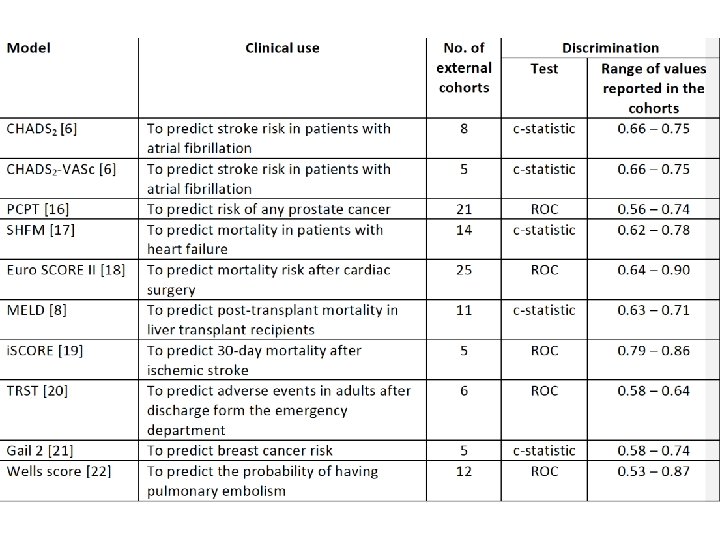
Euro. Score II predicts mortality after cardiac surgery C-statistic 0. 80 Overestimates mortality in higher risk patients Result could be patients Inappropriately declining surgery.
Calibration versus discrimination 1 yr survival after heart transplant 85% Survival less than 85% required for transplant Seattle heart failure score c-statistics 0. 63 Overestimates survival in higher risk Inappropriate declining transplant
Seattle heart failure in another cohort
Comparison of two models Compare how models classify patients Cases: higher predicted risk better Controls: lower predicted risk better Net reclassification So far % reclassified in cases + % in controls ▪ Range - 200% to + 200% Better would be % of total better reclassified ▪ Range – 100% to + 100%
Overall 730/11, 000 or 6. 7%
Overall -170/11, 000 or -1. 3%
Should we add CRP to Framingham? Predicting CV risk Framingham c-statistic 62% Add c-reactive protein 66%
Adding percentages NRI 8. 7% Overall NRI 0. 3%
1. Do authors provide information about both the discrimination and calibration of the model? If not, skepticism is warranted. 2. What is the discriminatory capacity of the model? Does the model adequately discriminate between patients at varying risk? 3. How well calibrated is the model? Does a visual representation suggest a consistent good fit between predicted and observed outcomes in patients at different risk categories? 4. When comparing two models, does one of the models re-classify patients more accurately?