
Measuring Mechanical Properties of Thin Optical Coatings Elaine

- Slides: 14
Measuring Mechanical Properties of Thin Optical Coatings Elaine Rhoades Mentors: Dr. Zanolin and Dr. Gretarsson, Embry-Riddle Collaborator: Dr. Abernathy, Caltech April 4, 2014 Discovery Day
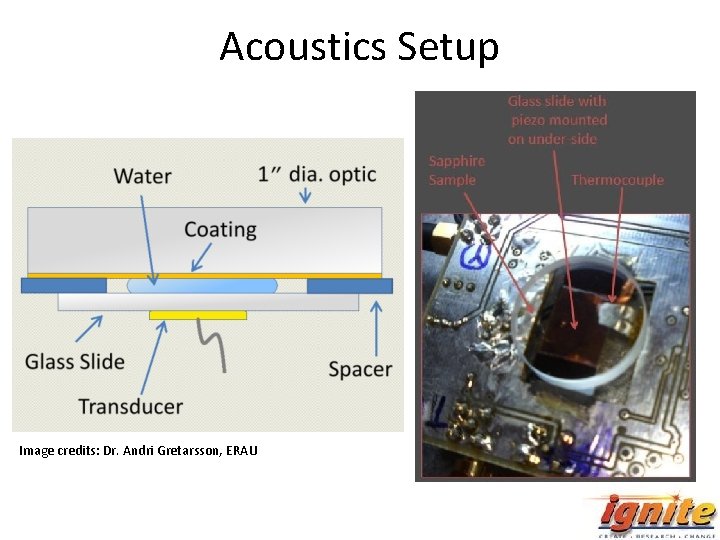
Acoustics Setup Image credits: Dr. Andri Gretarsson, ERAU
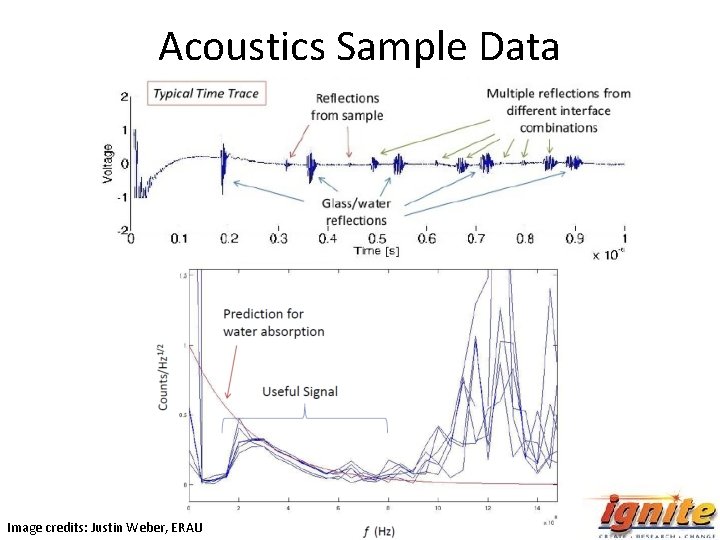
Acoustics Sample Data Image credits: Justin Weber, ERAU
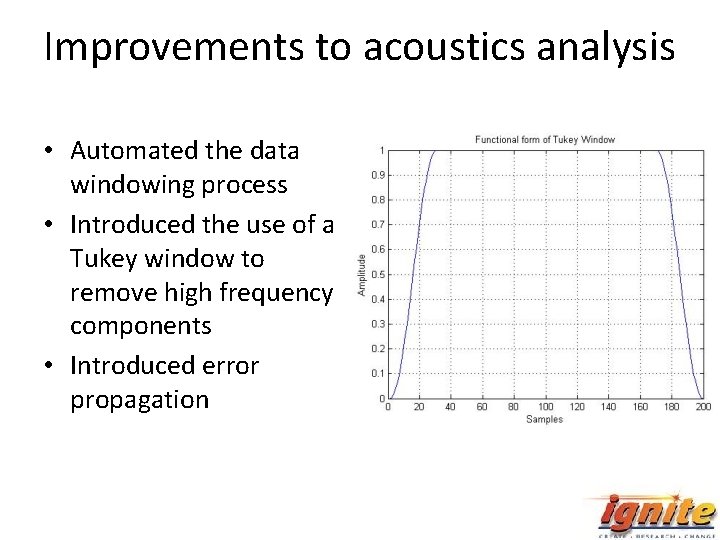
Improvements to acoustics analysis • Automated the data windowing process • Introduced the use of a Tukey window to remove high frequency components • Introduced error propagation
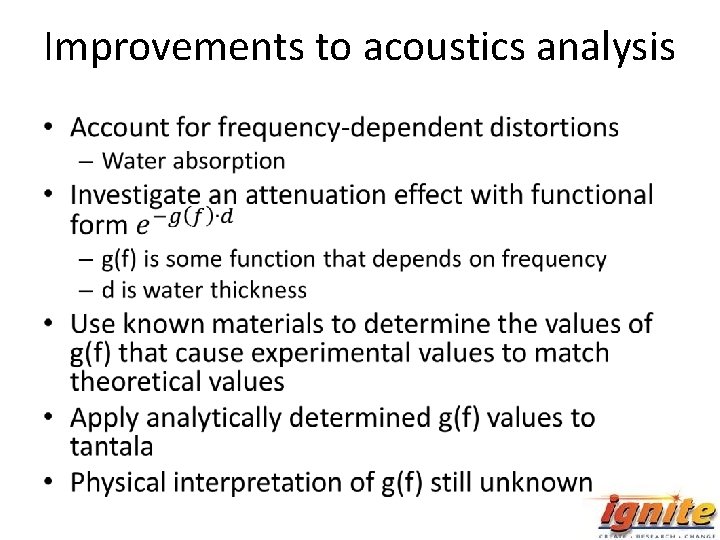
Improvements to acoustics analysis •
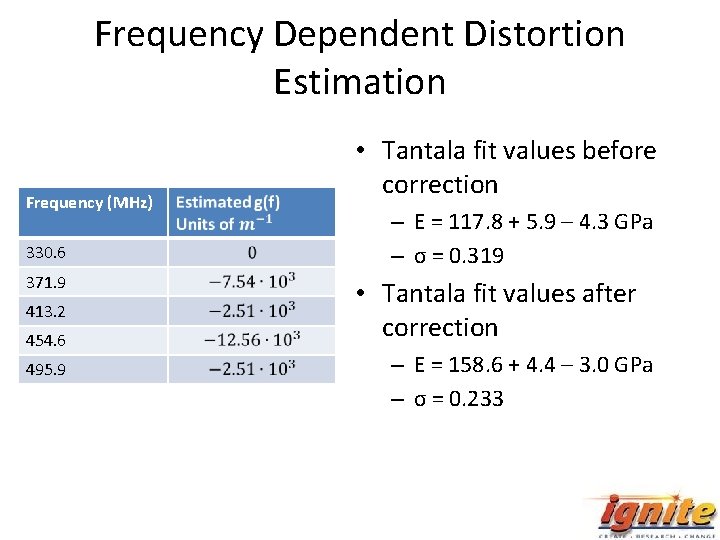
Frequency Dependent Distortion Estimation Frequency (MHz) 330. 6 371. 9 413. 2 454. 6 495. 9 • Tantala fit values before correction – E = 117. 8 + 5. 9 – 4. 3 GPa – σ = 0. 319 • Tantala fit values after correction – E = 158. 6 + 4. 4 – 3. 0 GPa – σ = 0. 233
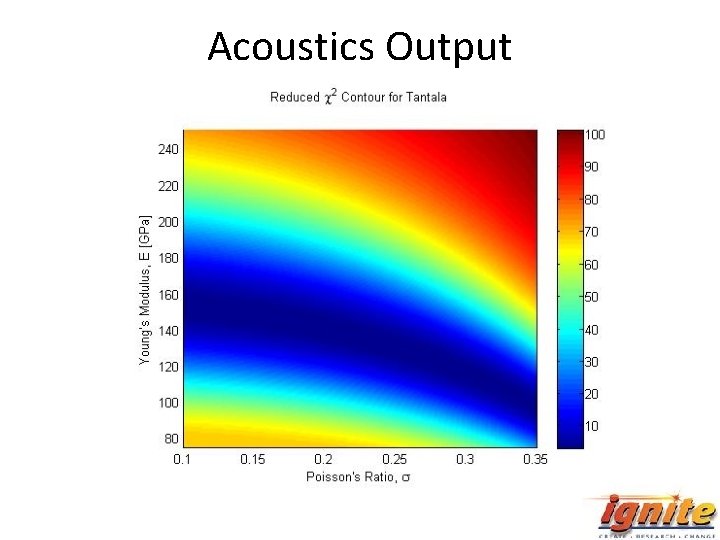
Acoustics Output
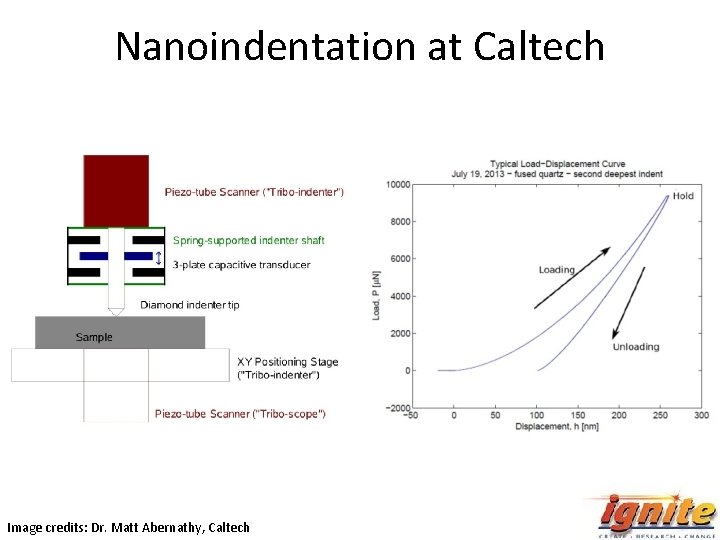
Nanoindentation at Caltech Image credits: Dr. Matt Abernathy, Caltech
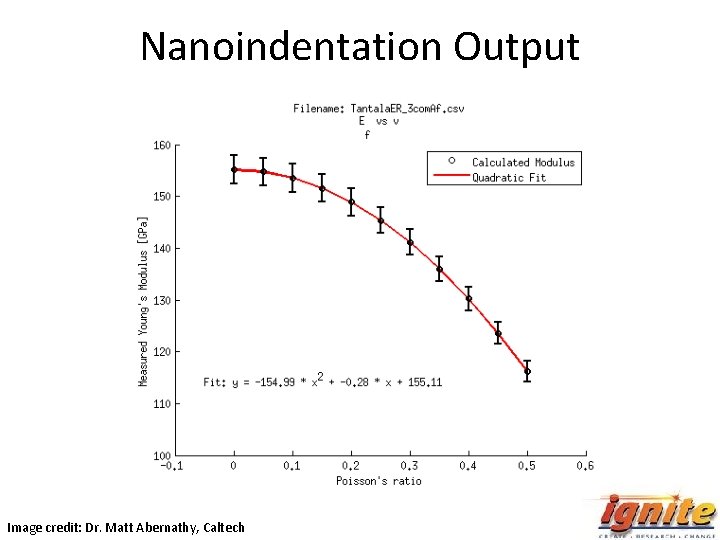
Nanoindentation Output Image credit: Dr. Matt Abernathy, Caltech
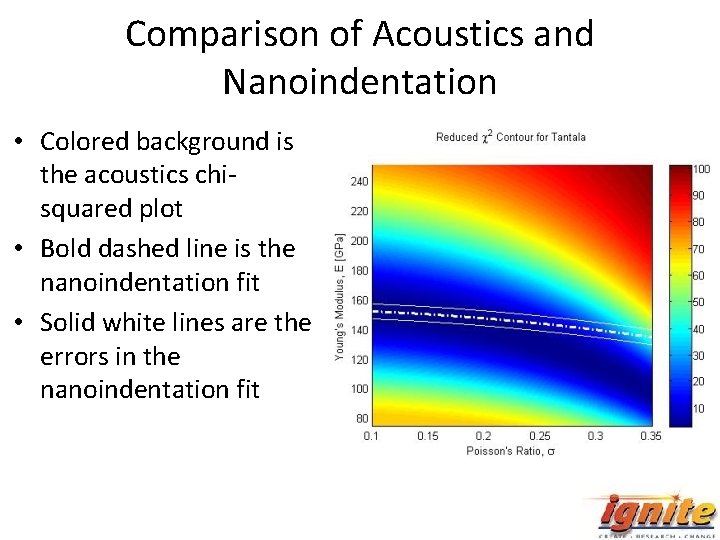
Comparison of Acoustics and Nanoindentation • Colored background is the acoustics chisquared plot • Bold dashed line is the nanoindentation fit • Solid white lines are the errors in the nanoindentation fit
Future Work • Take more data with acoustics setup • Continued collaboration with Matt Abernathy to finish nanoindentation analysis • Use techniques described to combine acoustics and nanoindentation to get results for a variety of samples
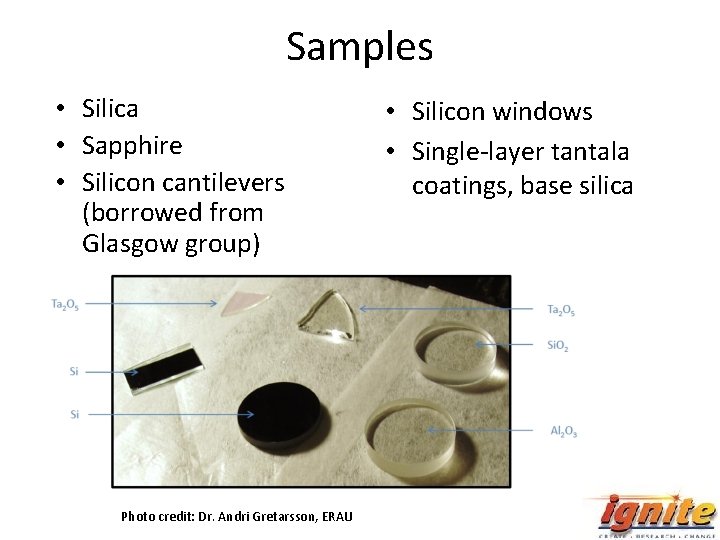
Samples • Silica • Sapphire • Silicon cantilevers (borrowed from Glasgow group) Photo credit: Dr. Andri Gretarsson, ERAU • Silicon windows • Single-layer tantala coatings, base silica
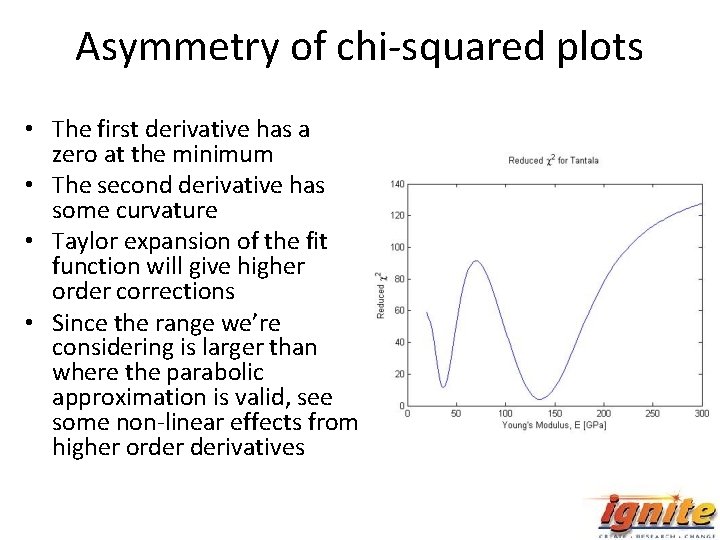
Asymmetry of chi-squared plots • The first derivative has a zero at the minimum • The second derivative has some curvature • Taylor expansion of the fit function will give higher order corrections • Since the range we’re considering is larger than where the parabolic approximation is valid, see some non-linear effects from higher order derivatives