Measuring Economic Wellness Another Method Measuring Price Stability

Measuring Economic Wellness: Another Method: Measuring Price Stability

Price Stability • one of the main economic goals of national governments • if prices rise faster than incomes, people cannot afford to purchase goods • results: drop in sales=drop in production=slowdowns, shut downs=job losses=reduced tax revenues, etc.

Inflation • the persistent rise in the general level of prices • prices increase annually for variety of reasons • Examples: - increasing consumer demand (shifts demand curves upward to the left=prices rise) - increases in prices of productive resources (ie. land, labour, capital) as they become scarcer

The C. P. I. • C. P. I. = Consumer Price Index • used by Canadian gov’t to track inflation • measures the percentage change in prices of consumer goods between one year and the next (aka the inflation rate)

Calculating the C. P. I. • Stats. Can collects data on a representative “shopping basket” of 600 consumer goods/services • typical “household” assumed to be urban with 4 members per household

• each of the 600 items placed in one of 8 categories • each category is “weighted” based on how much the typical household tends to spend on items in that category

Recreation, education and reading 11. 2% Categories for Calculating Canada’s CPI, 2012 Food 15. 99% Alcohol and tobacco products 2. 91% Health and personal care 4. 95% Transportation 20. 6% Shelter 27. 49% Household operations, furnishings and equipment 11. 55% Clothing and footwear 5. 31%

Using the CPI to Calculate the Inflation Rate •

A quick example: •

So What, you ask? • Who uses the CPI and why? • Governments, labour unions, wage earners, pensioners • CPI/inflation rate used to figure out how wages and pensions should be adjusted to account for inflation (ex. during contract negotiations)
 • “indexing”– increase wages/pensions at same rate as inflation to")
COLA (? ? ) • “indexing”– increase wages/pensions at same rate as inflation to cover increased costs caused by inflation • aka “C. O. L. A. ” = Cost of Living Allowance • Can be fully indexed or partially indexed
 many households do not match the norms of Stats.")
Limitations of the CPI a) many households do not match the norms of Stats. Can’s “typical” household • Ex. family size, smoking vs. non-smoking, Arctic vs. Southern Canada, etc. b) spending habits/products can change, often rapidly, over time – basket items and weights need to be updated periodically – can they keep pace with reality? c) multi-culturalism: expenses of maintaining one’s unique cultural practices may be greater than CPI compensates for – pension/wage indexing may “understate” one’s actual cost of living

Other Inflation Tidbits: • “core rate of inflation” – basket of goods has most volatile elements removed • fruit, vegetables, fuel oil, gasoline, natural gas, mortgage interest, intercity transp. , tobacco • Federal gov’t & Bank of Canada watch core rate most closely

• “target rate of inflation”: Bank of Canada tries to keep core rate between 1% - 3% (ideally 2%) • Bo. C uses interest rates to keep inflation within target area (raises rates if inflation too high, lowers rates if inflation too low)

• “deflation”: prices falling rather than rising annually • in short run, OK – industry productivity & efficiency rising (ex. 19 th C. England) • could result in spiralling (uncontrollable) decreases as people keep putting off purchases • sales drop, layoffs, closures, reduced revenues & taxes, etc.

• “stagflation”: inflation rising but economic growth, purchasing power stagnating • 1970’s: rising oil prices drive up prices generally – drop in consumer spending, layoffs, etc. • profits, wealth transferred out of Cdn. economy into oil producing countries

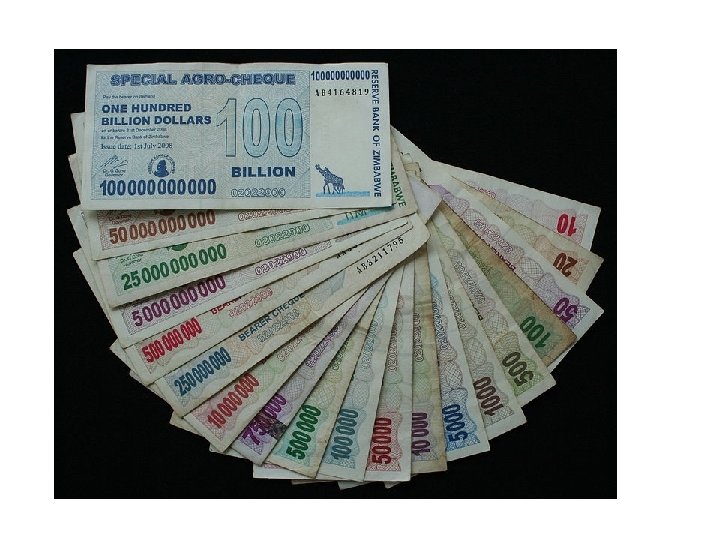
• “hyperinflation”: vicious cycle of rapidly increasing prices • extreme ex. of “too many dollars chasing too few goods” : gov’ts print money to stimulate demand BUT • demand doesn’t grow fast enough – value of currency drops

• Examples • 1920’s Ger. : inflation hits 3. 25 million % per month • 1940’s Hungary: 4. 19 quintillion (10 18) % per month • 1993: Yugoslavia issues a 500 billion dinar bill • 2008: Zimbabwe at 6. 5 sextillion (10 21 )% per month - one US dollar buys 1 billion Zimbabwean dollars (at par in 1983) • 2009 - 2014: Zimbabwe has no national currency – other world currencies are used in everyday business
 Date Rate")
Zimbabwean inflation rates since independence (official up to Jul. 2008, estimates thereafter) Date Rate Date Rate 1980 7% 1986 15% 1992 40% 1998 48% 2004 132. 75% 2008 Sep. 3, 840, 000, 000% 1981 14% 1987 10% 1993 20% 1999 56. 9% 2005 585. 84% 2008 Mid-Nov. 89, 700, 000, 000% 1982 15% 1988 7. 3% 1994 25% 2000 55. 22% 2006 1, 281. 11% 1983 19% 1989 14% 1995 28% 2001 112. 1% 2007 66, 212. 3% 1984 10% 1990 17% 1996 16% 2002 198. 93% 2008 Jul. 231, 150, 888. 87% 1985 10% 1991 48% 1997 20% 2003 598. 75% 2008 Aug. 471, 000, 000%

Thinking Like an Economist: Practicing the CPI • Read p. 208 – 209 “Constructing a Price Index”, then answer Qu. 1 on p. 209 • Read “Indexing to the CPI” on p. 211, then answer Qu. ’s #1 & 2 on p. 211
- Slides: 21