
Measuring Economic Policy Uncertainty Scott R Baker Northwestern
Measuring Economic Policy Uncertainty Scott R. Baker (Northwestern) Nick Bloom (Stanford & NBER) Steve Davis (Chicago & NBER) Yale, March 29 th 2016 Scott Baker, Nick Bloom and Steve Davis

Resurgence of uncertainty research since 2008 1. Great Recession: generated a large spike in uncertainty proxies, ending the Great Moderation (1984 -2007) and probably contributing to the recession itself 2. Faster computers: can run models with higher moments 3. More data: high-frequency trading, surveys, text-search etc Scott Baker, Nick Bloom and Steve Davis
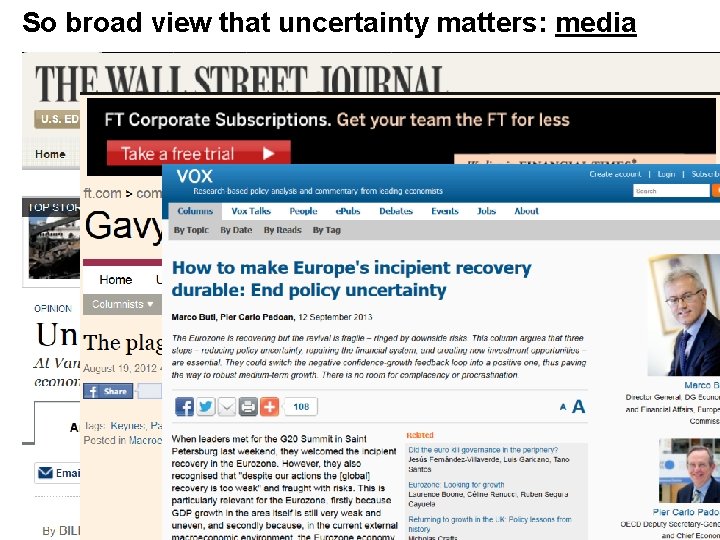
So broad view that uncertainty matters: media
But for some people the best evidence that uncertainty is important that…. Scott Baker, Nick Bloom and Steve Davis
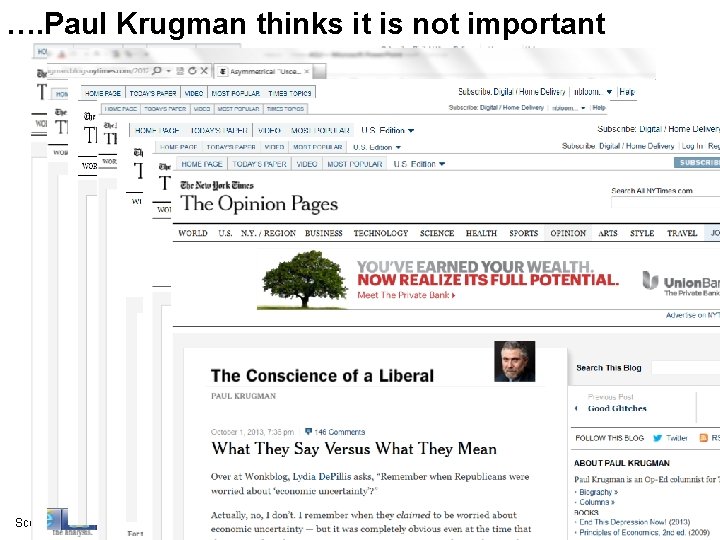
…. Paul Krugman thinks it is not important Scott Baker, Nick Bloom and Steve Davis
This paper tries to investigate two questions • Uncertainty: Can we measure (policy) uncertainty in the US, what does this look like and does it matter? • News: Can we use news (and text search more generally) to create data (some back to 1880 s)? Scott Baker, Nick Bloom and Steve Davis 6
1) Measuring policy uncertainty 2) Evaluating our measure 3) Estimating the impact of policy uncertainty 4) Why policy uncertainty changes over time Scott Baker, Nick Bloom and Steve Davis

Measuring uncertainty is hard – ideally we would proxy at least four types of policy uncertainty • Uncertainty about who will make economic policy decisions – e. g. , who will win the next elections? • Uncertainty about what economic policy actions decision makers will undertake, and when. • Uncertainty about the economic effects of policy actions – past, present and future actions Scott Baker, Nick Bloom and Steve Davis 8
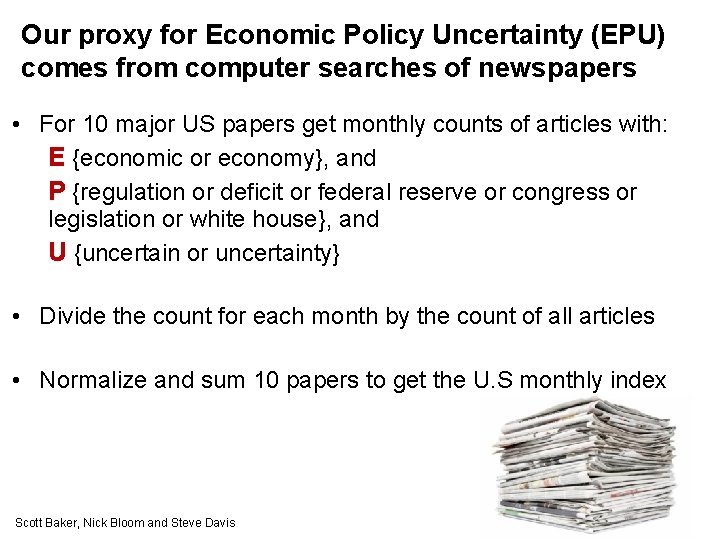
Our proxy for Economic Policy Uncertainty (EPU) comes from computer searches of newspapers • For 10 major US papers get monthly counts of articles with: E {economic or economy}, and P {regulation or deficit or federal reserve or congress or legislation or white house}, and U {uncertain or uncertainty} • Divide the count for each month by the count of all articles • Normalize and sum 10 papers to get the U. S monthly index Scott Baker, Nick Bloom and Steve Davis
Constructing our US News-Based EPU Index Newspapers: • Boston Globe • Chicago Tribune • Dallas Morning News • Los Angeles Times • Miami Herald • • • New York Times SF Chronicle USA Today Wall Street Journal Washington Post Note: We use Access World Newsbank Service when constructing a daily EPU Index, because the daily index requires a higher density of news sources. Scott Baker, Nick Bloom and Steve Davis 10
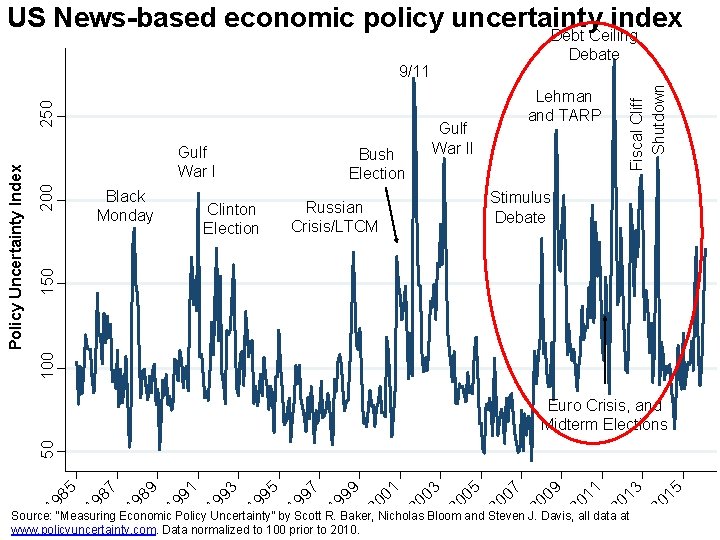
US News-based economic policy uncertainty index Black Monday Clinton Election Bush Election Russian Crisis/LTCM Stimulus Debate 150 200 Gulf War II Lehman and TARP 100 Policy Uncertainty Index 250 9/11 Fiscal Cliff Shutdown Debt Ceiling Debate 19 91 19 93 19 95 19 97 19 99 20 01 20 03 20 05 20 07 20 09 20 11 20 13 20 15 89 19 87 19 19 85 50 Euro Crisis, and Midterm Elections Source: “Measuring Economic Policy Uncertainty” by Scott R. Baker, Nicholas Bloom and Steven J. Davis, all data at Scott Baker, Nick Bloom and Steve Davis www. policyuncertainty. com. Data normalized to 100 prior to 2010.
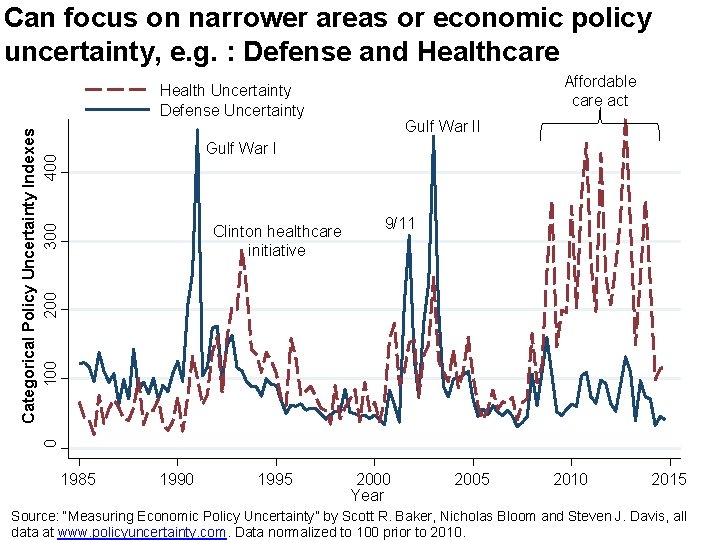
Can focus on narrower areas or economic policy uncertainty, e. g. : Defense and Healthcare Affordable care act Categorical Policy Uncertainty Indexes 0 400 100 200 300 Health Uncertainty Defense Uncertainty Gulf War II Gulf War I Clinton healthcare initiative 1985 1990 1995 9/11 2000 Year 2005 2010 2015 12 Source: “Measuring Economic Policy Uncertainty” by Scott R. Baker, Nicholas Bloom and Steven J. Davis, all Scott Baker, Nick Bloom and Steve Davis data at www. policyuncertainty. com. Data normalized to 100 prior to 2010.
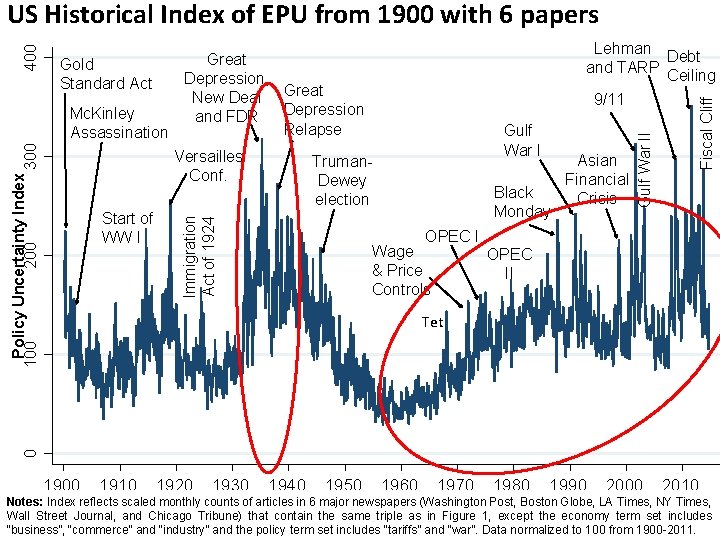
Gulf War I Black Monday Start of WW I Immigration Act of 1924 election OPEC I Wage & Price Controls Gulf War II 9/11 Asian Financial Crisis Fiscal Cliff Lehman Debt and TARP Ceiling Great Gold Depression, Standard Act New Deal Great Depression Mc. Kinley and FDR Relapse Assassination Versailles Truman. Conf. Dewey 200 Policy Uncertainty Index 300 400 US Historical Index of EPU from 1900 with 6 papers OPEC II 0 100 Tet 1900 1910 1920 1930 1940 1950 1960 1970 1980 1990 2000 2010 Notes: Index reflects scaled monthly counts of articles in 6 major newspapers (Washington Post, Boston Globe, LA Times, NY Times, Wall Street Journal, and Chicago Tribune) that contain the same triple as in Figure 1, except the economy term set includes Scott Baker, Nick Bloom and Steve Davis “business”, “commerce” and “industry” and the policy term set includes “tariffs” and “war”. Data normalized to 100 from 1900 -2011.
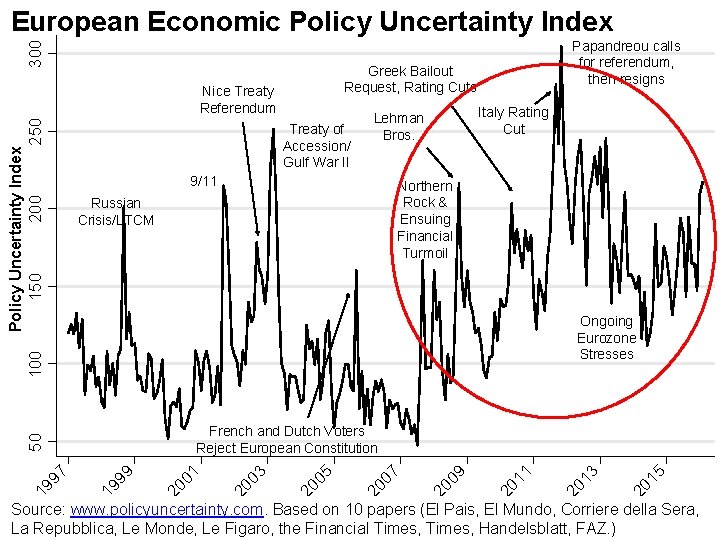
300 European Economic Policy Uncertainty Index Greek Bailout Request, Rating Cuts 250 Nice Treaty Referendum Treaty of Accession/ Gulf War II 9/11 Northern Rock & Ensuing Financial Turmoil Russian Crisis/LTCM 150 200 Italy Rating Cut Lehman Bros. Ongoing Eurozone Stresses 100 15 20 13 11 20 09 20 07 20 05 20 03 20 01 20 99 19 19 97 50 French and Dutch Voters Reject European Constitution 20 Policy Uncertainty Index Papandreou calls for referendum, then resigns Source: www. policyuncertainty. com. Based on 10 papers (El Pais, El Mundo, Corriere della Sera, Scott Baker, Nick Bloom and Steve Davis La Repubblica, Le Monde, Le Figaro, the Financial Times, Handelsblatt, FAZ. )
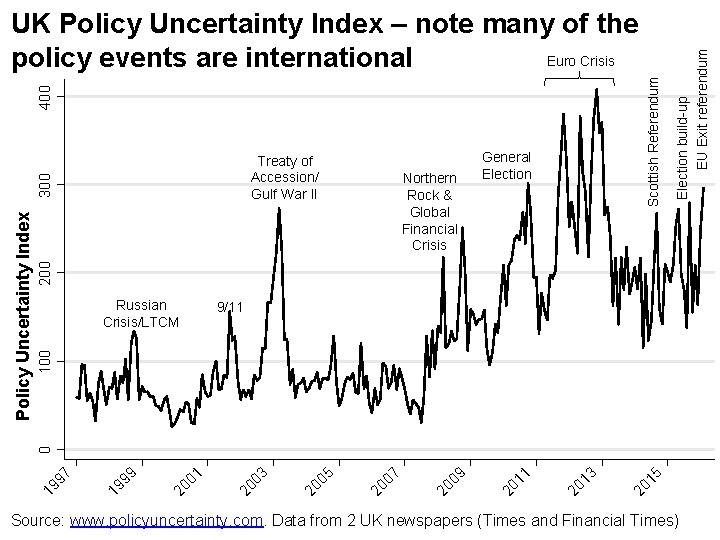
200 Northern Rock & Global Financial Crisis General Election 9/11 100 Russian Crisis/LTCM 15 20 13 20 11 20 09 20 07 20 05 20 03 20 01 20 99 19 19 97 0 Policy Uncertainty Index 300 Treaty of Accession/ Gulf War II Election build-up EU Exit referendum 400 Scottish Referendum UK Policy Uncertainty Index – note many of the Euro Crisis policy events are international Source: www. policyuncertainty. com. Data from 2 UK newspapers (Times and Financial Times) Scott Baker, Nick Bloom and Steve Davis
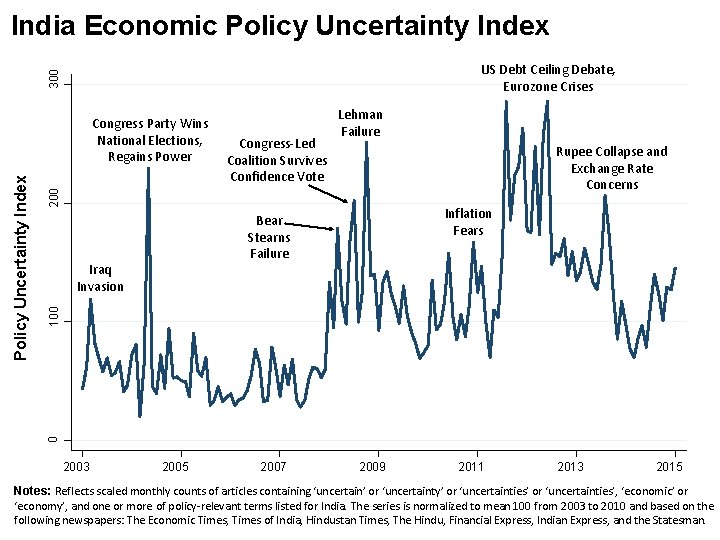
India Economic Policy Uncertainty Index 300 US Debt Ceiling Debate, Eurozone Crises Rupee Collapse and Exchange Rate Concerns 200 Congress-Led Coalition Survives Confidence Vote Lehman Failure Inflation Fears Bear Stearns Failure 100 Iraq Invasion 0 Policy Uncertainty Index Congress Party Wins National Elections, Regains Power 2003 2005 2007 2009 2011 2013 2015 Notes: Reflects scaled monthly counts of articles containing ‘uncertain’ or ‘uncertainty’ or ‘uncertainties’, ‘economic’ or ‘economy’, and one or more of policy-relevant terms listed for India. The series is normalized to mean 100 from 2003 to 2010 and based on the following newspapers: The Economic Times, Times of India, Hindustan Times, The Hindu, Financial Express, Indian Express, and the Statesman. Scott Baker, Nick Bloom and Steve Davis
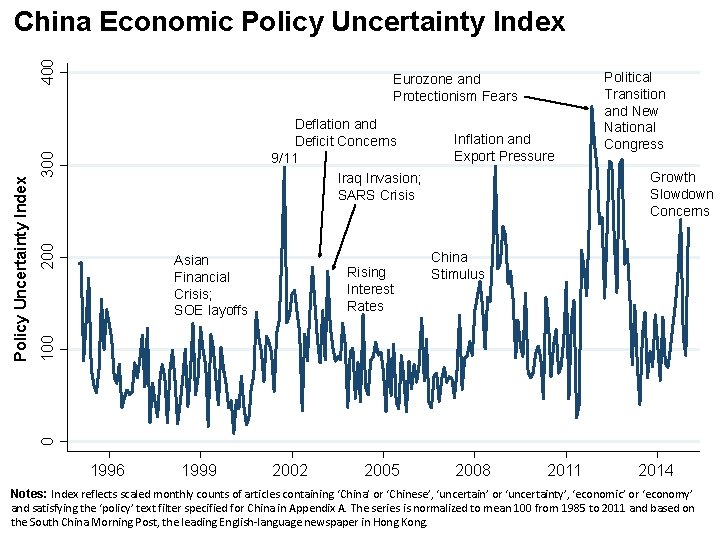
Eurozone and Protectionism Fears 200 300 Deflation and Deficit Concerns 9/11 Iraq Invasion; SARS Crisis Asian Financial Crisis; SOE layoffs Growth Slowdown Concerns China Stimulus 100 Rising Interest Rates Inflation and Export Pressure Political Transition and New National Congress 0 Policy Uncertainty Index 400 China Economic Policy Uncertainty Index 1996 1999 2002 2005 2008 2011 2014 Notes: Index reflects scaled monthly counts of articles containing ‘China’ or ‘Chinese’, ‘uncertain’ or ‘uncertainty’, ‘economic’ or ‘economy’ and satisfying the ‘policy’ text filter specified for China in Appendix A. The series is normalized to mean 100 from 1985 to 2011 and based on the South China Morning Post, the leading English-language newspaper in Hong Kong. Scott Baker, Nick Bloom and Steve Davis
Scott Baker, Nick Bloom and Steve Davis 14 20 13 20 12 20 11 20 10 20 09 20 08 20 07 20 06 20 05 20 04 20 03 20 50 100 150 200 Policy Uncertainty Index 250 North Korean Economic Policy Uncertainty Index
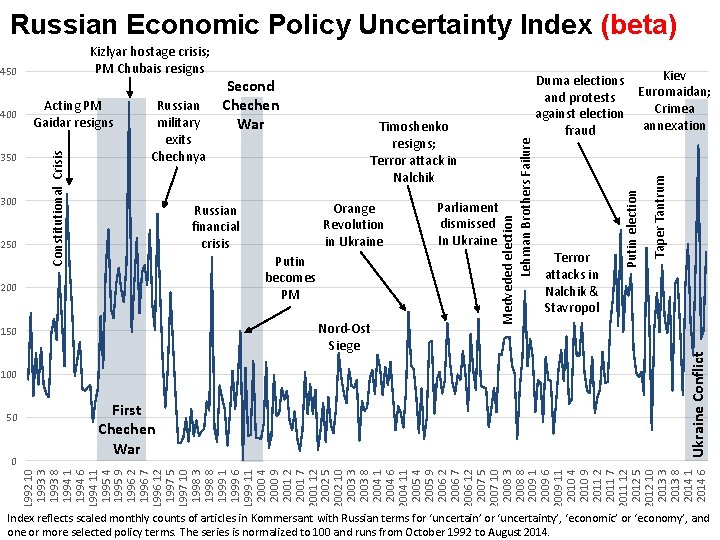
300 250 Russian military exits Chechnya Putin becomes PM Nord-Ost Siege 150 100 First Chechen War Parliament dismissed In Ukraine Terror attacks in Nalchik & Stavropol 1992 10 1993 3 1993 8 1994 1 1994 6 1994 11 1995 4 1995 9 1996 2 1996 7 1996 12 1997 5 1997 10 1998 3 1998 8 1999 1 1999 6 1999 11 2000 4 2000 9 2001 2 2001 7 2001 12 2002 5 2002 10 2003 3 2003 8 2004 1 2004 6 2004 11 2005 4 2005 9 2006 2 2006 7 2006 12 2007 5 2007 10 2008 3 2008 8 2009 1 2009 6 2009 11 2010 4 2010 9 2011 2 2011 7 2011 12 2012 5 2012 10 2013 3 2013 8 2014 1 2014 6 0 Orange Revolution in Ukraine Russian financial crisis 200 50 Timoshenko resigns; Terror attack in Nalchik Kiev Duma elections Euromaidan; and protests Crimea against election annexation fraud Ukraine Conflict 350 Acting PM Gaidar resigns Constitutional Crisis 400 Second Chechen War Taper Tantrum 450 Putin election Kizlyar hostage crisis; PM Chubais resigns Medveded election Lehman Brothers Failure Russian Economic Policy Uncertainty Index (beta) 19 and Index reflects scaled monthly counts of articles in Kommersant with Russian terms for ‘uncertain’ or ‘uncertainty’, ‘economic’ or ‘economy’, Scott Baker, Nick Bloom and Steve Davis one or more selected policy terms. The series is normalized to 100 and runs from October 1992 to August 2014.
1) Measuring policy uncertainty 2) Evaluating our measure 3) Estimating the impact of policy uncertainty 4) Why policy uncertainty changes over time Scott Baker, Nick Bloom and Steve Davis
A) Evaluation of Policy Uncertainty Index: Market Use Market use suggests some information in our EPU data I) Numerous users including: Goldman Sachs, Citibank, JP Morgan, Blackrock, Wells Fargo, IMF, Fed, ECB etc II) This has led Bloomberg, FRED, Reuters and Haver to stream our data for their financial and policy users Scott Baker, Nick Bloom and Steve Davis
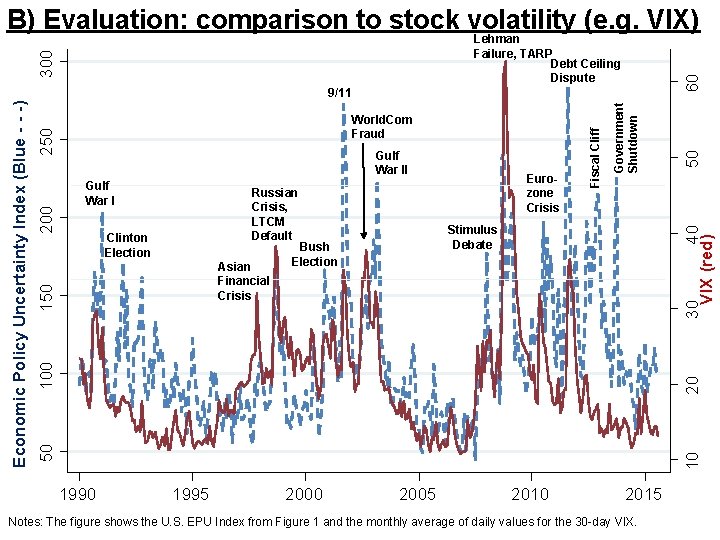
B) Evaluation: comparison to stock volatility (e. g. VIX) Russian Crisis, LTCM Default Bush Election Asian Clinton Election Eurozone Crisis 50 60 Stimulus Debate 30 40 VIX (red) Gulf War I Fiscal Cliff Gulf War II Financial Crisis 20 100 150 200 250 World. Com Fraud 10 50 Economic Policy Uncertainty Index (Blue - - -) 9/11 Government Shutdown 300 Lehman Failure, TARP Debt Ceiling Dispute 1990 1995 2000 2005 2010 2015 Notes: The figure shows the U. S. EPU Index from Figure 1 and the monthly average of daily values for the 30 -day VIX. Scott Baker, Nick Bloom and Steve Davis
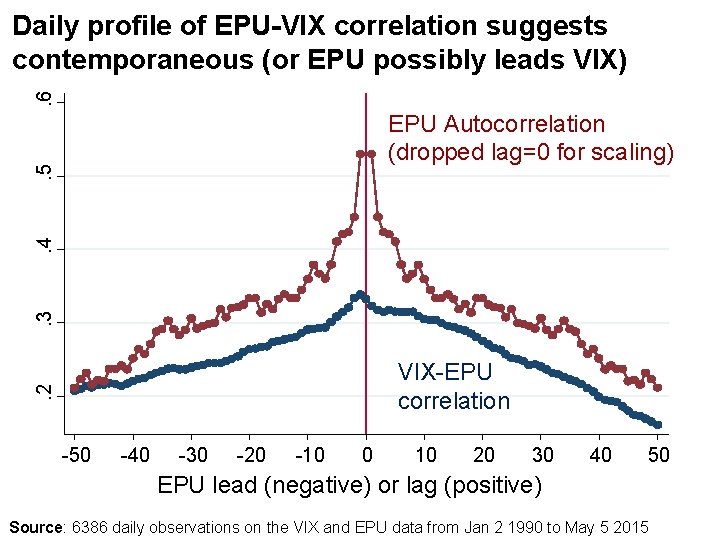
. 6 Daily profile of EPU-VIX correlation suggests contemporaneous (or EPU possibly leads VIX) . 3 . 4 . 5 EPU Autocorrelation (dropped lag=0 for scaling) . 2 VIX-EPU correlation -50 -40 -30 -20 -10 0 10 20 30 40 50 EPU lead (negative) or lag (positive) Scott Baker, Nick Bloom and Steve Davis Source: 6386 daily observations on the VIX and EPU data from Jan 2 1990 to May 5 2015
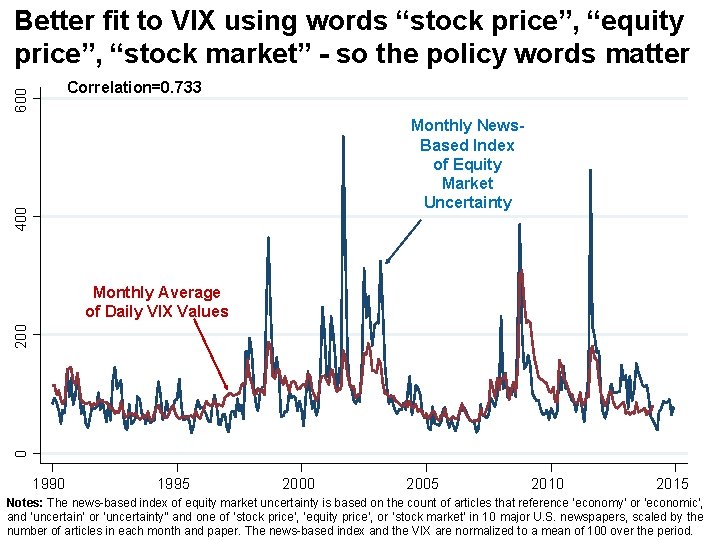
Better fit to VIX using words “stock price”, “equity price”, “stock market” - so the policy words matter 600 Correlation=0. 733 400 Monthly News. Based Index of Equity Market Uncertainty 0 200 Monthly Average of Daily VIX Values 1990 1995 2000 2005 2010 2015 Notes: The news-based index of equity market uncertainty is based on the count of articles that reference ‘economy’ or ‘economic’, and ‘uncertain’ or ‘uncertainty” and one of ‘stock price’, ‘equity price’, or ‘stock market’ in 10 major U. S. newspapers, scaled by the Scott Baker, Nick Bloom and Steve Davis number of articles in each month and paper. The news-based index and the VIX are normalized to a mean of 100 over the period.
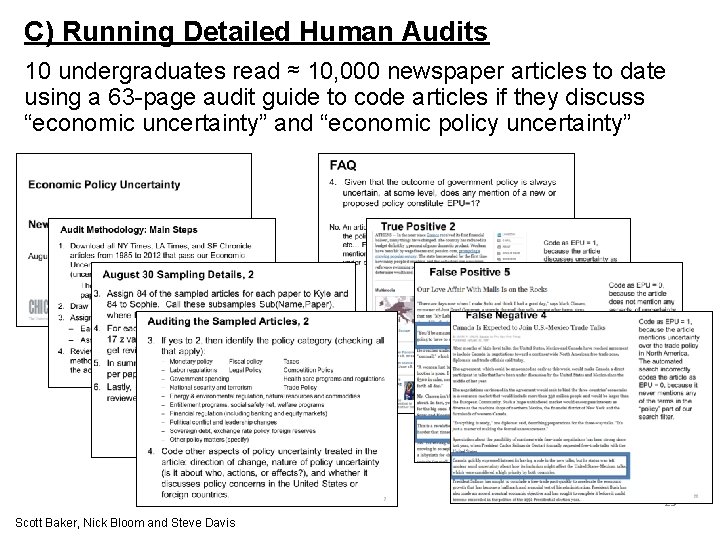
C) Running Detailed Human Audits 10 undergraduates read ≈ 10, 000 newspaper articles to date using a 63 -page audit guide to code articles if they discuss “economic uncertainty” and “economic policy uncertainty” 25 Scott Baker, Nick Bloom and Steve Davis
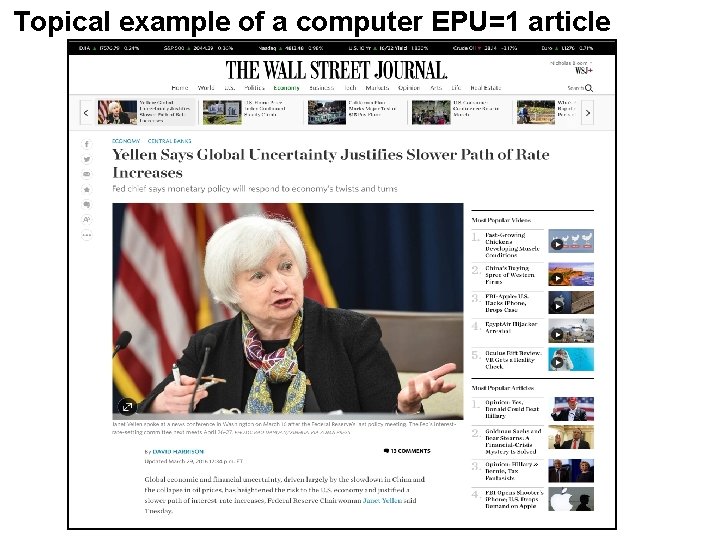
Topical example of a computer EPU=1 article Scott Baker, Nick Bloom and Steve Davis
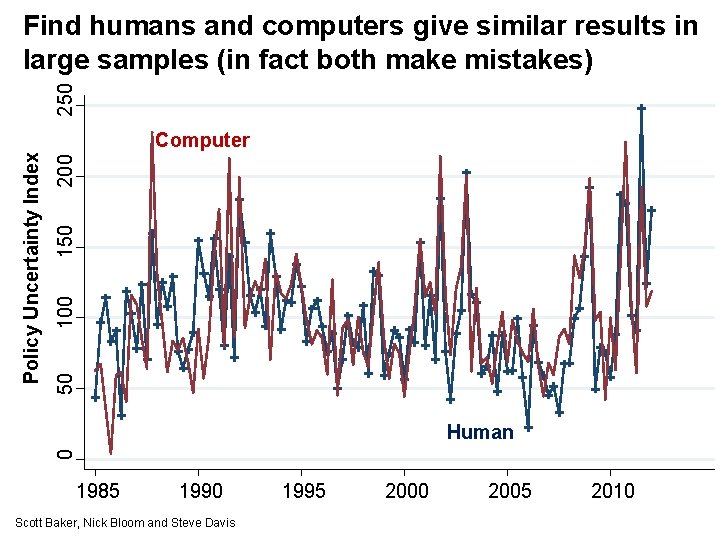
250 Find humans and computers give similar results in large samples (in fact both make mistakes) 200 150 100 50 Policy Uncertainty Index Computer 0 Human 1985 1990 Scott Baker, Nick Bloom and Steve Davis 1995 2000 2005 2010
Other Audit Results • Correlation of “error” (computer EPU-human EPU) and GDP growth rate = -0. 06 (p-value 0. 339) • Among EPU=1 articles: – 4% are mainly about low or declining uncertainty – 73% discuss uncertainty about what or when – 32% discuss uncertainty about effects – 20% discuss uncertainty about who (15% in non-election years, 37% in election years) Scott Baker, Nick Bloom and Steve Davis 28
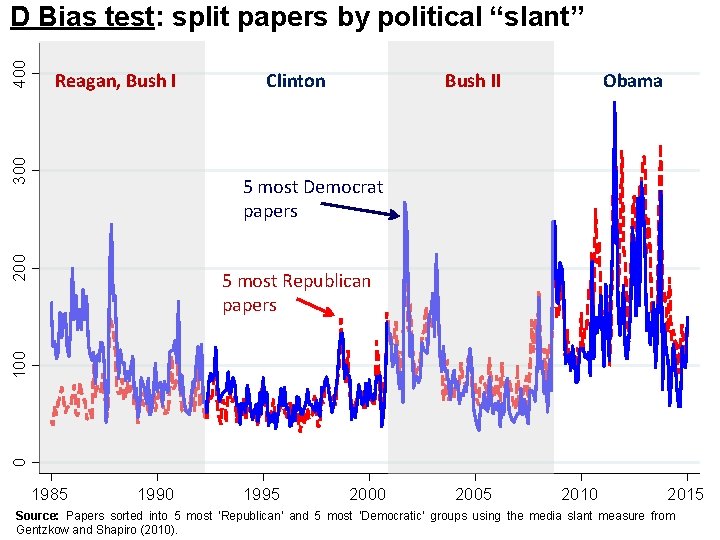
Reagan, Bush I 300 400 D Bias test: split papers by political “slant” Clinton Bush II Obama 200 5 most Democrat papers 0 100 5 most Republican papers 1985 1990 1995 2000 2005 2010 2015 Source: Papers sorted into 5 most ‘Republican’ and 5 most ‘Democratic’ groups using the media slant measure from Scott Baker, Nick Bloom and Steve Davis Gentzkow and Shapiro (2010).
1) Measuring policy uncertainty 2) Evaluating our measure 3) Estimating the impact of policy uncertainty 4) Why policy uncertainty changes over time Scott Baker, Nick Bloom and Steve Davis
Uncertainty matters in non-linear models – classic effect channels in the literature are mostly negative Negative Uncertainty Effects - Utility functions (risk-aversion, e. g. Tobin (1958)) - Adjustment costs (real options Bernanke(1983), Dixit & Pindyck(1994)) - Financial frictions (e. g. Gilchrist et al. (2010)) - Ambiguity (robustness, e. g. Hansen & Sargent, Ilut & Schneider) Positive Uncertainty Effects - Production functions (Oi-Hartman-Abel effects) - Bankruptcy (Growth options) Scott Baker, Nick Bloom and Steve Davis
Evidence for impact of policy uncertainty • Surveys (suggestive but vague) • Microdata (firm-level panel identification, but narrow channel) • Macrodata (VAR overall “effect”, but weak identification) Scott Baker, Nick Bloom and Steve Davis
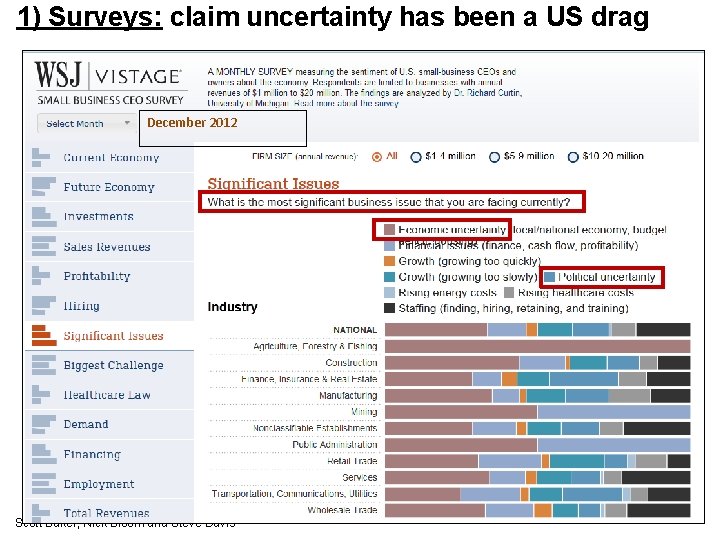
1) Surveys: claim uncertainty has been a US drag December 2012 Scott Baker, Nick Bloom and Steve Davis
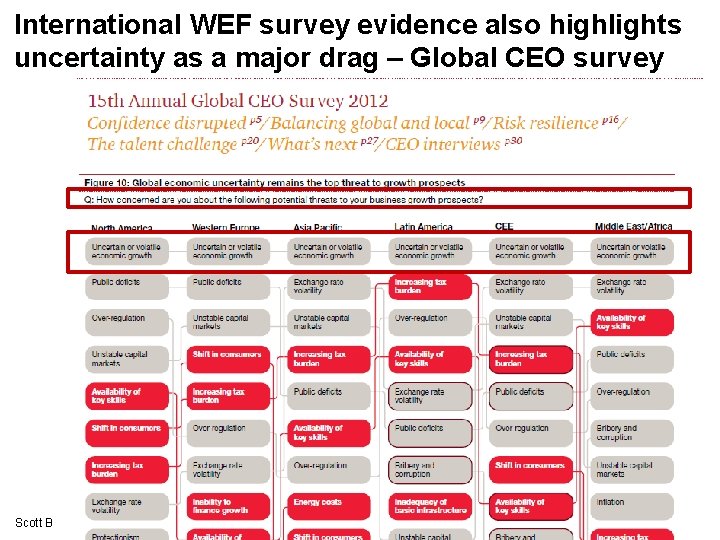
International WEF survey evidence also highlights uncertainty as a major drag – Global CEO survey Scott Baker, Nick Bloom and Steve Davis
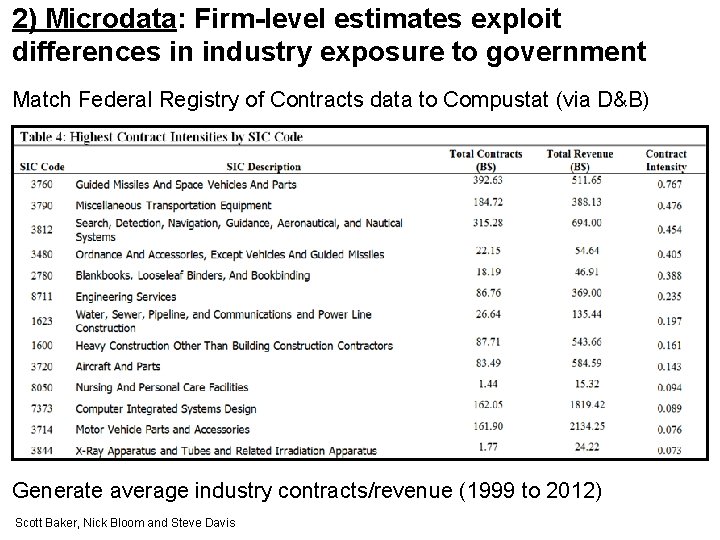
2) Microdata: Firm-level estimates exploit differences in industry exposure to government Match Federal Registry of Contracts data to Compustat (via D&B) Generate average industry contracts/revenue (1999 to 2012) Scott Baker, Nick Bloom and Steve Davis
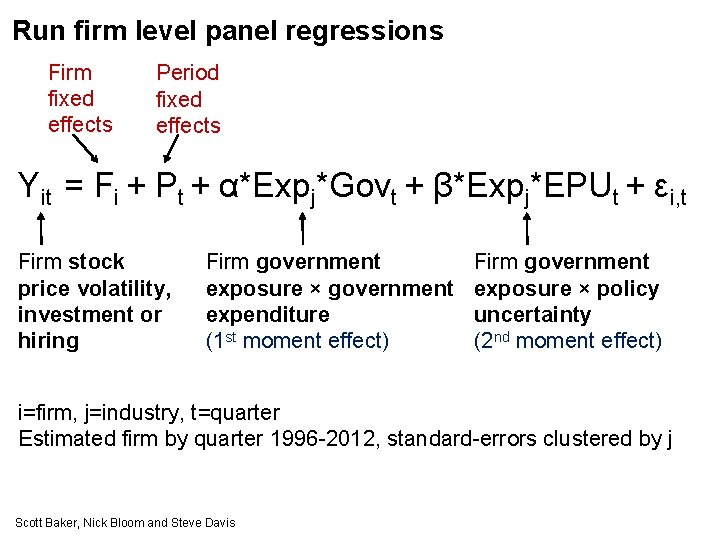
Run firm level panel regressions Firm fixed effects Period fixed effects Yit = Fi + Pt + α*Expj*Govt + β*Expj*EPUt + εi, t Firm stock price volatility, investment or hiring Firm government exposure × government expenditure (1 st moment effect) Firm government exposure × policy uncertainty (2 nd moment effect) i=firm, j=industry, t=quarter Estimated firm by quarter 1996 -2012, standard-errors clustered by j Scott Baker, Nick Bloom and Steve Davis
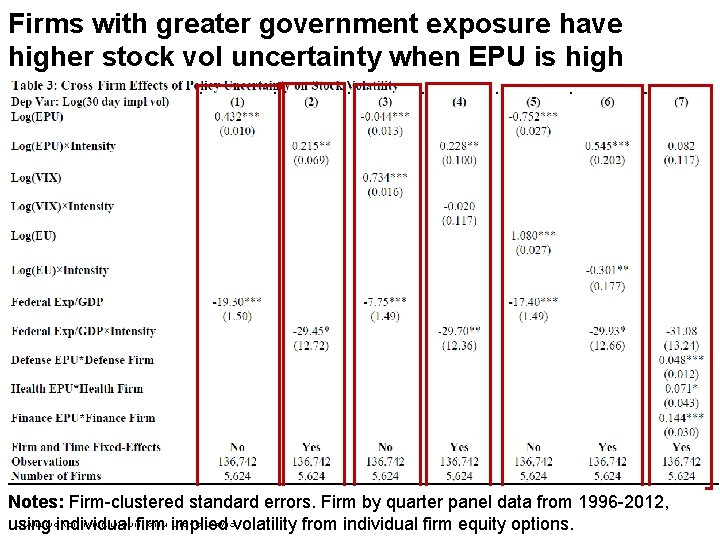
Firms with greater government exposure have higher stock vol uncertainty when EPU is high Notes: Firm-clustered standard errors. Firm by quarter panel data from 1996 -2012, Scott Baker, Nick Bloom and Steve Davis using individual firm implied volatility from individual firm equity options.
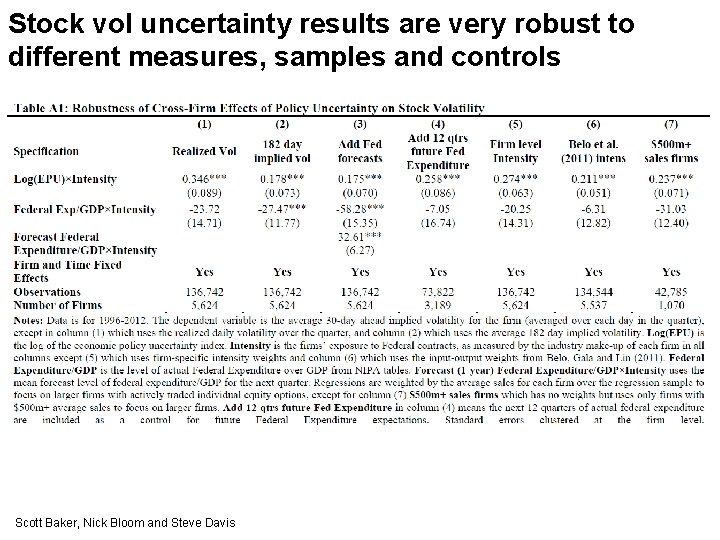
Stock vol uncertainty results are very robust to different measures, samples and controls Scott Baker, Nick Bloom and Steve Davis
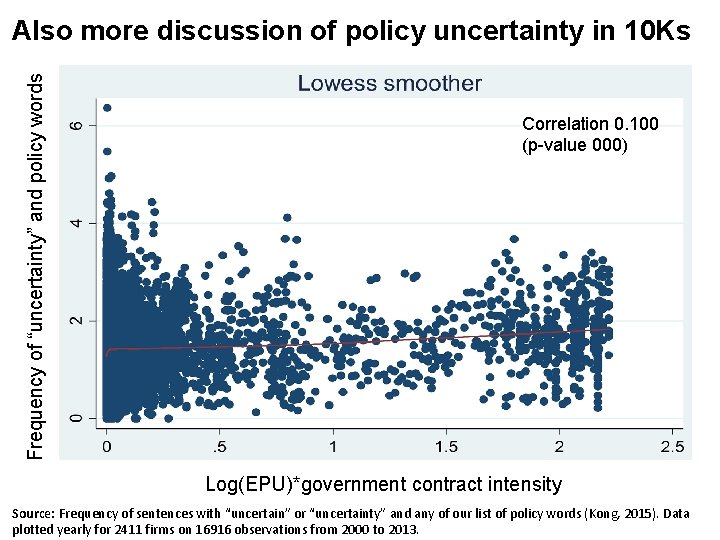
Frequency of “uncertainty” and policy words Also more discussion of policy uncertainty in 10 Ks Correlation 0. 100 (p-value 000) Log(EPU)*government contract intensity Source: Frequency of sentences with “uncertain” or “uncertainty” and any of our list of policy words (Kong, 2015). Data Scott Baker, Nick Bloom and Steve Davis plotted yearly for 2411 firms on 16916 observations from 2000 to 2013.
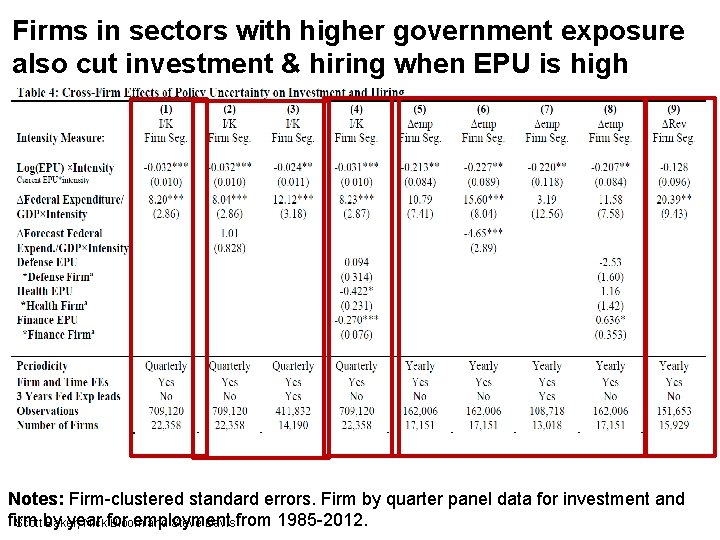
Firms in sectors with higher government exposure also cut investment & hiring when EPU is high Notes: Firm-clustered standard errors. Firm by quarter panel data for investment and firm by year for employment from 1985 -2012. Scott Baker, Nick Bloom and Steve Davis
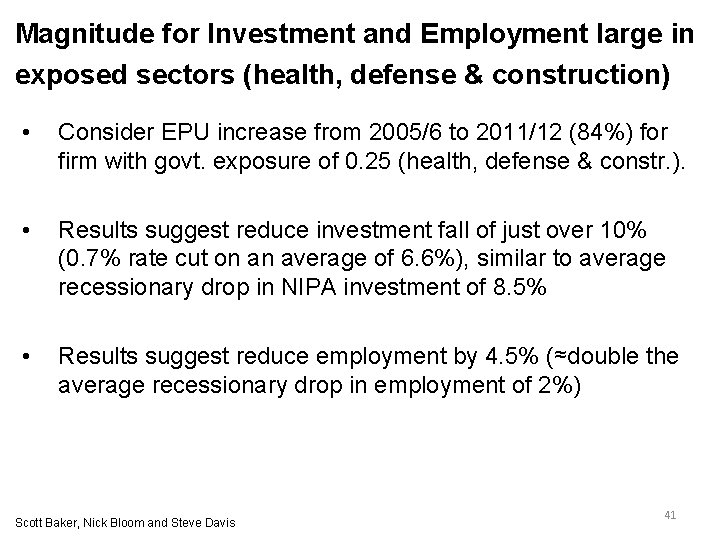
Magnitude for Investment and Employment large in exposed sectors (health, defense & construction) • Consider EPU increase from 2005/6 to 2011/12 (84%) for firm with govt. exposure of 0. 25 (health, defense & constr. ). • Results suggest reduce investment fall of just over 10% (0. 7% rate cut on an average of 6. 6%), similar to average recessionary drop in NIPA investment of 8. 5% • Results suggest reduce employment by 4. 5% (≈double the average recessionary drop in employment of 2%) Scott Baker, Nick Bloom and Steve Davis 41
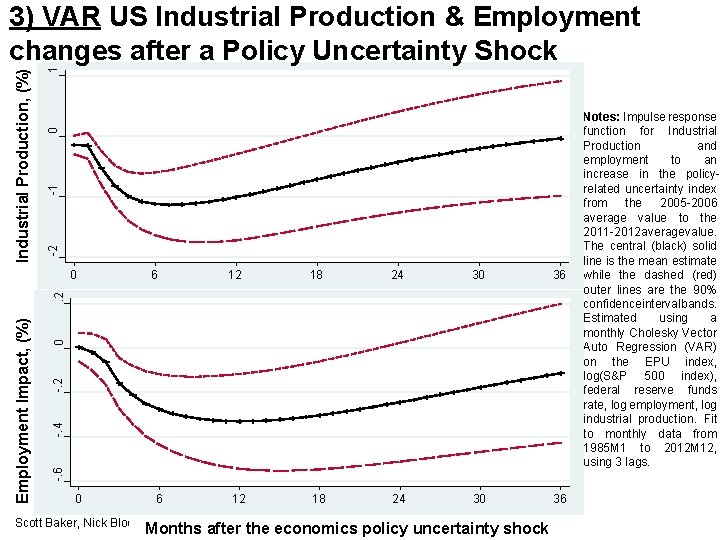
1 0 -1 -2 Industrial Production, (%) 3) VAR US Industrial Production & Employment changes after a Policy Uncertainty Shock 6 12 18 24 30 36 0 -. 2 -. 4 -. 6 Employment Impact, (%) . 2 0 0 6 Scott Baker, Nick Bloom and Steve Davis Months after the economics policy uncertainty shock Notes: Impulse response function for Industrial Production and employment to an increase in the policyrelated uncertainty index from the 2005 -2006 average value to the 2011 -2012 average value. The central (black) solid line is the mean estimate while the dashed (red) outer lines are the 90% confidence interval bands. Estimated using a monthly Cholesky Vector Auto Regression (VAR) on the EPU index, log(S&P 500 index), federal reserve funds rate, log employment, log industrial production. Fit to monthly data from 1985 M 1 to 2012 M 12, using 3 lags.
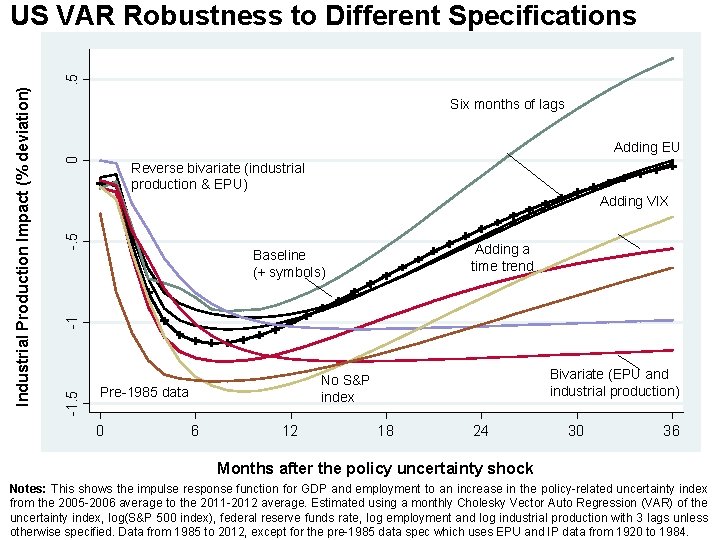
Six months of lags 0 Adding EU Reverse bivariate (industrial production & EPU) -. 5 Adding VIX Adding a time trend Baseline (+ symbols) -1 -1. 5 Industrial Production Impact (% deviation) . 5 US VAR Robustness to Different Specifications Pre-1985 data 0 Bivariate (EPU and industrial production) No S&P index 6 12 18 24 30 36 Months after the policy uncertainty shock Notes: This shows the impulse response function for GDP and employment to an increase in the policy-related uncertainty index from the 2005 -2006 average to the 2011 -2012 average. Estimated using a monthly Cholesky Vector Auto Regression (VAR) of the uncertainty index, log(S&P 500 index), federal reserve funds rate, log employment and log industrial production with 3 lags unless Scott Baker, Nick Bloom and Steve Davis otherwise specified. Data from 1985 to 2012, except for the pre-1985 data spec which uses EPU and IP data from 1920 to 1984.
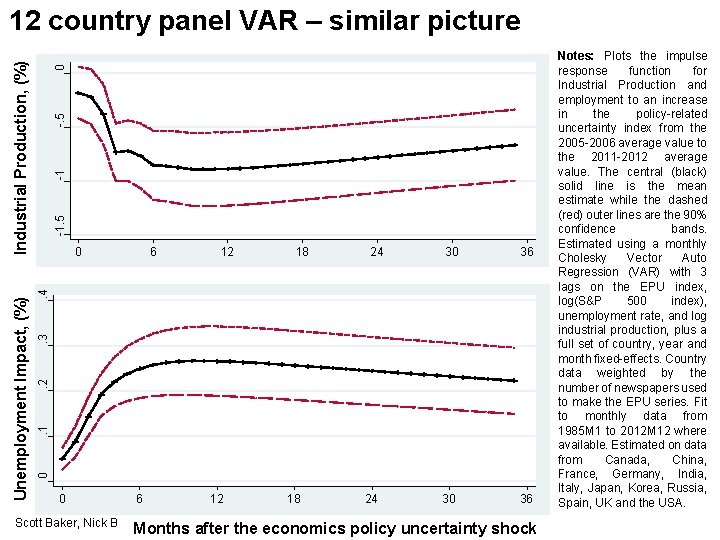
0 -. 5 -1 -1. 5 6 12 18 24 30 36 . 1 . 2 . 3 . 4 0 0 Unemployment Impact, (%) Industrial Production, (%) 12 country panel VAR – similar picture 0 6 12 Scott Baker, Nick Bloom and Steve Davis 18 24 Months after the economics policy uncertainty shock Notes: Plots the impulse response function for Industrial Production and employment to an increase in the policy-related uncertainty index from the 2005 -2006 average value to the 2011 -2012 average value. The central (black) solid line is the mean estimate while the dashed (red) outer lines are the 90% confidence bands. Estimated using a monthly Cholesky Vector Auto Regression (VAR) with 3 lags on the EPU index, log(S&P 500 index), unemployment rate, and log industrial production, plus a full set of country, year and month fixed-effects. Country data weighted by the number of newspapers used to make the EPU series. Fit to monthly data from 1985 M 1 to 2012 M 12 where available. Estimated on data from Canada, China, France, Germany, India, Italy, Japan, Korea, Russia, Spain, UK and the USA.
1) Measuring policy uncertainty 2) Evaluating our measure 3) Estimating the impact of policy uncertainty 4) Why policy uncertainty changes over time Scott Baker, Nick Bloom and Steve Davis
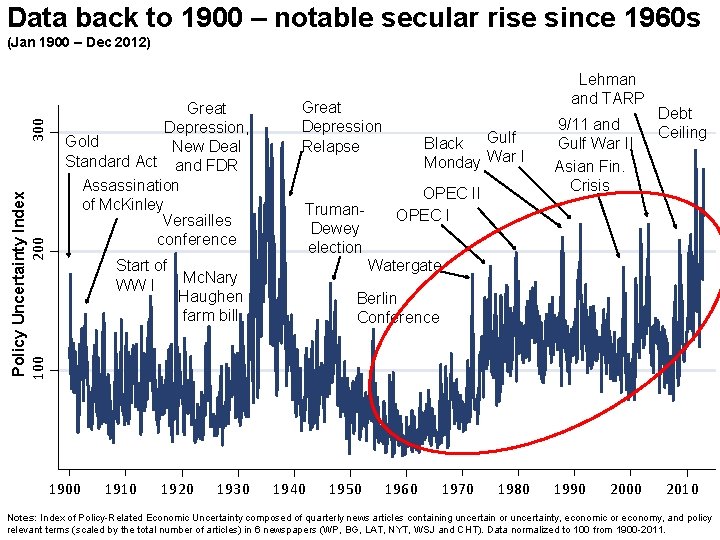
Data back to 1900 – notable secular rise since 1960 s Policy Uncertainty Index 100 200 300 (Jan 1900 – Dec 2012) Great Depression, Gold New Deal Standard Act and FDR Assassination of Mc. Kinley Versailles conference Great Depression Relapse Truman. Dewey election Start of Mc. Nary WW I Haughen farm bill 1900 1910 1920 1930 Lehman and TARP Black Gulf Monday War I OPEC I 9/11 and Gulf War II Asian Fin. Crisis Debt Ceiling Watergate Berlin Conference 1940 1950 1960 1970 1980 1990 2000 2010 Notes: Index of Policy-Related Economic Uncertainty composed of quarterly news articles containing uncertain or uncertainty, economic or economy, and policy Scott Baker, Nick Bloom and Steve Davis relevant terms (scaled by the total number of articles) in 6 newspapers (WP, BG, LAT, NYT, WSJ and CHT). Data normalized to 100 from 1900 -2011.
Appear to be (at least) two broad possible explanations for the secular rise since the 1960 s Rising size of government (“economic drivers”): - Rising share of government expenditure/GDP and regulation Increased political polarization (“political drivers”): - Increasing polarization of congress by various metrics Scott Baker, Nick Bloom and Steve Davis
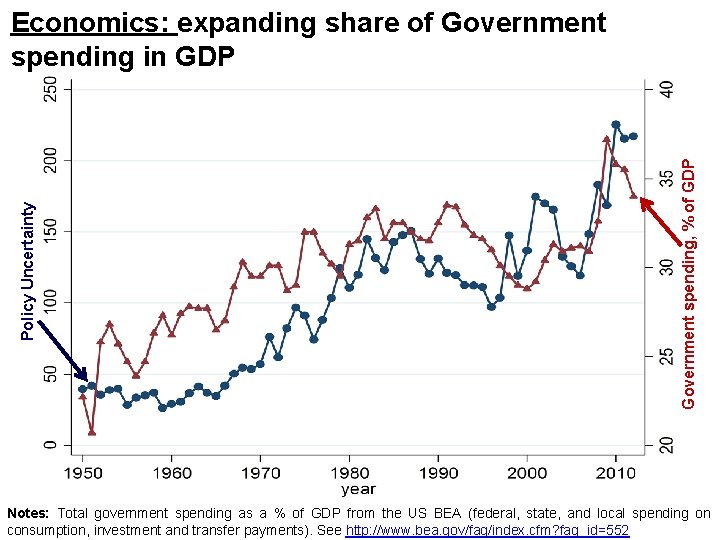
Government spending, % of GDP Policy Uncertainty Economics: expanding share of Government spending in GDP Notes: Total government spending as a % of GDP from the US BEA (federal, state, and local spending on Scott Baker, Nick Bloom and Steve Davis consumption, investment and transfer payments). See http: //www. bea. gov/faq/index. cfm? faq_id=552
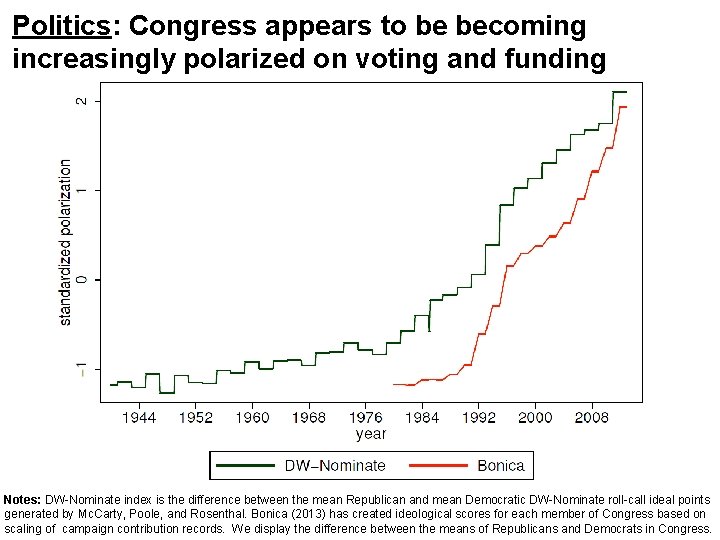
Politics: Congress appears to be becoming increasingly polarized on voting and funding Notes: DW-Nominate index is the difference between the mean Republican and mean Democratic DW-Nominate roll-call ideal points generated by Mc. Carty, Poole, and Rosenthal. Bonica (2013) has created ideological scores for each member of Congress based on Scott Baker, Nick Bloom and Steve Davis scaling of campaign contribution records. We display the difference between the means of Republicans and Democrats in Congress.
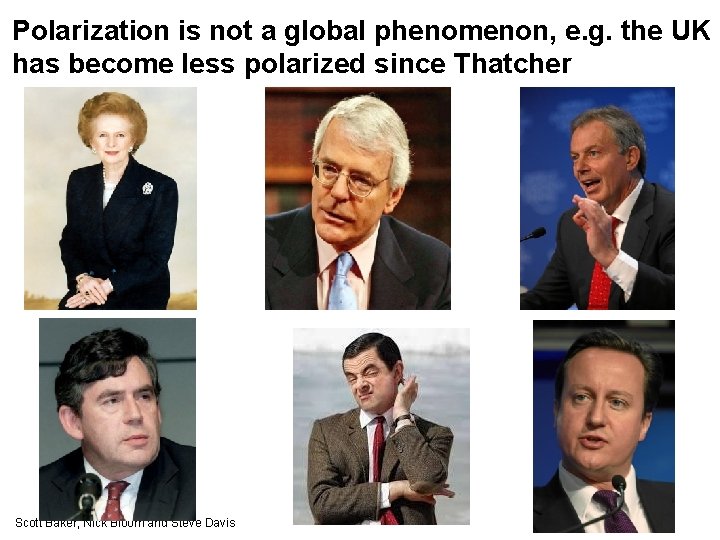
Polarization is not a global phenomenon, e. g. the UK has become less polarized since Thatcher Scott Baker, Nick Bloom and Steve Davis
Maybe US polarization is going up because the electorate is becoming polarized? Scott Baker, Nick Bloom and Steve Davis
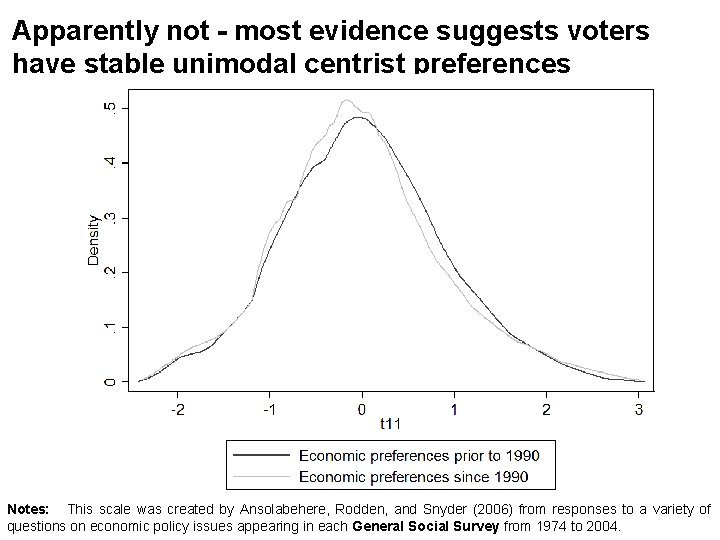
Apparently not - most evidence suggests voters have stable unimodal centrist preferences Notes: This scale was created by Ansolabehere, Rodden, and Snyder (2006) from responses to a variety of Scott Baker, Nick Bloom and Steve Davis questions on economic policy issues appearing in each General Social Survey from 1974 to 2004.
So this presents a puzzle – why have US politicians polarized while the US electorate has not? Scott Baker, Nick Bloom and Steve Davis
One possible explanation is geographic sorting - maybe Democrats are Republicans are living apart – or gerrymandering is creating polarized districts? Scott Baker, Nick Bloom and Steve Davis
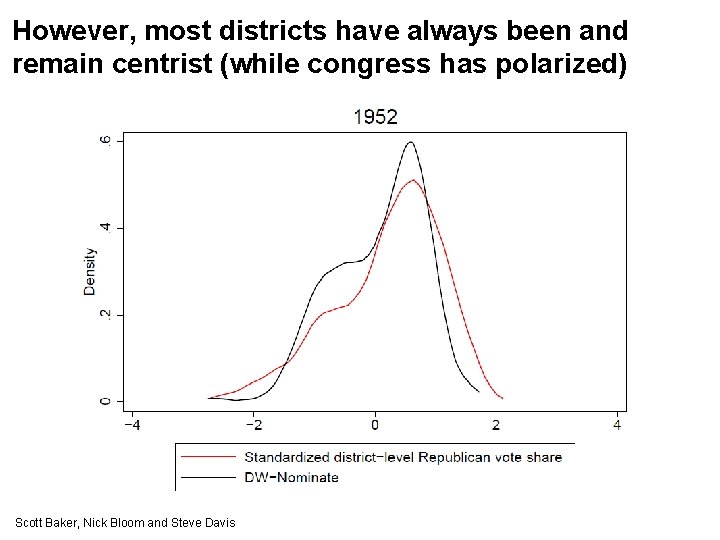
However, most districts have always been and remain centrist (while congress has polarized) Scott Baker, Nick Bloom and Steve Davis
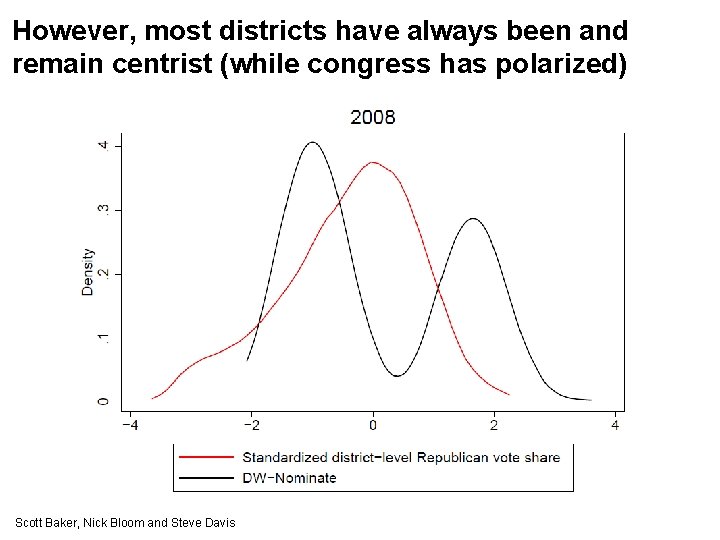
However, most districts have always been and remain centrist (while congress has polarized) Scott Baker, Nick Bloom and Steve Davis
Several other explanations have been offered, but none is a perfect fit (leaving something of a puzzle) • Income polarization: but does not match centrist voting • Media polarization: but does not match centrist voting • Primaries: intuitively appealing, but introduction of primaries not correlated with polarization (Hirano et al. 2010) • Campaign finance, individual contributors appear more polarized than Political Action Committees (Barber, 2013) Scott Baker, Nick Bloom and Steve Davis
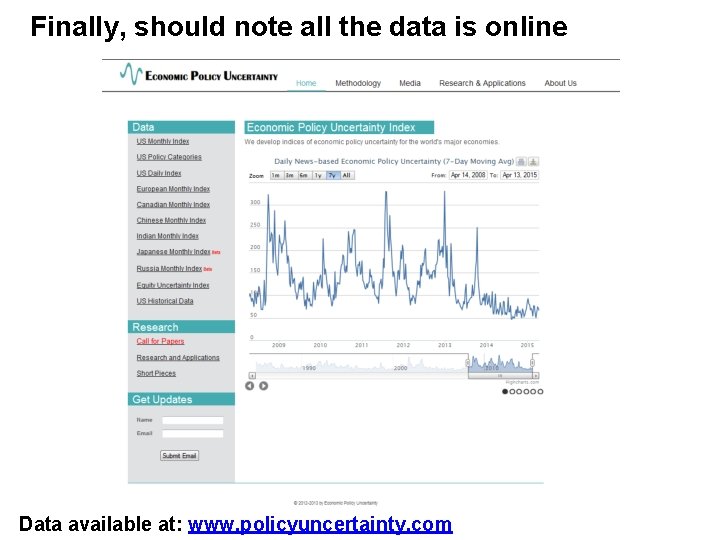
Finally, should note all the data is online Data available at: www. policyuncertainty. com Scott Baker, Nick Bloom and Steve Davis
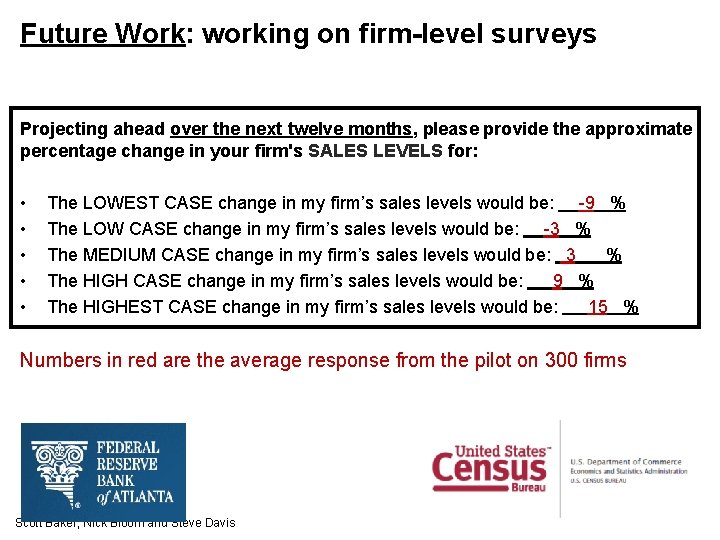
Future Work: working on firm-level surveys Projecting ahead over the next twelve months, please provide the approximate percentage change in your firm's SALES LEVELS for: • The LOWEST CASE change in my firm’s sales levels would be: -9 % • The LOW CASE change in my firm’s sales levels would be: -3 % • The MEDIUM CASE change in my firm’s sales levels would be: 3 % • The HIGH CASE change in my firm’s sales levels would be: 9 % • The HIGHEST CASE change in my firm’s sales levels would be: 15 % Numbers in red are the average response from the pilot on 300 firms Scott Baker, Nick Bloom and Steve Davis
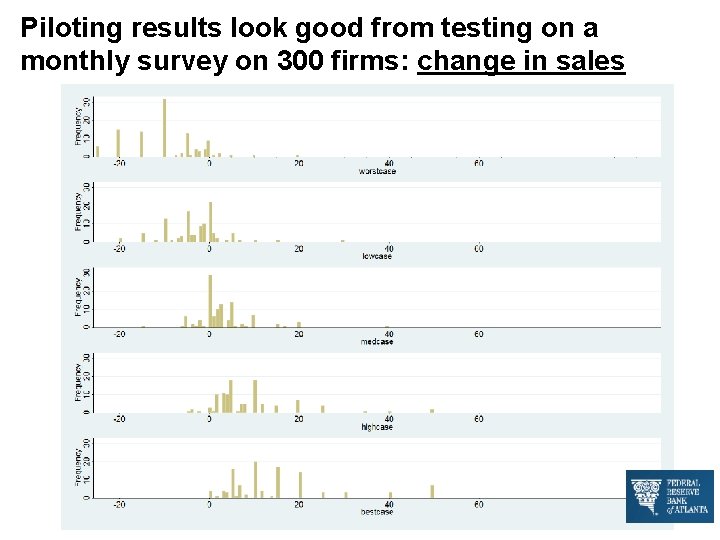
Piloting results look good from testing on a monthly survey on 300 firms: change in sales Scott Baker, Nick Bloom and Steve Davis
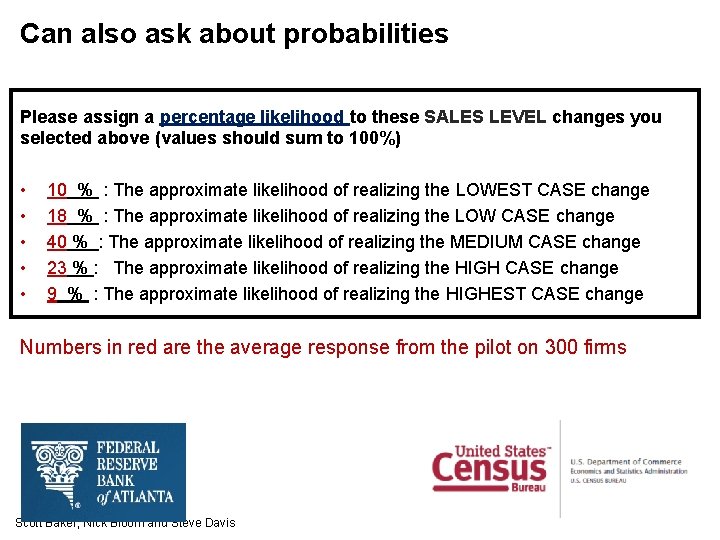
Can also ask about probabilities Please assign a percentage likelihood to these SALES LEVEL changes you selected above (values should sum to 100%) • 10 % : The approximate likelihood of realizing the LOWEST CASE change • 18 % : The approximate likelihood of realizing the LOW CASE change • 40 % : The approximate likelihood of realizing the MEDIUM CASE change • 23 % : The approximate likelihood of realizing the HIGH CASE change • 9 % : The approximate likelihood of realizing the HIGHEST CASE change Numbers in red are the average response from the pilot on 300 firms Scott Baker, Nick Bloom and Steve Davis
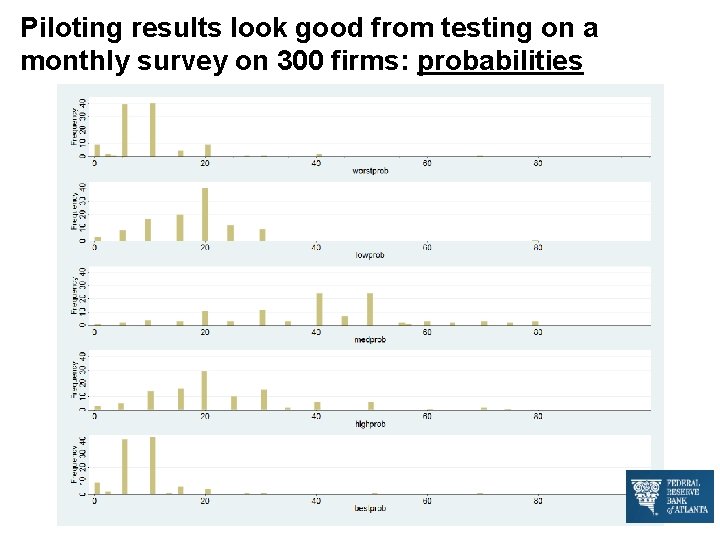
Piloting results look good from testing on a monthly survey on 300 firms: probabilities Scott Baker, Nick Bloom and Steve Davis
Conclusions - Policy uncertainty fluctuates at a high (quarterly) frequency, driven by the business cycle, the political cycle, and shocks - Firm-level evidence suggests that policy uncertainty can causally retard hiring and investment - More broadly, see news and text search as a great source of data across range of countries, times and topics Scott Baker, Nick Bloom and Steve Davis
Back-Up Scott Baker, Nick Bloom and Steve Davis
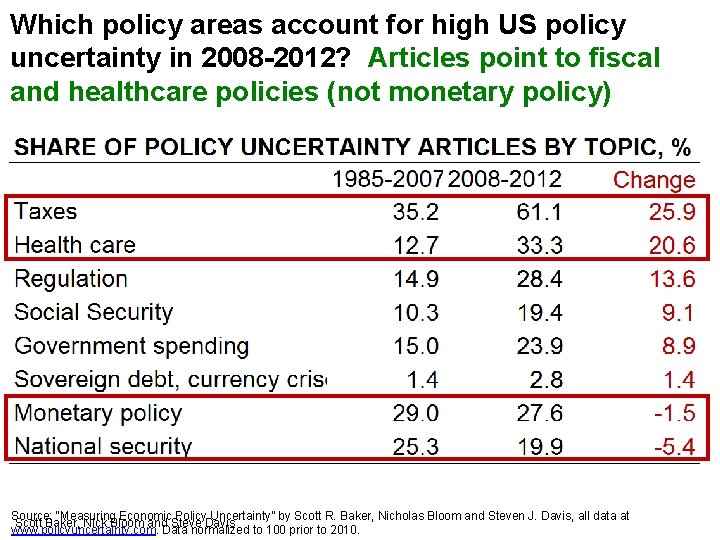
Which policy areas account for high US policy uncertainty in 2008 -2012? Articles point to fiscal and healthcare policies (not monetary policy) Source: “Measuring Economic Policy Uncertainty” by Scott R. Baker, Nicholas Bloom and Steven J. Davis, all data at Scott Baker, Nick Bloom and Steve Davis www. policyuncertainty. com. Data normalized to 100 prior to 2010.
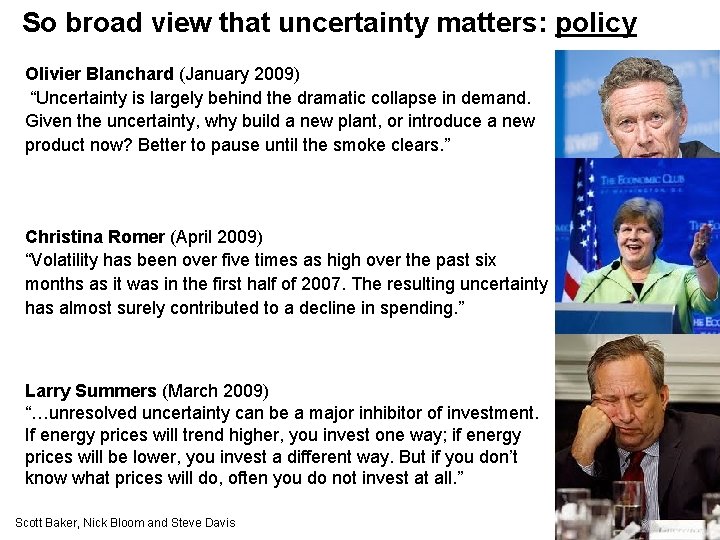
So broad view that uncertainty matters: policy Olivier Blanchard (January 2009) “Uncertainty is largely behind the dramatic collapse in demand. Given the uncertainty, why build a new plant, or introduce a new product now? Better to pause until the smoke clears. ” Christina Romer (April 2009) “Volatility has been over five times as high over the past six months as it was in the first half of 2007. The resulting uncertainty has almost surely contributed to a decline in spending. ” Larry Summers (March 2009) “…unresolved uncertainty can be a major inhibitor of investment. If energy prices will trend higher, you invest one way; if energy prices will be lower, you invest a different way. But if you don’t know what prices will do, often you do not invest at all. ” Scott Baker, Nick Bloom and Steve Davis
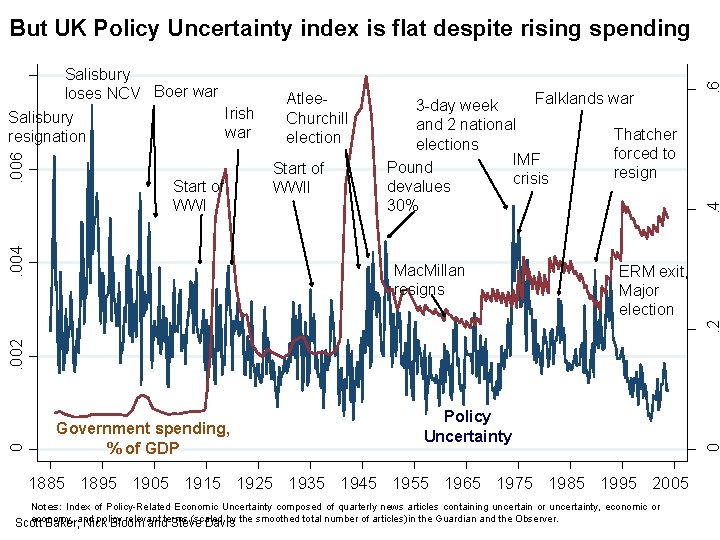
Atlee. Churchill election Start of WWII Falklands war 3 -day week and 2 national Thatcher elections forced to IMF Pound resign crisis devalues 30% ERM exit, Major election Government spending, % of GDP Policy Uncertainty 1885 1895 1905 1915 1925 1935 1945 1955 1965 1975 1985 1995 2005 Notes: Index of Policy-Related Economic Uncertainty composed of quarterly news articles containing uncertain or uncertainty, economic or economy, and policy relevant terms (scaled by the smoothed total number of articles) in the Guardian and the Observer. Scott Baker, Nick Bloom and Steve Davis 0 0 . 002 . 2 Mac. Millan resigns . 4 Start of WWI . 004 . 006 Salisbury loses NCV Boer war Irish Salisbury war resignation . 6 But UK Policy Uncertainty index is flat despite rising spending
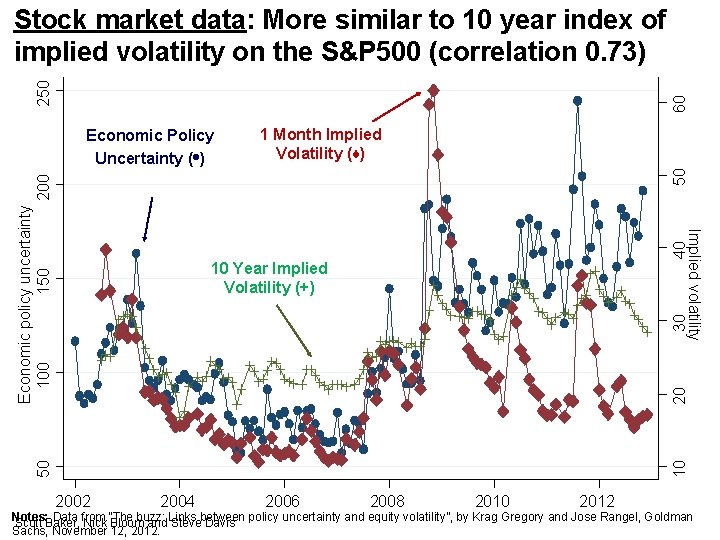
50 60 Correlation EPU and 1 month=0. 578 Correlation EPU and 10 years=0. 855 1 Month Implied Economic Policy Volatility (♦) Uncertainty ( • ) 40 Implied volatility Economic policy uncertainty 100 150 200 250 Stock market data: More similar to 10 year index of implied volatility on the S&P 500 (correlation 0. 73) 50 10 20 30 10 Year Implied Volatility (+) 2002 2004 2006 2008 2010 2012 Notes: Data from “The buzz: Links between policy uncertainty and equity volatility”, by Krag Gregory and Jose Rangel, Goldman Scott Baker, Nick Bloom and Steve Davis Sachs, November 12, 2012.
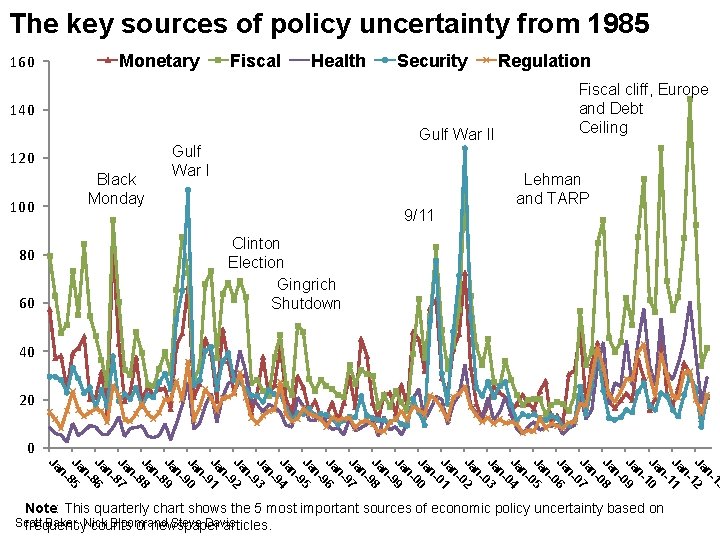
The key sources of policy uncertainty from 1985 Monetary 160 Fiscal Health Security 140 120 Black Monday 100 Gulf War II Gulf War I 9/11 Regulation Fiscal cliff, Europe and Debt Ceiling Lehman and TARP Clinton Election Gingrich Shutdown 80 60 40 20 0 13 n. Ja 12 n. Ja 11 n. Ja 10 n. Ja 09 n. Ja 08 n. Ja 07 n. Ja 06 n. Ja 05 n. Ja 04 n. Ja 03 n. Ja 02 n. Ja 01 n. Ja 00 n. Ja 99 n. Ja 98 n. Ja 97 n. Ja 96 n. Ja 95 n. Ja 94 n. Ja 93 n. Ja 92 n. Ja 91 n. Ja 90 n. Ja 89 n. Ja 88 n. Ja 87 n. Ja 86 n. Ja 85 n- Ja Note: This quarterly chart shows the 5 most important sources of economic policy uncertainty based on Scott Baker, Nick Bloom and Steve Davis frequency counts of newspaper articles.
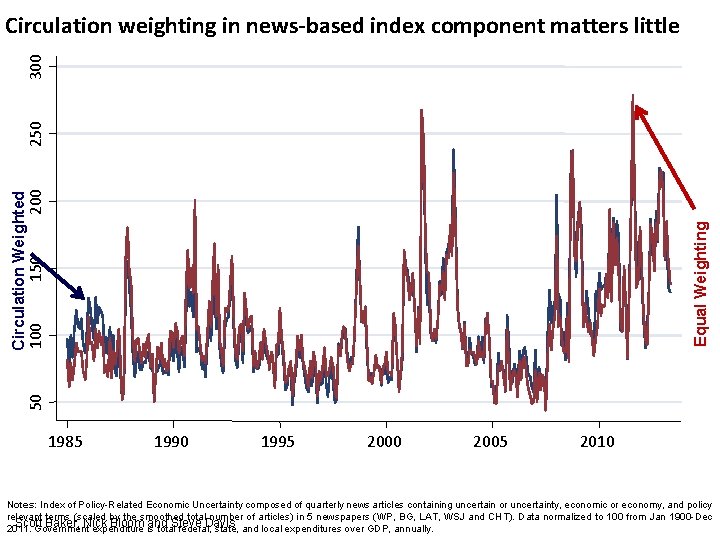
50 100 150 Equal Weighting Circulation Weighted 200 250 300 Circulation weighting in news-based index component matters little 1985 1990 1995 2000 2005 2010 Notes: Index of Policy-Related Economic Uncertainty composed of quarterly news articles containing uncertain or uncertainty, economic or economy, and policy relevant terms (scaled by the smoothed total number of articles) in 5 newspapers (WP, BG, LAT, WSJ and CHT). Data normalized to 100 from Jan 1900 -Dec Scott Baker, Nick Bloom and Steve Davis 2011. Government expenditure is total federal, state, and local expenditures over GDP, annually.
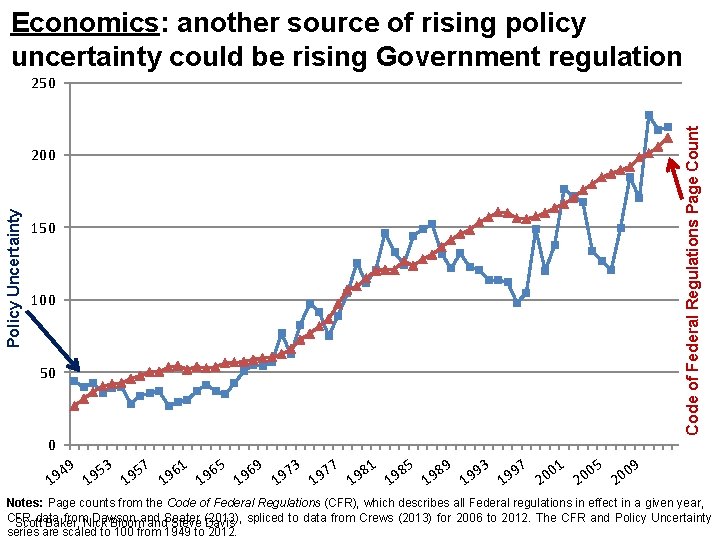
Economics: another source of rising policy uncertainty could be rising Government regulation Policy Uncertainty 200 150 100 50 0 Code of Federal Regulations Page Count 250 49 953 957 961 965 969 973 977 981 985 989 993 997 001 005 009 9 1 1 1 1 2 2 2 Notes: Page counts from the Code of Federal Regulations (CFR), which describes all Federal regulations in effect in a given year, CFR data from Dawson and Seater (2013), spliced to data from Crews (2013) for 2006 to 2012. The CFR and Policy Uncertainty Scott Baker, Nick Bloom and Steve Davis series are scaled to 100 from 1949 to 2012.
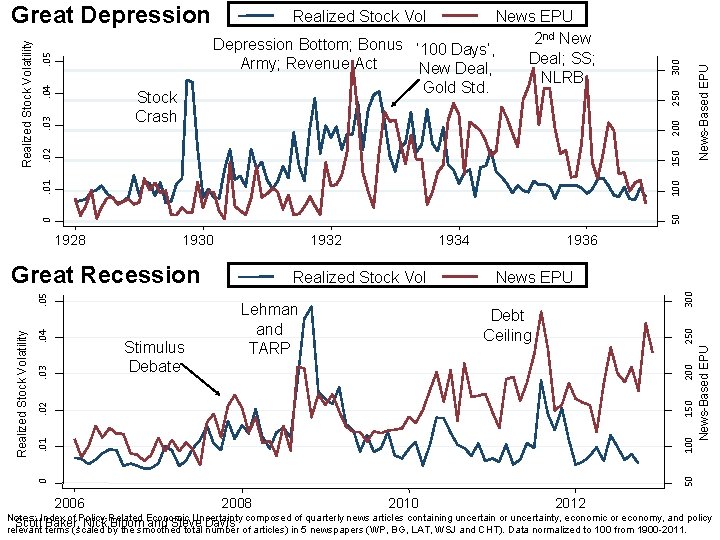
News-Based EPU 300 200 150 100 50 0 Lehman and TARP News EPU Debt Ceiling 0 50 . 01 100 . 02 150 . 03 Stimulus Debate Realized Stock Vol 1936 200 . 04 . 05 Great Recession 1934 300 1932 250 1930 News-Based EPU 1928 Realized Stock Volatility 250 . 05. 04 News EPU 2 nd New Depression Bottom; Bonus ‘ 100 Days’, Deal; SS; Army; Revenue Act New Deal, NLRB Gold Std. . 02 . 03 Stock Crash Realized Stock Vol . 01 Realized Stock Volatility Great Depression 2006 2008 2010 2012 Notes: Index of Policy-Related Economic Uncertainty composed of quarterly news articles containing uncertain or uncertainty, economic or economy, and policy Scott Baker, Nick Bloom and Steve Davis relevant terms (scaled by the smoothed total number of articles) in 5 newspapers (WP, BG, LAT, WSJ and CHT). Data normalized to 100 from 1900 -2011.
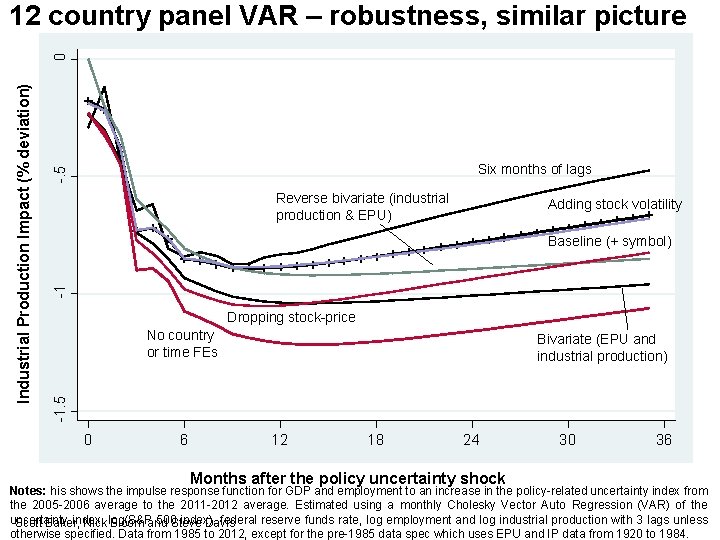
-. 5 Six months of lags Reverse bivariate (industrial production & EPU) Adding stock volatility -1 Baseline (+ symbol) Dropping stock-price No country or time FEs Bivariate (EPU and industrial production) -1. 5 Industrial Production Impact (% deviation) 0 12 country panel VAR – robustness, similar picture 0 6 12 18 24 Months after the policy uncertainty shock 30 36 Notes: his shows the impulse response function for GDP and employment to an increase in the policy-related uncertainty index from the 2005 -2006 average to the 2011 -2012 average. Estimated using a monthly Cholesky Vector Auto Regression (VAR) of the uncertainty index, log(S&P 500 index), federal reserve funds rate, log employment and log industrial production with 3 lags unless Scott Baker, Nick Bloom and Steve Davis otherwise specified. Data from 1985 to 2012, except for the pre-1985 data spec which uses EPU and IP data from 1920 to 1984.
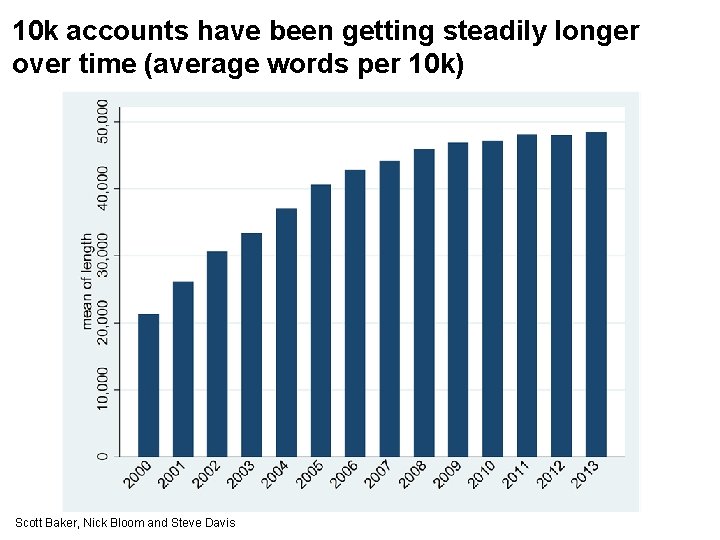
10 k accounts have been getting steadily longer over time (average words per 10 k) Scott Baker, Nick Bloom and Steve Davis
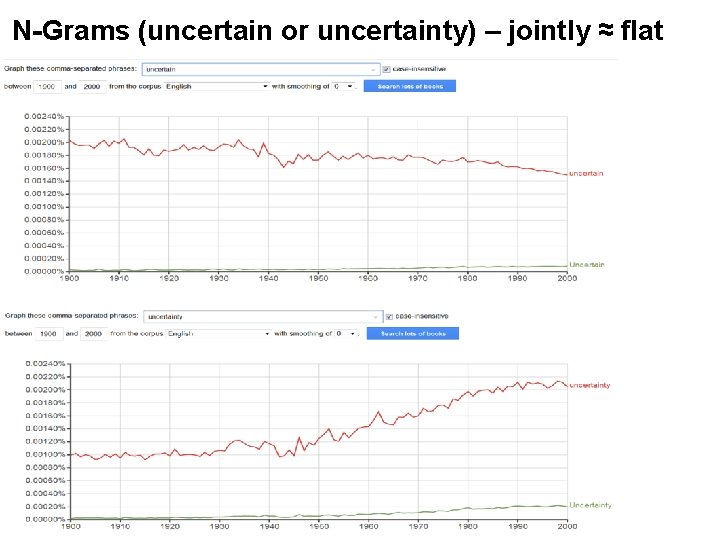
N-Grams (uncertain or uncertainty) – jointly ≈ flat Scott Baker, Nick Bloom and Steve Davis
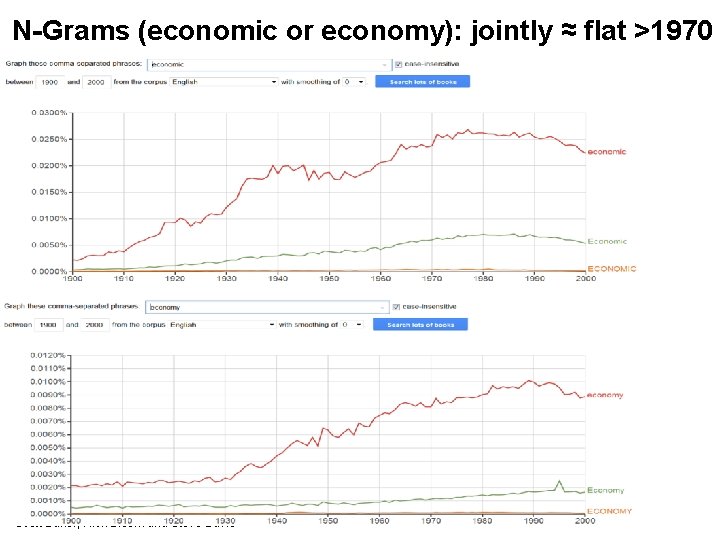
N-Grams (economic or economy): jointly ≈ flat >1970 Scott Baker, Nick Bloom and Steve Davis
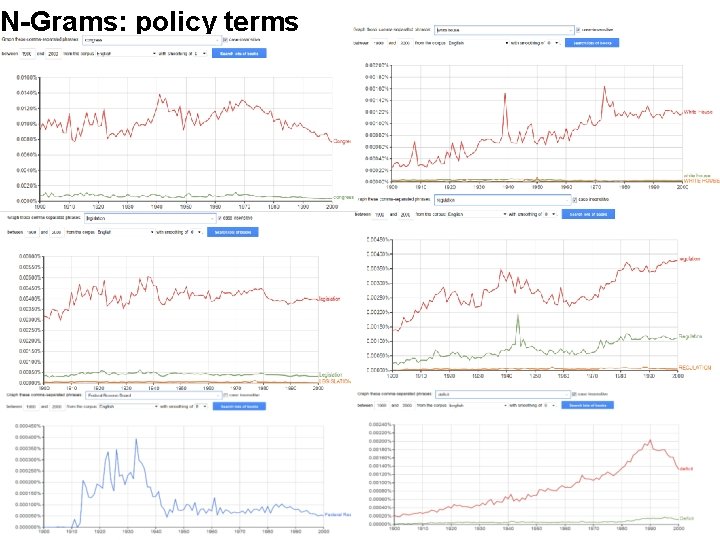
N-Grams: policy terms Scott Baker, Nick Bloom and Steve Davis
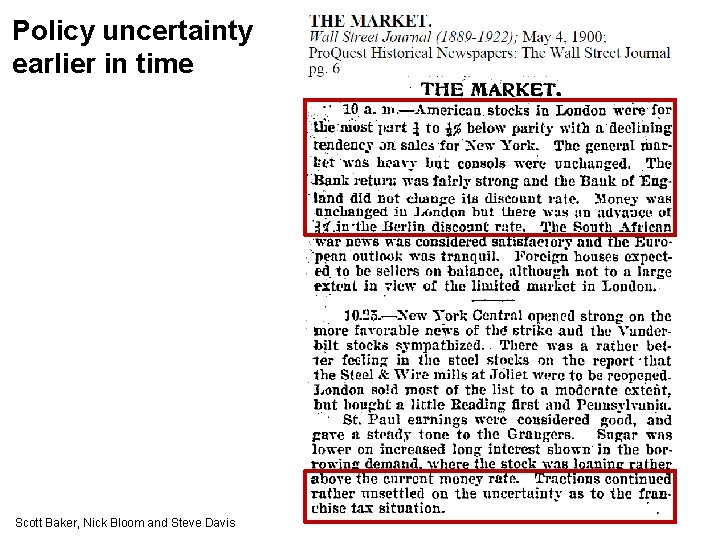
Policy uncertainty earlier in time Scott Baker, Nick Bloom and Steve Davis
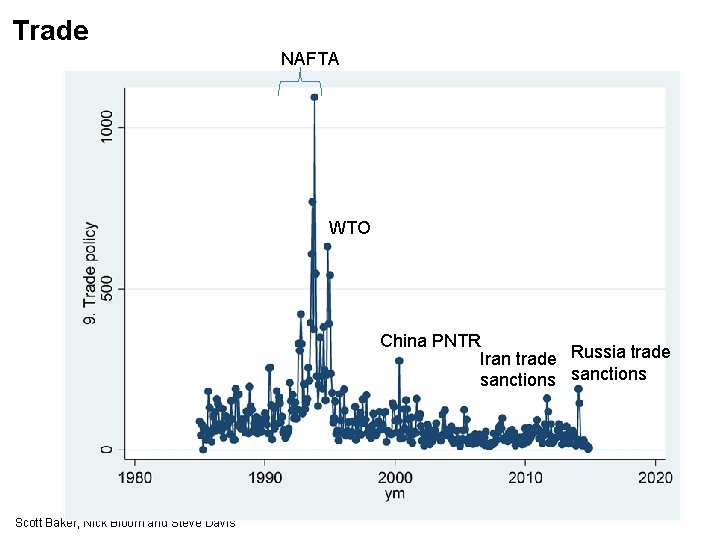
Trade NAFTA WTO China PNTR Iran trade Russia trade sanctions Scott Baker, Nick Bloom and Steve Davis
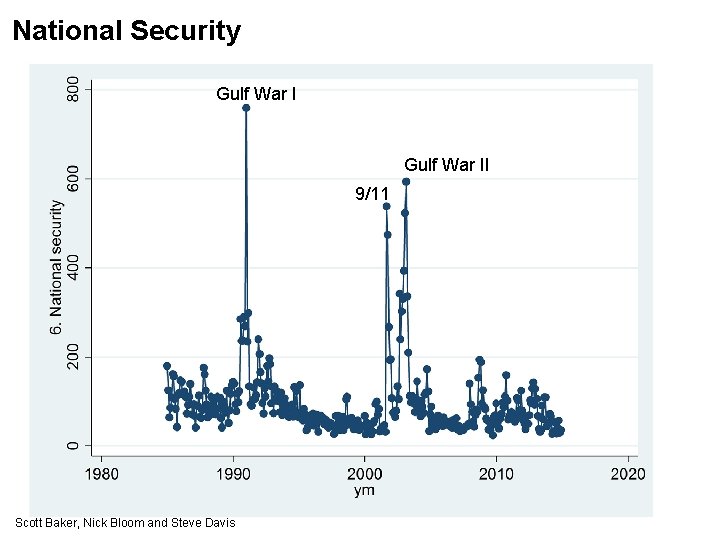
National Security Gulf War II 9/11 Scott Baker, Nick Bloom and Steve Davis
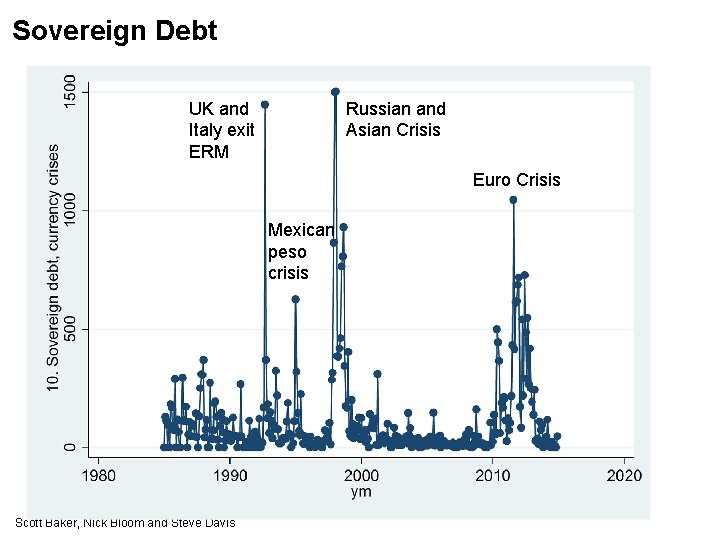
Sovereign Debt UK and Italy exit ERM Russian and Asian Crisis Euro Crisis Mexican peso crisis Scott Baker, Nick Bloom and Steve Davis
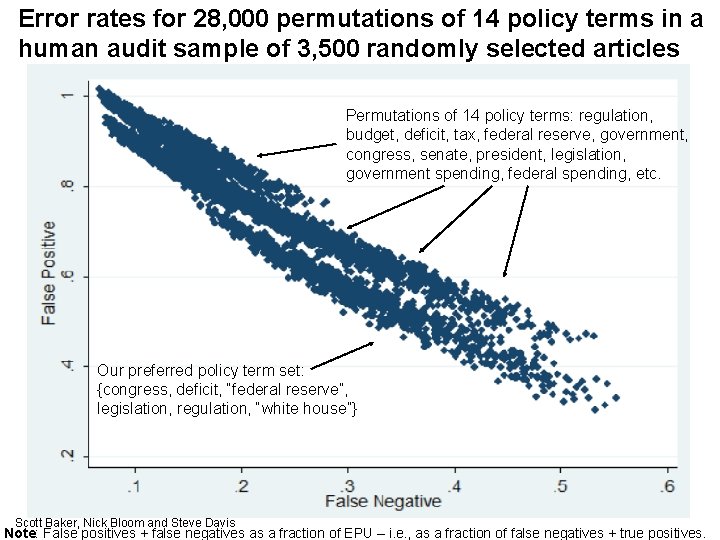
Error rates for 28, 000 permutations of 14 policy terms in a human audit sample of 3, 500 randomly selected articles Permutations of 14 policy terms: regulation, budget, deficit, tax, federal reserve, government, congress, senate, president, legislation, government spending, federal spending, etc. Our preferred policy term set: {congress, deficit, “federal reserve”, legislation, regulation, “white house”} Scott Baker, Nick Bloom and Steve Davis Note: False positives + false negatives as a fraction of EPU – i. e. , as a fraction of false negatives + true positives.
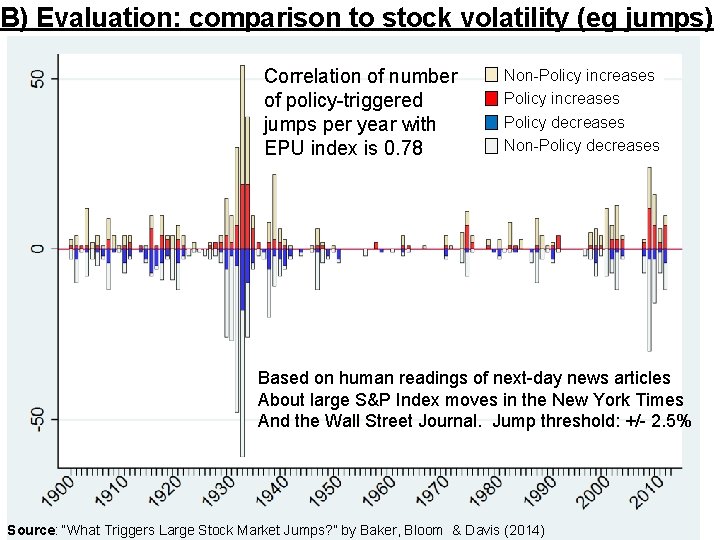
B) Evaluation: comparison to stock volatility (eg jumps) Correlation of number of policy-triggered jumps per year with EPU index is 0. 78 Non-Policy increases Policy decreases Non-Policy decreases Based on human readings of next-day news articles About large S&P Index moves in the New York Times And the Wall Street Journal. Jump threshold: +/- 2. 5% Scott Baker, Nick Bloom and Steve Davis Source: “What Triggers Large Stock Market Jumps? ” by Baker, Bloom & Davis (2014)
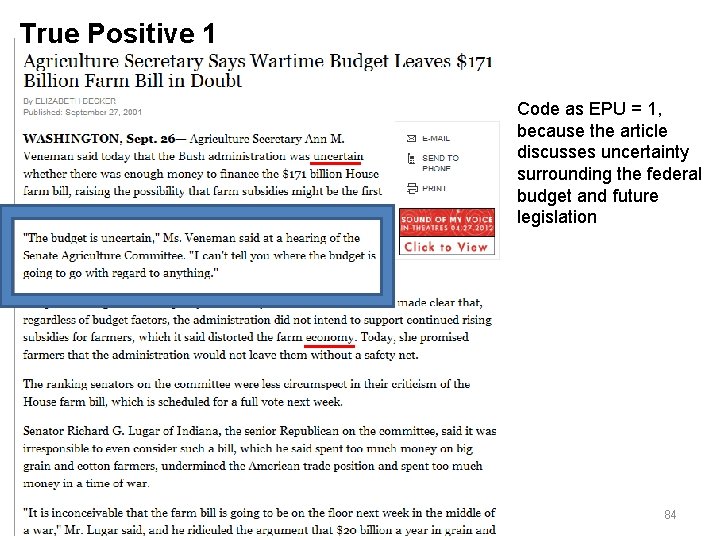
True Positive 1 Code as EPU = 1, because the article discusses uncertainty surrounding the federal budget and future legislation Scott Baker, Nick Bloom and Steve Davis 84
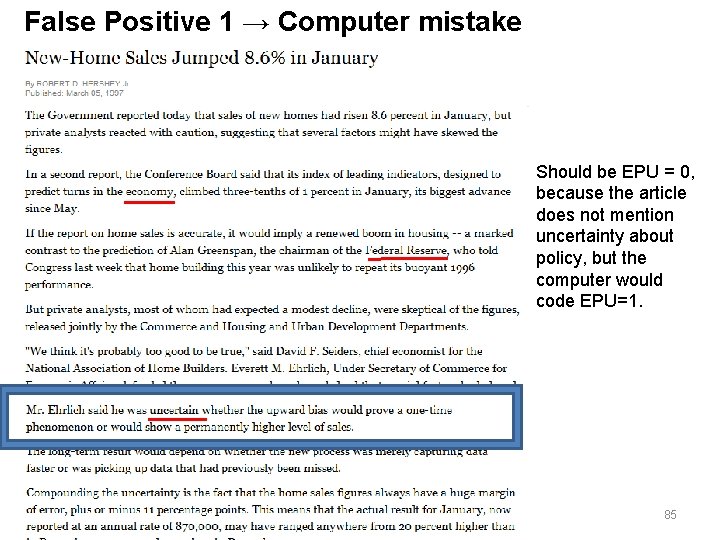
False Positive 1 → Computer mistake Should be EPU = 0, because the article does not mention uncertainty about policy, but the computer would code EPU=1. Scott Baker, Nick Bloom and Steve Davis 85
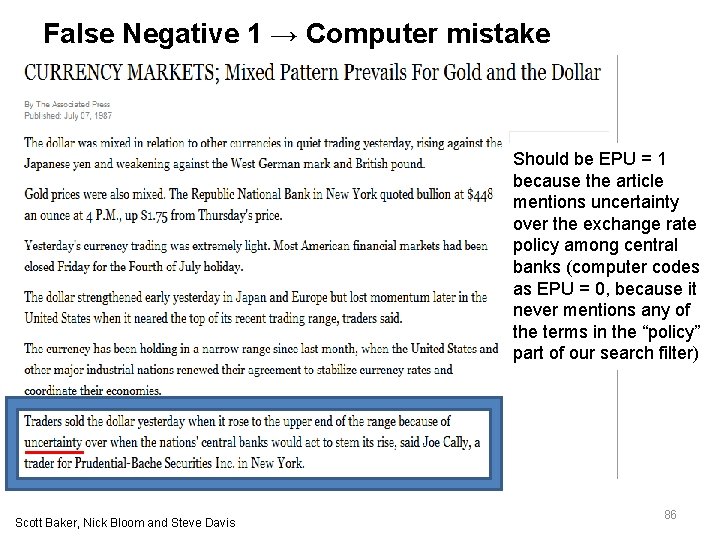
False Negative 1 → Computer mistake Should be EPU = 1 because the article mentions uncertainty over the exchange rate policy among central banks (computer codes as EPU = 0, because it never mentions any of the terms in the “policy” part of our search filter) Scott Baker, Nick Bloom and Steve Davis 86
- Slides: 86