Measuring Economic Development World Patterns in economic development


 • Many African countries (e. g.")
 • Many LDCs are HIPCs. • Highest levels of")


 • A UN study shows that strong economic growth does")
- Slides: 30
Measuring Economic Development
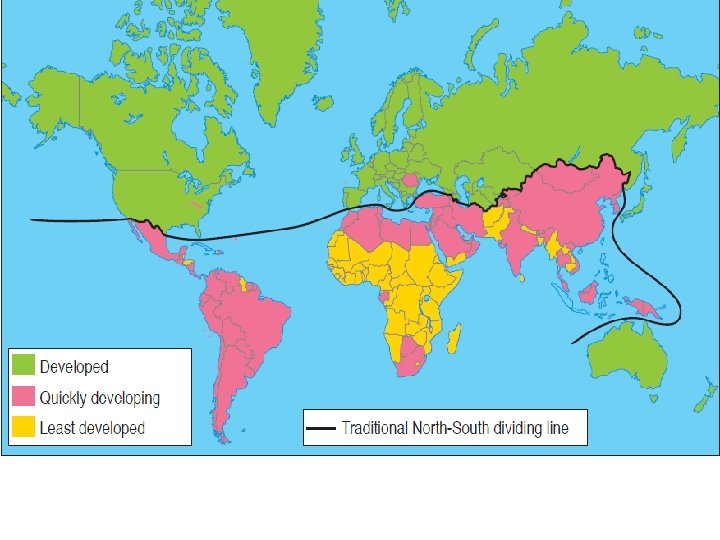
World Patterns in economic development. • Economic activities not evenly spread across the world. • Every country experiences different physical and social conditions. • World can be divided into 3 regions based on levels of economic development: • 1 - Developed • 2 - Least Developed • 3 - Quickly Developing
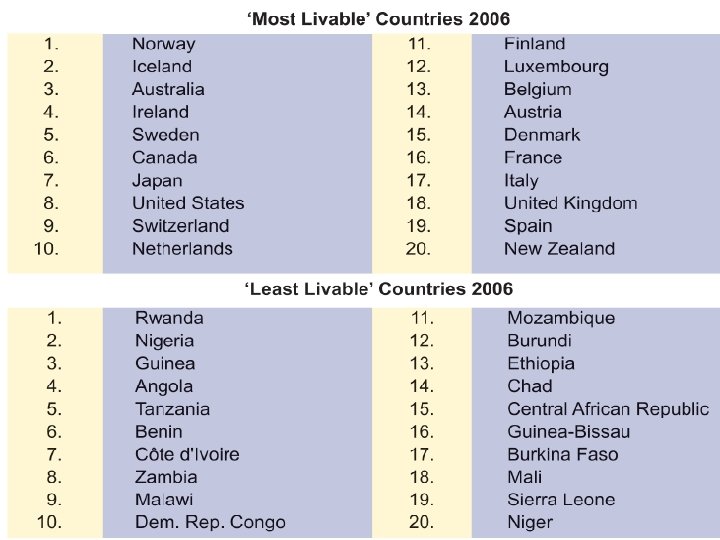
1 - Regions with developed countries • • Europe, North America, Japan, Australia. High levels of industrial activity. Well developed health-care systems Educated population. Social and economic equality between sexes. Low child mortality. Most employment in services and manufacturing. Gross National Product (GNP) is high and increasing.
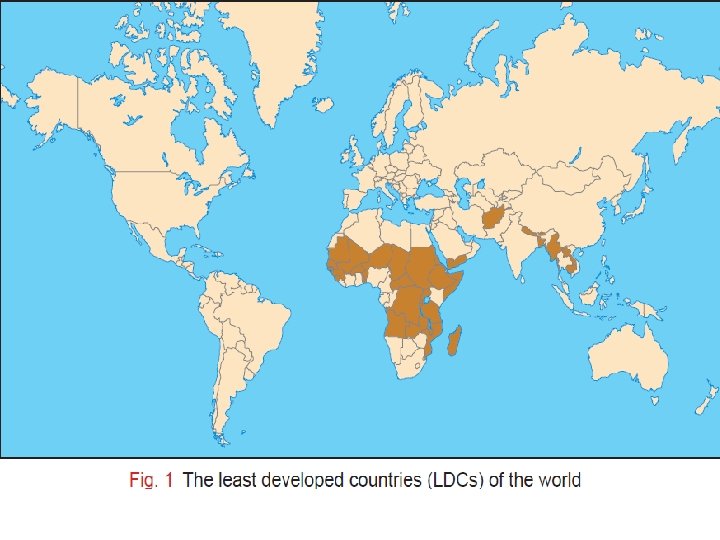
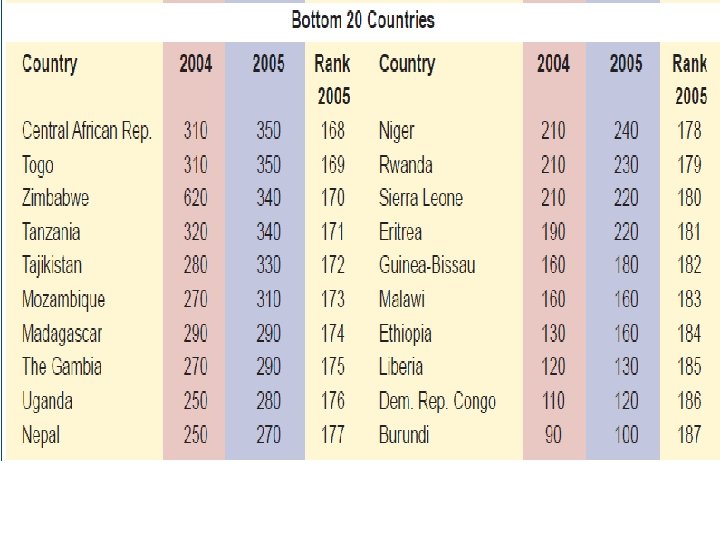
2 - Regions with least developed countries (LDCs) • Many African countries (e. g. Zambia, Ethiopia, Sierra Leone). • Some Asian countries (e. g. Bangladesh, Afghanistan). • Poorest in the world. • Low GNP (less than $750) and may be decreasing. • Low life expectancy • Millions living in absolute poverty. • Disease is common • Government may be corrupt. • Females are often uneducated. (working on land). • Limited manufacturing and services.
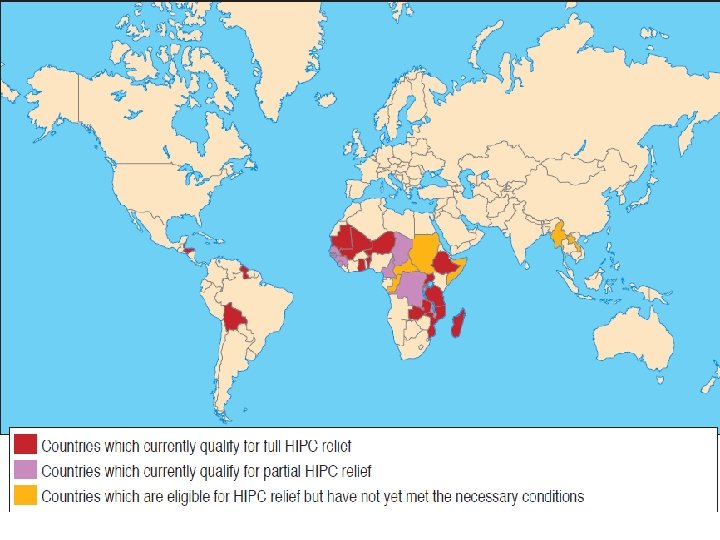
Heavily indebted poor countries (HIPCs) • Many LDCs are HIPCs. • Highest levels of poverty in the world. • Eligible for international debt relief measures which aim to reduce their external debt to more manageable levels. • The HIPC programme identifies 38 countries as being potentially eligible to receive debt relief, most of which are in sub-Saharan Africa.
3 – Quickly Developing Countries. • Southeast Asia (e. g. Malaysia, Indonesia, China and India) • Most of South and Central America (e. g. Brazil and Mexico). • North African countries such as Egypt. • Industrialised rapidly in last 15 years. • More jobs became available in manufacturing and services. • However, at risk of exploitation by multinational companies (MNCs) looking for cheap labour. • Healthcare and literacy improving. • GNP is increasing.
• Distinct North-South divide in wealth. • 20% of world’s population has 80% of the world’s wealth. • The North also controls 80% of world’s trade and investment, 90% of its industry and almost 100% of its research. • Australia and New Zealand are included in the North even though they are located in the Southern hemisphere.
Measuring Economic Development. • Difficult to give a definite measure for the economic development of a country. • Many things can be measured – life expectancy, number of doctors, internet access, car ownership, employment etc. • However there are 2 scales which are most often used to measure economic development of a country: • Gross National Product (GNP) • Its position on the Human Development Index (HDI).
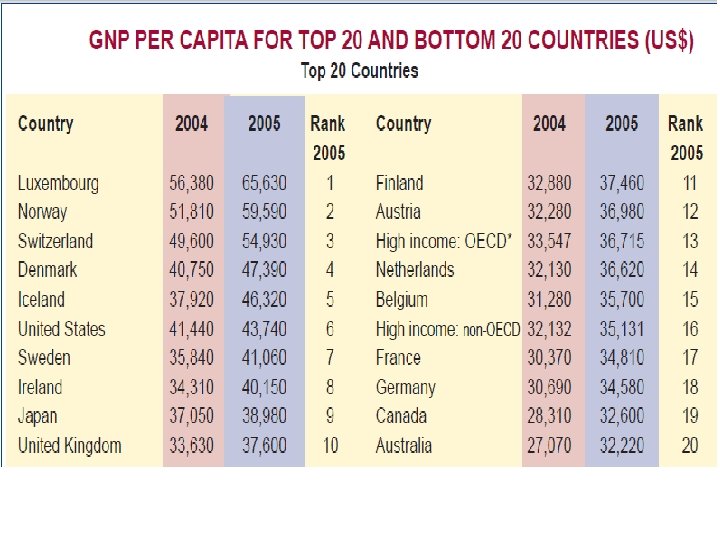
Gross National Product. • The most commonly used measure of a country’s wealth. • It is the value of goods and services produced in a country and by companies from that country which are located abroad. • Sometimes Gross National Income (GNI) is used instead of GNP but we take them to mean the same thing. • Gross Domestic Product (GDP) is the value of goods and services produced by a country’s businesses and organisations plus the value of goods and services produced by foreign-owned business corporations in that country.
Problems using GNP as an indicator of development. • 1 – misleading as its an average figure. • 2 – affected by the proportion of multinational companies in the country who take their profits elsewhere. • 3 – some countries have low GNP but score well in other measures of development, reflecting an investment in social services. • 4 – GNP figures do not reflect living costs in different countries. US$1 in Bangladesh buys much more than it would in the U. S. A.
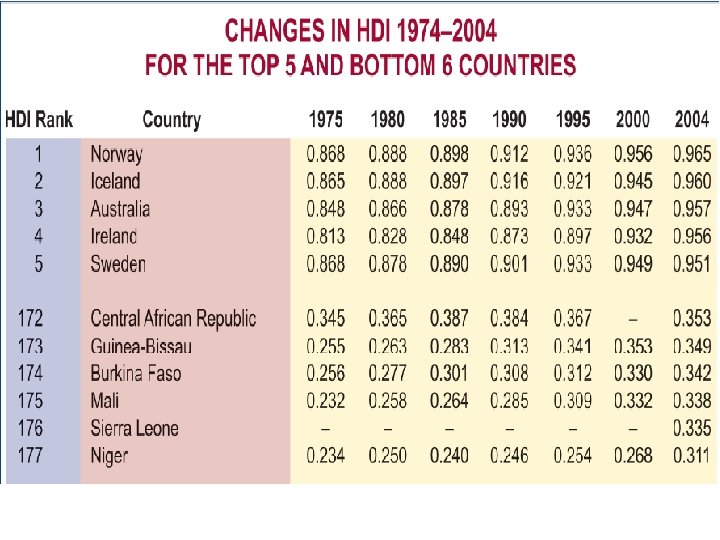
Human Development Index. • A scoring system to rank countries based on their social and economic conditions. • Always expressed as a number between 0 and 1. • Countries given points based on their progress in three areas of human development: • 1 – A long and healthy life. • 2 – Education. • 3 – A decent standard of living. • As the HDI includes social and economic indicators of development, it provides a broader view of development than GNP. • The HDI is based on people’s needs.
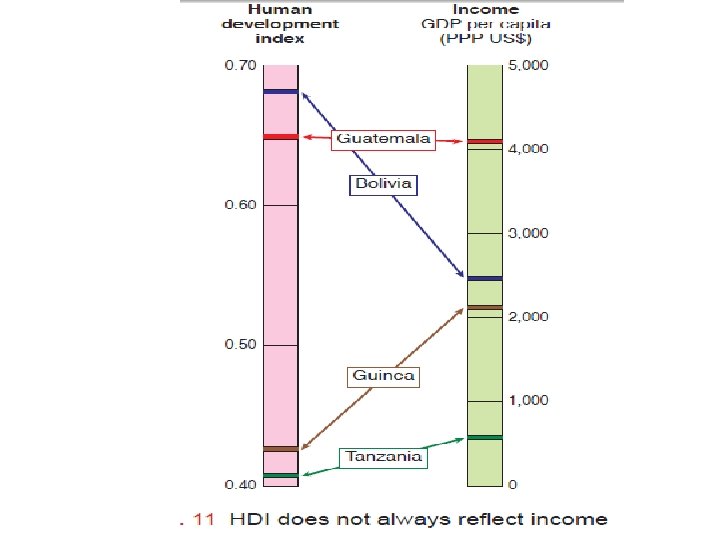
Problems using HDI as an indicator. • 1. Can conceal inequalities within countries. A high score may not apply to entire population. • 2. Not always a direct link with a high score on HDI and high GNP – Middle East countries , Czech Republic. • 3. Not suitable for tracking short term changes in development. 2 factors – adult literacy and life expectancy are not very responsive to short-term policy changes made by governments. • 4. The HDI is not a comprehensive measure.
Some factors which influence the HDI. • Health factors affecting life expectancy are: • Politics – how much government spend on primary health care. • Water availability and access to pure water – 30% of the worlds’ population are at risk from typhoid, cholera etc • Malnutrition • HIV/AIDS – in the southern countries of Africa, 10% of the population are ‘living’ with this disease.
Effects of Aids on Life Expectancy • South Africa: • 1985 – 62 • 2007 - 45
National Debt affects health and literacy programmes: • In 2003 African nations were repaying over 50 billion dollars of debts. • The International Monetary Fund (I. M. F. ) provides loans to improve economic performances but under strict conditions (called structural adjustments programmes (SAPs)). • This leads governments to cutback on health, education etc and affects the HDI and can lead to great hardship e. g. Riots in Argentina in 2005.
Economic growth causes: • Average income person to rise. • Improved HDI as people can afford better medicine, food etc. • Example: • Ireland 1998 – 58% of E. U. Average. • Ireland 2005 – 104% of E. U. Average.
Zimbabwe – An example of Economic Decline in an LDC. • Zimbabwe’s economy is in ruins and it shows that without proper management, a country’s economy can decline and bring massive problems.
Countdown to Economic Ruin • Population – 12 million • Average life expectancy: 1990 – 62, 2004 – 37. • Under- five mortality: 1990 – 80 per 1000, 2005 – 132 per 1000. • Aids – 2001 – 160, 000 deaths, 2005 – 180, 000. • GDP – 2000 US$7. 4 billion, 2005 US$3. 4 billion • Inflation – 2000 – 56%, 2006 - 1050%. • Unemployment – 2000 – 20%, 2006 – 75%. • People living below the poverty line – 80%. • Results of this decline – diseases, starvation, unemployment, emigration.
Levels of Economic Development. • Levels of economic development can vary greatly from country to country, region to region, i. e. Economic development is unevenly distributed. • There is an uneven rate of economic development in the world and this has led to a development gap: • Intercontinental regions: ‘north’ and ‘south’. • International e. g. Countries in the same region e. g. South Korea and North Korea. • Within countries e. g. N. Italy and S. Italy.
Economic development should result in : • Prosperity and a decline in poverty • More and better paid employment • A reduction in differences in the quality of life between different regions.
Child Wellbeing Table (2007) • A UN study shows that strong economic growth does not always result in a better quality of life for children. • Using criteria of : education, health care, family relationships, poverty / deprivation • The UN surveyed 21 developed countries: - 1 st – Holland, 2 nd Sweden, 3 rd Denmark, 12 th Ireland, 21 st Britain. • In countries that are poorer than Ireland Britain children were better off – e. g. Czech Republic