Measuring Earth Regents Earth Science Topic 2 Models


 Equatorial Circumference, and diameter")

 • Gravity is greater @ poles because there it is closer")
 • Ships disappear over horizons.")
 • Polaris only overhead @ North Pole. Polaris appears at the")


 begins between 600 – 700 km")
")

 only. Examples: Temperature, Elevation, Population, etc.")
 AND direction. Examples include forces and things")


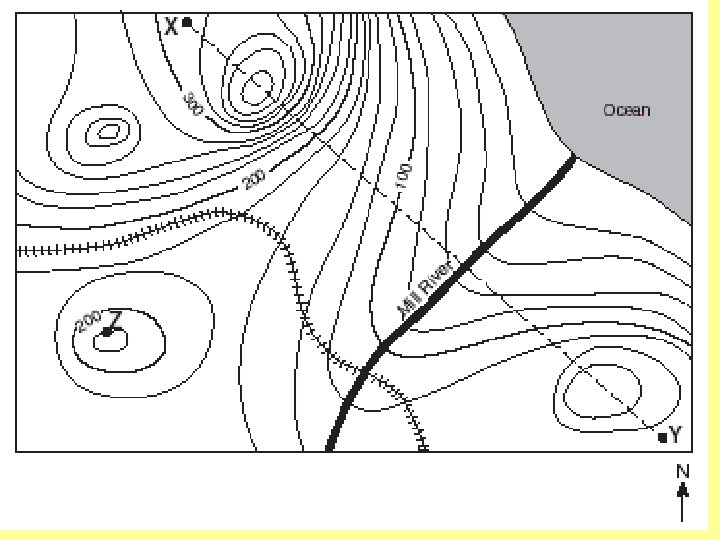
 • Contour")

- Slides: 27
Measuring Earth Regent’s Earth Science Topic #2
Models • Replicate & help us understand. • Visual representations
Kinds of Models • Physical – look like the real thing, but built to some other scale. Small things to a bigger scale or big things to a scale we can hold in our hands. • Mathematical – include formulas & equations. • Graphic – use of graphs to model relationships.
Earth’s True Shape Slightly Oblate Spheroid (Bulges at equator. ) Equatorial Circumference, and diameter GREATER THAN the Polar Circumference. (by about 70 km) 40076 km vs. 40008 km FOR ITS SIZE IT LOOKS VERY ROUND & VERY SMOOTH!
Evidence of Earth’s shape • Best Evidence Photos from satellites.
(shape evidence –continued) • Gravity is greater @ poles because there it is closer to the center of Earth. (E. R. > P. R. ) Gravity = G x M 1 x M 2 distance 2
(shape evidence –continued) • Ships disappear over horizons.
(shape evidence –continued) • Polaris only overhead @ North Pole. Polaris appears at the observer’s latitude.
Coordinate System • Imaginary grid system • Used to locate any position on Earth’s surface.
Latitude & Longitude • Latitude - Parallels go east & west to measure distance north & south of Equator. Latitudes range 0 -90°N or S. • Longitude – Meridians go north & south to measure east & west of the Prime Meridian. Longitudes range 0 -180° E or W. Prime Meridian
Eratosthenes’ Proportion • Used to find Earth’s size over 2000 years ago. Step #1 Step #2 S C 500 C = = L 360 30° 360 30 C = 18000 Step #3 C = 6000 km 30° shadow angle 500 km No shadow on this stick
Earth Structure • Lithosphere – Solid, rock layers, most dense. • Hydrosphere – Liquid, water layer, includes fresh & salt water, surface & ground water. Density between air and rock’s density. • Atmosphere – Shell of mixed gases, includes: mostly 78% nitrogen, only 21% oxygen & 1% all other gases.
Lithosphere 10 -65 km Continental Crust 10 -40 km Earth’s Internal Structure Ocean Crust 0 -10 km “Moho” (Mohorovich Discontinuity) The interface between crust & mantle
Atmosphere Layers Exosphere (space) begins between 600 – 700 km
Earth’s Atmosphere • Most of the atmosphere close to Earth’s surface. (80% in troposphere) • Layers based on temperature change. • Statosphere warmer as you go up. Ozone there absorbs u. v. rays. • Thermosphere ions absorb gamma and xrays and also get warmer as you go up.
Field • A region which has been measured for a quantity. • Data points for a quantity on a map. Examples: elevation, temperature, air pressure, wind, precipitation, population
Scalar Quantities • Has a magnitude (size) only. Examples: Temperature, Elevation, Population, etc.
Vector Quantities • Has both magnitude (size) AND direction. Examples include forces and things that can exert forces such as: gravity, wind, magnetism, ocean currents, etc.
Isoline • Connect points of equal value on a field map. • If the map is big enough the isoline will come back to meet itself. • Two isolines can never touch each other. One location can’t have 2 different values. (Ex: 2 Elevations)
Kinds of Isolines • Contour Lines - Elevation • Isotherm - Temperature • Isobar – Air Pressure
Draw 70°F & 80°F isolines.
Isosurface • On 3 -D models. • Connects points of equal value. • Shows up as a surface.
Gradient • Equals Slope. Gradient = Change in field value Distance
Gradient on Topographic Maps • • • Contour lines show elevations. Contour Lines Close = Steep Gradient. Contour Lines Spread Out = Flat Area Steep Slope
Direction of Stream Flow • Streams flow downhill. (generally toward sea-level. ) • Contour lines are v-shaped where they meet streams. • Streams flow out the open end of the v-shaped contour. ow Fl n D io ct e ir
Profiles • A profile is a side, cutaway-view of landscape region. Step#1 – Mark contour lines on scrap paper w/ elevations. Step #2 – Move scrap to bottom of profile graphing grid. Step #3 – Mark each contour positions @ correct elevation. Step #4 – connect data pts. w/ line. The only thing left on this profile is to connect the data points w/ a line.