Measuring Development 2 Rich suburbs of London Slums
 Rich suburbs of London Slums of India")
Measuring Development (2) Rich suburbs of London Slums of India

Starter In your groups, write down as many development indicators as you can

We are learning to… • Give reasons why combined indicators of development are more reliable than single indicators • Describe the Physical Quality of Life Index • Describe the Human Development Index

I Can… • Understand explain the benefits of using combined indicators of development • Interpret and produce scatter graphs using various indicators of development

Comparing social and economic indicators Generally, countries that score highly on economic indicators also do well according to social indicators. This is because they can use their wealth to provide proper schooling, hospitals, food and decent housing. Countries with little wealth just cannot afford to provide all of these social services for their people.
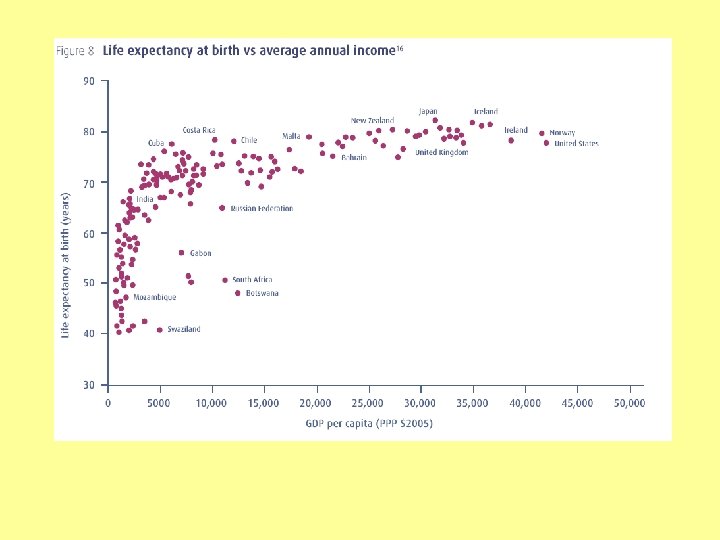

Measuring Development Look at your hand out of the scatter graphs. Some countries appear more developed according to social indicators while others appear more developed according to economic indicators. Look at Fig. 8. 1 and 8. 2 Fig 8. 1 shows that as a country’s income person increases, so does the life expectancy of its people. But, some exceptions can be spotted: People in Mexico have a higher life expectancy than people in Estonia, but their average income is much lower. Any ideas why? Discuss with a partner for a minute.
 4, 940")
Combined Indicators of Development Indicator of development China India GNP person ($) 4, 940 1, 410 Energy used person (kg) 1, 807 566 Life expectancy (years) 72 64 Calories person, per day 2, 970 2, 300 Adult literacy (%) 92 74 As we have seen before, using just one indicator can be misleading. Often, a range of social and economic indicators are used. e. g. Above, China and India have been compared using five indicators. According to these, China is more developed than India

Alternatively, a range of indicators can be used to produce a single combined index. Two examples of these are: The Physical Quality of Life Index (PQLI) – this combines: ØLife expectancy These produce an index from 0 -100 ØInfant mortality A PQLI of over 77 is considered ØAdult literacy good. The higher the index, the better the quality of life of the country The Human Development Index (HDI) – this combines: ØLife expectancy These produce an index from 0 -1 ØAdult literacy An HDI of 0. 8 or above is ØGNP/person considered developed ØCost of living ØSchool enrolment

Task 1 Country HDI Country 1 Ireland Kenya 2 Switzerland Australia 3 Norway Netherlands 4 Luxembourg United States 5 Sweden New Zealand 6 Australia Canada 7 Iceland Sri Lanka 8 Italy Malawi 9 Denmark Germany 10 Spain Sweden HDI Using an atlas, copy and complete the table above

Task two Answer the following questions: 1. Why do countries that score highly on economic indicators usually also score highly on social indicators? 2. Why is it more reliable to use several indicators? 3. What factors make up the PQLI? 4. If a country has a PQLI of 86, is it considered more or less developed than a country with a PQLI of 53? 5. How many of the factors that make up the PQLI are a)social and b)economic 6. What factors make up the HDI?

Task Three Look at the hand out showing the scatter graphs. 1. What is the life expectancy and income person in a) Greece b) Nigeria c) Libya 2. What is the % of people in agriculture and the number of calories person in a) Switzerland b) Brazil c) Sudan Draw a scatter graph to show the information in the table to the right Country Income person ($) Adult Literacy (%) Chad 690 34 India 1, 410 74 Algeria 4, 470 70 Fiji 3, 720 93 Lebanon 9, 140 87 St Lucia 6, 820 90 Hungary 12, 730 99 Oman 19, 260 81

We were learning to… • Give reasons why combined indicators of development are more reliable than single indicators • Describe the Physical Quality of Life Index • Describe the Human Development Index

Can I… • Understand explain the benefits of using combined indicators of development • Interpret and produce scatter graphs using various indicators of development
- Slides: 14