Measuring and saving water Using the water consumption


 180 160 140 120 100 80 60 40 20 0 7/1")
- Slides: 8
Measuring and saving water Using the water consumption calculator from the webpage https: //www. hunterwater. com. au/Save-Water/Water-Usage-Calculator. aspx The students found out the amount of water they use at home and the results of the average are shown in the next graph. You can find all the data used for the graph in this link: CONSUMPTION OF WATER - DATA AND GRAPH. xlsx
350 Average consumption of water amongst our students 300 250 200 150 100 50 Ca l ta To r/ Bo at ol rd e Ga n/ w La Po n y dr un La n he Ki tc Ba th ro o m 0
4, 38 % Average consumption of water amongst our students 2, 98 5, 13 3, 038 Bathroom Kitchen Laundry Lawn/Garden Pool 84, 45 Car/Boat
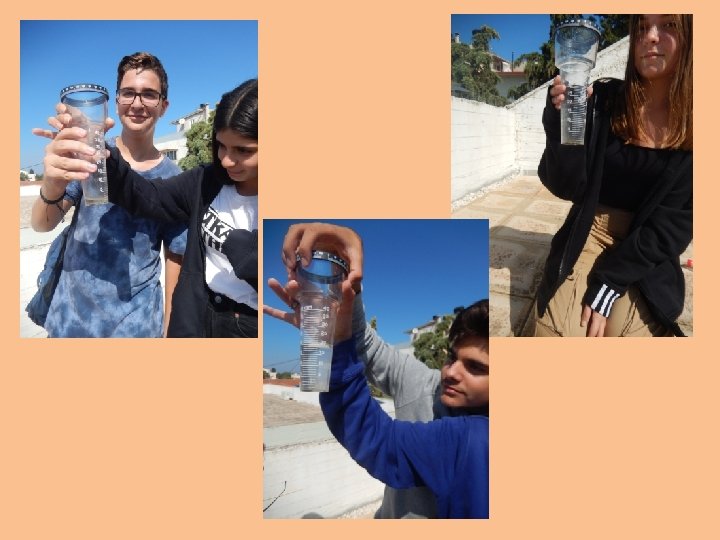
We placed a pluviometer at the terrace of our school and every day a different student was measuring the rainfall of the past 24 hours.
DATE 21/1/2019 22/1/2019 23/1/2019 24/1/2019 25/1/2019 26/1/2019 27/1/2019 28/1/2019 29/1/2019 30/1/2019 31/1/2019 1/2/2019 2/2/2019 3/2/2019 4/2/2019 5/2/2019 6/2/2019 7/2/2019 8/2/2019 9/2/2019 10/2/2019 11/2/2019 12/2/2019 13/2/2019 14/2/2019 15/2/2019 16/2/2019 17/2/2019 18/2/2019 19/2/2019 20/2/2019 21/2/2019 22/2/2019 23/2/2019 24/2/2019 25/2/2019 RAINFALL (mm) 14 0 0 3 5 10 0 0, 5 0 5, 5 3 0 0 19 1 19 0 0 28 30 2 45 65 29 0 0 0 10 36 In the table at the left their measurements are shown for a two – month period.
20. 3. 2019 18. 3. 2019 16. 3. 2019 14. 3. 2019 12. 3. 2019 70 10. 3. 2019 80 8. 3. 2019 RAINFALL daily (mm) 6. 3. 2019 4. 3. 2019 28. 2. 2019 26. 2. 2019 24. 2. 2019 22. 2. 2019 20. 2. 2019 18. 2. 2019 16. 2. 2019 14. 2. 2019 12. 2. 2019 10. 2. 2019 8. 2. 2019 6. 2. 2019 4. 2. 2019 2. 2. 2019 31. 1. 2019 29. 1. 2019 27. 1. 2019 25. 1. 2019 23. 1. 2019 21. 1. 2019 The graph we created based on the previous results RAINFALL (mm) (pluviometer at school) 60 50 40 30 20 10 0
RAINFALL Weekly (mm) 180 160 140 120 100 80 60 40 20 0 7/1 ek We 1 -2 : 21 ek We 2: 2 -3/ 1 / 28 ek We 3 3 2 2 3 3 -3/ 10/ 17/ 24/ 17/ 20/ 2 / 4 1 8 5 : 4: 1 5: 1 8: 1 9: 1 k 7 6: 2 e k k k e e e W We We We 2 10/ 4 3: RAINFALL (mm)