Measuring and Modelling Population Changes Population Dynamics Carrying


, death (mortality), immigration, emigration Population growth")


 – pattern of population growth where organisms reproduce")


 N Pop Growth Rate 0. 50 100 900/1000")

 Growth")


- Slides: 25
Measuring and Modelling Population Changes
Population Dynamics Carrying Capacity: Maximum number of organisms that can be sustained by available resources over a given period of time Is dynamic as environmental conditions are always changing Fecundity: The potential for a species to produce large numbers of offspring in one lifetime.
Life is a gamble. . .
Factors That Affect Population Growth Birth (natality), death (mortality), immigration, emigration Population growth of any given population is calculated mathematically
More Terms! Open population – Population in which change in number and density determined by births, deaths, immigration, emigration Closed population – Change in size determined by natality and mortality alone Biotic Potential – Maximum reproductive rate (r) under ideal conditions (intrinsic rate of natural increase) eg. E. Coli. . . if doubled, unchecked for 24 hrs they would cover the earth 1 m deep!!
Population Growth Models
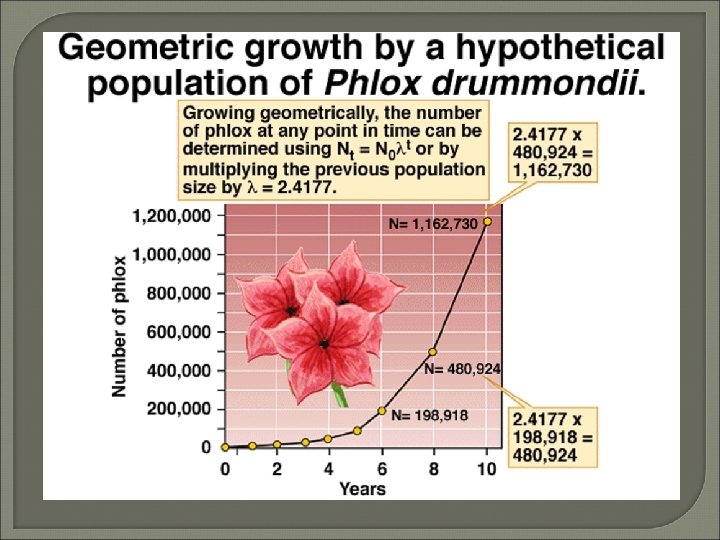
Geometric Growth Geometric growth ( ) – pattern of population growth where organisms reproduce at fixed intervals at a constant rate. Eg. Animals with a specific breeding season. = N(t +1) N (t) = fixed growth N = Population in year (t + 1) t = year
Geometric Growth Example 2000 seals give birth to 950 pups in May. During the next 12 months, 150 pups die. Assuming geometric growth, what will the harp seal population be in two years? Eight years? First Calculate Growth rate: N(0) = 2000 N(1) = 2000 + 950 150 = 2800 After 2 years: N(t + 1) = N(t) N(2) = 2800 x 1. 4 = 3920 OR N (2) = N (0) 2 = 3920 After 8 years: N(8) = N(0) 8 = 2000 x (1. 4)8 = 29520
Exponential growth A pattern of population growth where organisms reproduce continuously at a constant rate Ecologists are able to determine instantaneous growth rate of the population expressed in terms of the intrinsic (per capita) growth rate (r). • difference between per capita birth rate, b, and per capita death rates, d, where r = (b – d) • population growth rate given by the expression. . . d. N/dt = instantaneous growth rate of population r = growth rate per capita N = population size
Exponential growth For populations growing exponentially, the time needed for population to double in size is a constant. . .
Exponential Growth Example A population of 2500 yeast cells in culture is growing exponentially with an intrinsic growth rate r is 0. 0575 per hour. 1. What is the initial instantaneous growth rate of the population? Given: r = 0. 0575, N = 2500 d. N/dt = (0. 0575)(2500) = 144 per hour 2. What time will it take for the population to double in size? td = 0. 69 0. 0575 = 12 hours
Exponential Growth Example 3. What will the size of the population be after each of four doubling periods? Doubling Times Time in hours Population size 0 0 2500 1 12 5000 2 24 10000 3 36 20000 4 48 40000
The Cane Toad!!
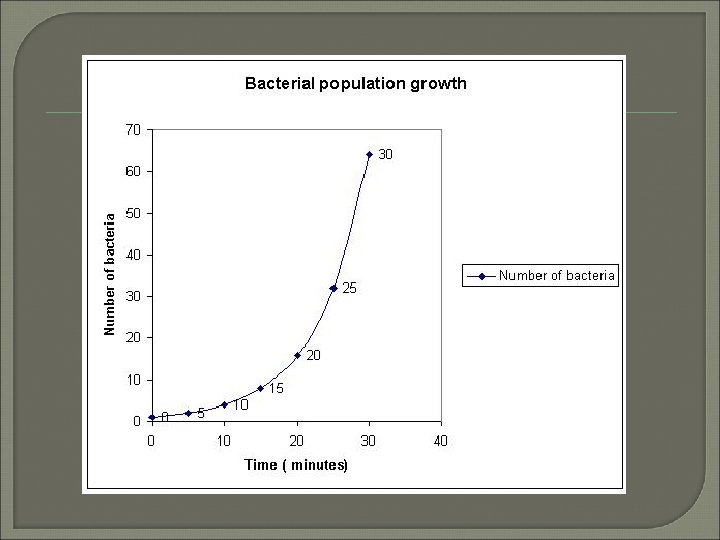
Bacteria are Prolific!
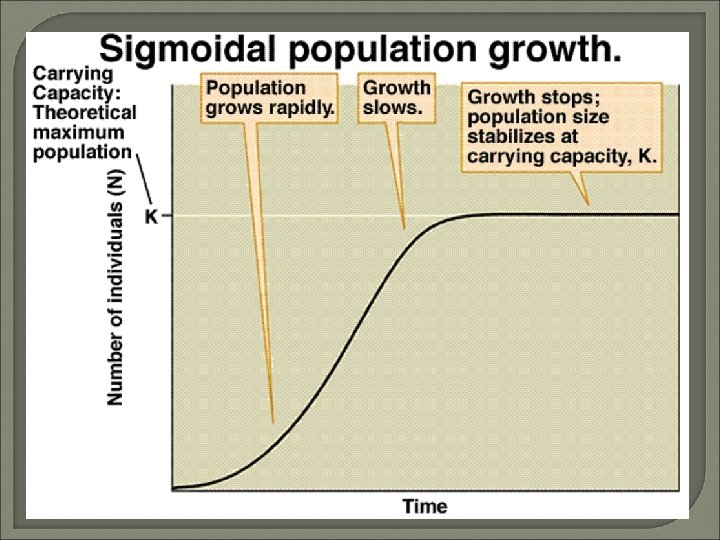
Modelling Logistic Growth Food, water, light, and space within an ecosystem are factors that limit population growth as resources are consumed as the population nears the ecosystem’s carrying capacity The growth rate drops below rmax in this case Stable equilibrium (births=deaths) is often reached Population number at carrying capacity is represented by K.
Modelling Logistic Growth Logistic growth is most common growth pattern seen in nature as it represents the effect of carrying capacity on the population’s growth Logistic growth equation is as follows
Logistic Growth Example A population is growing continuously. The carrying capacity of the environment is 1000 individuals and its r max (max growth rate) is 0. 50. Determine pop growth rates based on pop sizes of 100 , 500, 900, 1000
r Max Pop Size N (K-N) N Pop Growth Rate 0. 50 100 900/1000 45 0. 50 500/1000 125 0. 50 900 100/1000 45 0. 50 1000 0/1000 0 Question : What is the relationship between population size and growth rate? Answer: When the pop is small the growth rate is slow. It increases as the pop increases, then as it approaches carrying capacity, the growth rate declines and eventually stops!!
S shaped (Sigmoidal) Growth
Three Distinct Phases Lag phase occurs when population is small and increasing slowly Log phase occurs when population undergoes rapid growth As available resources become limited, population experiences environmental resistance and stationary phase occurs in which the population is at dynamic equilibrium (b=d)
Homework!! Page 664 #1, Page 665 # 2 a & b Page 668 # 3 -4, Page 669 # 2 -3, Page 670 #4 -7