Measures of Position zscore standard score number of

Measures of Position
 = number of standard deviations that a given value is above")
z-score (standard score) = number of standard deviations that a given value is above or below the mean (Round z to two decimal places)

Ordinary values: between and including -2 and 2 Unusual values: less than -2 and greater than 2

1. Determine which student did better In the 8: 00 college algebra class, on the first test the mean was 75 with a standard deviation of 3, Bill was in this class and got a 82. In the 10: 00 college algebra class, on the first test the mean was 83 with a standard deviation of 2, Sally was in this class and got 83. Did Sally or Bill do better relative to their classes?
 The kth percentile of a set of data is a value")
kth Percentile (Pk) The kth percentile of a set of data is a value such that k percent of the observations are less than or equal to the value

*Quartiles : Divides the data into four equal parts (Q 1, Q 2, Q 3) *Deciles : Divides the data into ten equal parts (D 1, D 2, …, D 9) *Percentiles : Divides the data into 100 equal parts (P 1, …, P 99)

Quartiles
 1. Arrange the data in ascending order 2. Determine the")
Finding Quartiles (By Hand) 1. Arrange the data in ascending order 2. Determine the median, M, or second quartile, Q 2 3. Divide the data set into halves: the observations below (to the left of) M and the observations above M. The first quartile, Q 1, is the median of the bottom half and the third quartile, Q 3, is the median of the top half

2. Find the quartiles of the following data 33, 37, 43, 51, 62, 65, 72, 83, 91, 105, 110, 201, 305, 317, 320, 330
 1. Input numbers, then “ 2 nd” “mode” to exit")
Find Quartiles (By TI-83/84) 1. Input numbers, then “ 2 nd” “mode” to exit out 2. “stat” button, “right arrow” to CALC, “enter” on 1 -varstats, “enter” Note: down arrow to see quartiles

3. Find the quartiles of the following data 2, 8, 33, 45, 71, 83, 91, 105, 113, 235, 471, 512, 513, 555, 1002
")
Finding the percentile of a number in a list (sorted)

4. Find the percentile of a number in a list Given: 15 18 23 24 27 33 38 41 52 63 71 81 88 91 99 Find the percentile of 33
 1. Sort the data 2. Compute the Locator Value:")
Find the nth Percentile (Pk) 1. Sort the data 2. Compute the Locator Value: i = (k/100)(n) k=percentile in question n=number of values Note: i is the position of your answer in the list 1. If i has no decimals: Percentile= average number in the ith position and (i+1)th position If it has decimals: Percentile = Round up and the answer is the number at that position in the list

5. Find the nth percentile Given: 17 21 55 71 210 233 Find P 25 25 31 43 83 91 105 301 315 320

6. Find the nth percentile Given: 17 21 55 71 210 233 Find P 17 25 31 43 83 91 105 301 315 320

Quartiles to Percentiles • 25 th percentile = 1 st quartile • 50 th percentile = 2 nd quartile • 75 th percentile = 3 rd quartile
 = Q 3 – Q 1 Semi-interquartile")
Other Formulas • • Interquartile range (IQR) = Q 3 – Q 1 Semi-interquartile range = (Q 3 - Q 1) / 2 Midquartile = (Q 3 + Q 1) / 2 10 -90 percentile range = P 90 – P 10

Definitions • Outliers = Extreme observations

Checking for Outliers by Using Quartiles 1. Determine Q 1 and Q 3 2. Find IQR = Q 3 – Q 1 3. Determine the fences (fences serve as cutoff points for determining outliers) Lower Fence = Q 1 – 1. 5(IQR) Upper Fence = Q 3 + 1. 5(IQR) 4. Outliers are values less than lower fence or greater than upper fence
 Compute the z-score corresponding")
7. Given the population data below, find the following: a) Compute the z-score corresponding to 5. 3 b) Determine the quartiles c) Compute the interquartile range (IQR) d) Determine the lower and upper fences, are there any outliers? 3. 5 7. 2 9. 3 12. 7 3. 2 3. 9 9. 4 12. 8 4. 1 5. 3 10. 5 13. 1 4. 7 6. 1 10. 9 13. 5 3. 8 6. 2 11. 1 17 5. 1 3. 1 11. 2 38. 6
 Smallest data value 2) Q 1 3) Median")
Five Number Summary Consists of 1) Smallest data value 2) Q 1 3) Median 4) Q 3 5) Largest data value

Five Number Summary 1. Enter data into L 1 2. “stat” button, choose CALC, choose 1 var Stats, press “enter” button and “enter” button again 3. This will give you the five number summary: min. X = minimum value, max. X = maximum value, Q 1=first quartile, Med=second quartile (or median), Q 3=third quartile

8. Find the five number summary of the following data 23 33 17 8 2 4 51 15 5 42 21 8 72 13 9

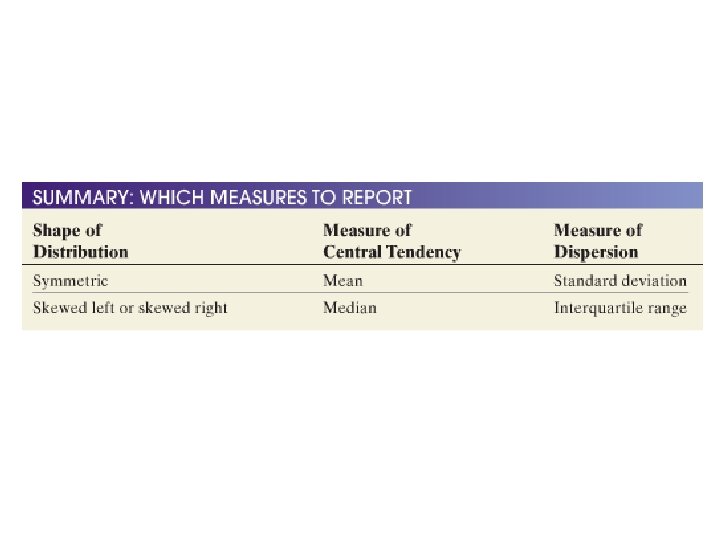
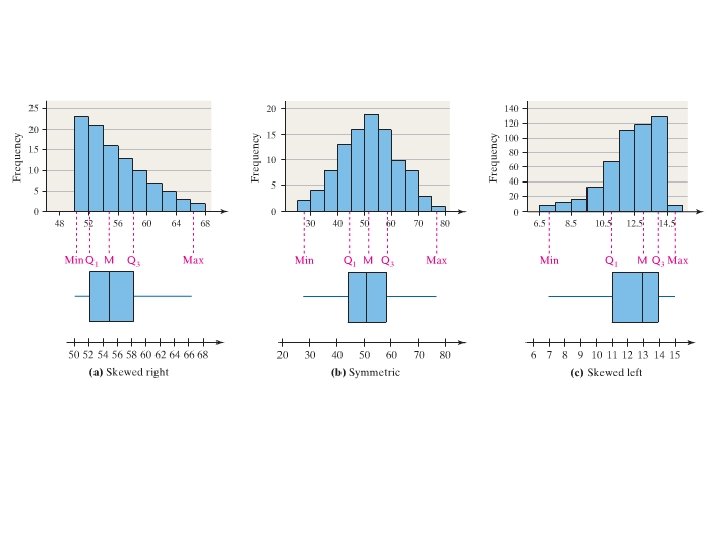
Boxplot = a graph of a data set that consists of a line extending from the minimum value to the maximum value, and a box with lines drawn at the first quartile, the median, and the third quartile.
 1. Put list in L 1 2. “ 2 nd”")
Creating a Boxplot (TI-83/84) 1. Put list in L 1 2. “ 2 nd” button, “y=“ button 3. Enter on 1: Plot 1 and choose these options: - ON - Fifth Graph - L 1 -1 4. “zoom” and then choose “Zoom. Stat” and “enter” 5. “Trace” button to view values.
 1. Determine the lower and upper fences: Lower fence")
Drawing a Boxplot (By Hand) 1. Determine the lower and upper fences: Lower fence = Q 1 – 1. 5(IQR) Upper fence = Q 3 + 1. 5(IQR) 2. Draw a number line long enough to include the max and min values. Insert vertical lines at Q 1, M, and Q 3. Enclose these vertical lines in a box 3. Label the lower and upper fences 4. Draw a line from Q 1 to smallest data value larger than lower fence. Draw a line from Q 3 to largest data value that is smaller than upper fence (whiskers) 5. Mark any outliers with an asterisk (*)

9. Draw the boxplot of the following data 18 5 15 2 7 55 33 12 72 81 17 8 3 13 3
- Slides: 30