
Measures of Participation in Global Value Chains and
Measures of Participation in Global Value Chains and Global Business Cycles NBER Working Paper No. 23222 Characterizing Global Value Chains: Production Length and Upstreamness NBER Working Paper No. 23261 Zhi Wang Shang-Jin Wei UIBE & George Mason University Columbia University and NBER Xinding Yu Kunfu Zhu UIBE 4 th Aug, 2017 UIBE, Beijing
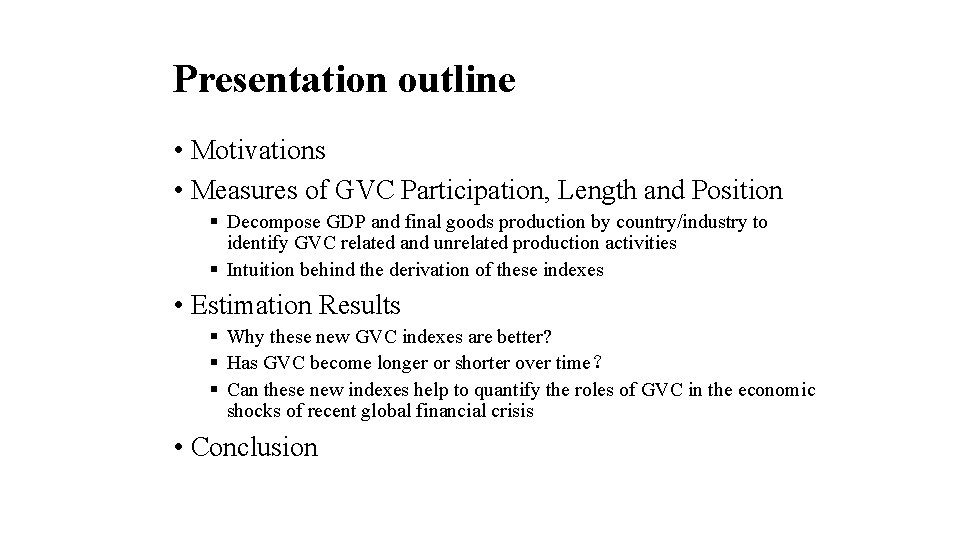
Presentation outline • Motivations • Measures of GVC Participation, Length and Position § Decompose GDP and final goods production by country/industry to identify GVC related and unrelated production activities § Intuition behind the derivation of these indexes • Estimation Results § Why these new GVC indexes are better? § Has GVC become longer or shorter over time? § Can these new indexes help to quantify the roles of GVC in the economic shocks of recent global financial crisis • Conclusion
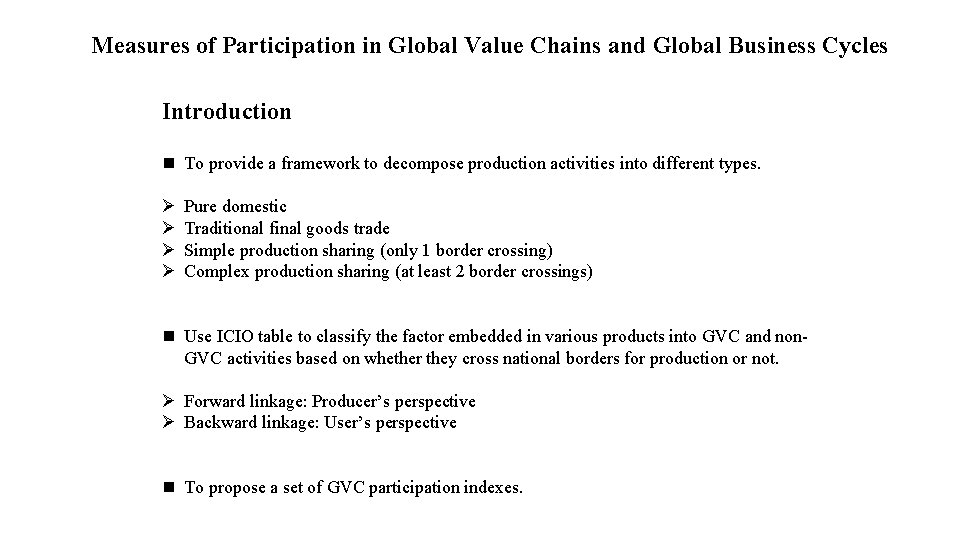
Measures of Participation in Global Value Chains and Global Business Cycles Introduction n To provide a framework to decompose production activities into different types. Ø Ø Pure domestic Traditional final goods trade Simple production sharing (only 1 border crossing) Complex production sharing (at least 2 border crossings) n Use ICIO table to classify the factor embedded in various products into GVC and non. GVC activities based on whether they cross national borders for production or not. Ø Forward linkage: Producer’s perspective Ø Backward linkage: User’s perspective n To propose a set of GVC participation indexes.
Outline n Accounting Framework n Numerical Results n Application: Economic Growth and GVC Participation
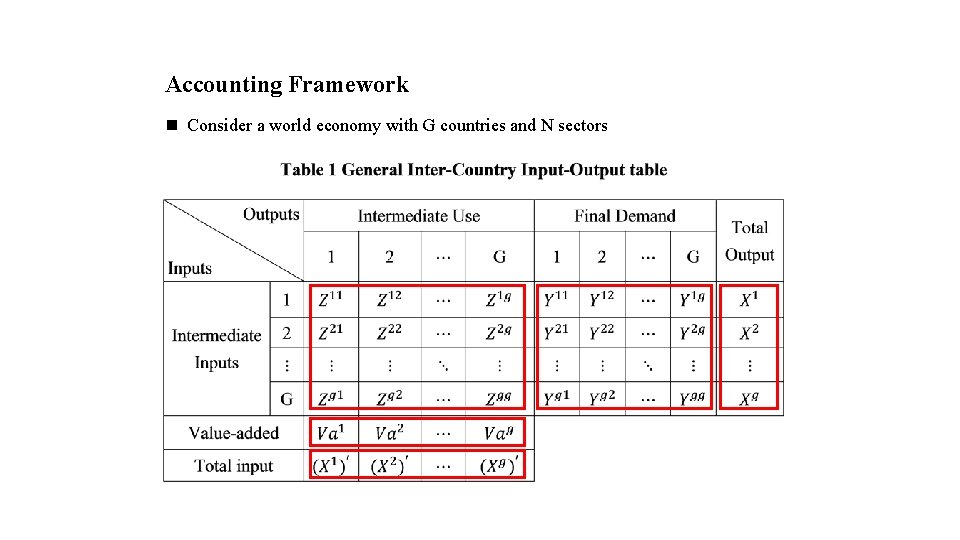
Accounting Framework n Consider a world economy with G countries and N sectors
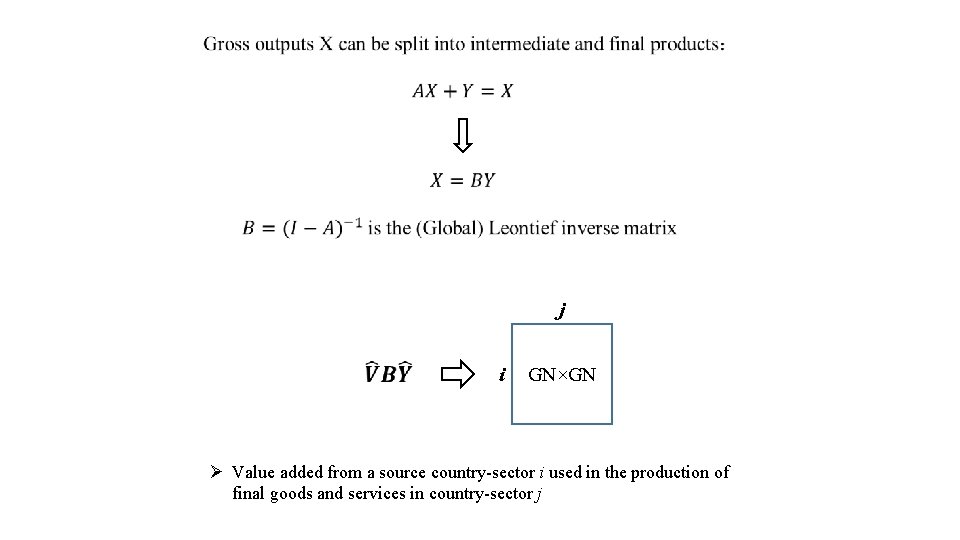
j i GN×GN Ø Value added from a source country-sector i used in the production of final goods and services in country-sector j

Decomposition of value-added and final goods production based on Leontief insights When N=G=2 Decompose GDP by sector; forward linkage based Decompose final goods production by VA source; backward Linkage based


p Summing up along the row direction: Decompose value-added generated from each country-sector pair in terms of where it goes. Figure 1 a Decomposition of GDP — Which types of production and trade are Global Value Chain activities?
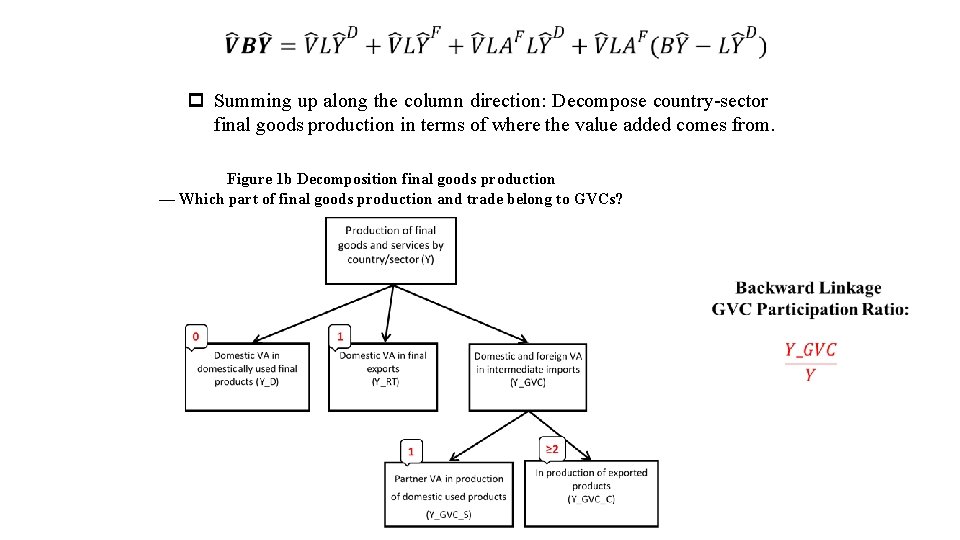
p Summing up along the column direction: Decompose country-sector final goods production in terms of where the value added comes from. Figure 1 b Decomposition final goods production — Which part of final goods production and trade belong to GVCs?
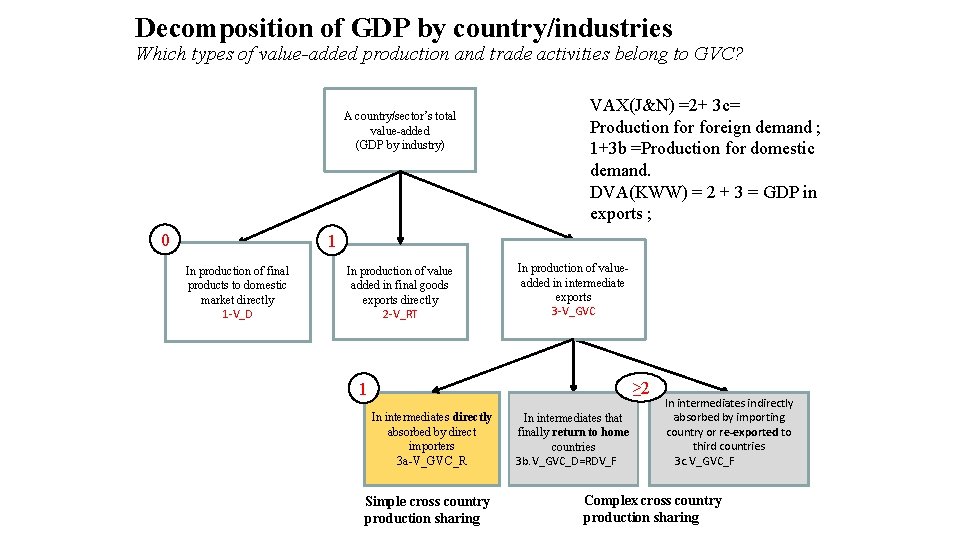
Decomposition of GDP by country/industries Which types of value-added production and trade activities belong to GVC? A country/sector’s total value-added (GDP by industry) 0 1 In production of final products to domestic market directly 1 -V_D In production of value added in final goods exports directly 2 -V_RT VAX(J&N) =2+ 3 c= Production foreign demand ; 1+3 b =Production for domestic demand. DVA(KWW) = 2 + 3 = GDP in exports ; . In production of valueadded in intermediate exports 3 -V_GVC ≥ 2 1 In intermediates directly absorbed by direct importers 3 a-V_GVC_R In intermediates indirectly absorbed by importing country or re-exported to third countries 3 c. V_GVC_F In intermediates that finally return to home countries 3 b. V_GVC_D=RDV_F Simple cross country production sharing Complex cross country production sharing
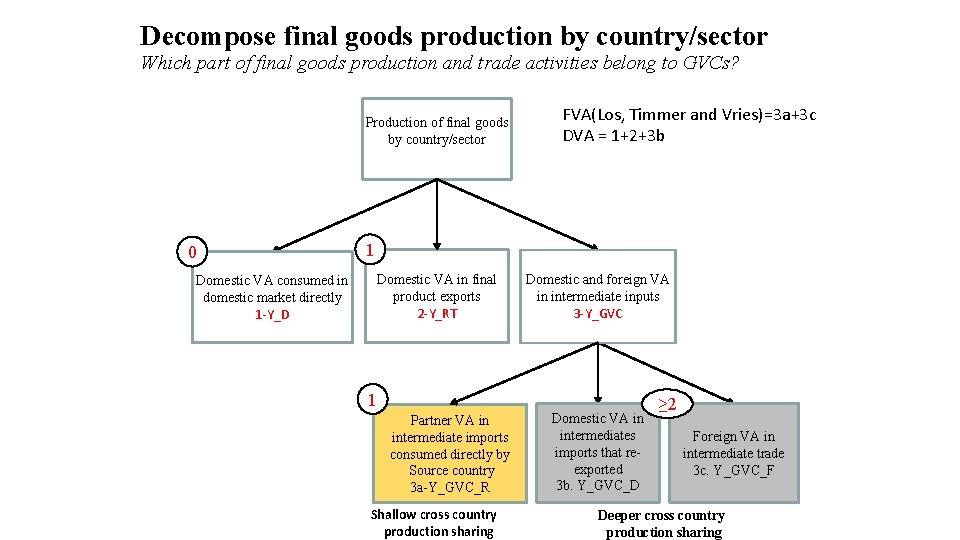
Decompose final goods production by country/sector Which part of final goods production and trade activities belong to GVCs? Production of final goods by country/sector 0 Domestic VA consumed in domestic market directly 1 -Y_D FVA(Los, Timmer and Vries)=3 a+3 c DVA = 1+2+3 b 1 Domestic VA in final product exports 2 -Y_RT Domestic and foreign VA in intermediate inputs 3 -Y_GVC 1 Partner VA in intermediate imports consumed directly by Source country 3 a-Y_GVC_R Shallow cross country production sharing Domestic VA in intermediates imports that reexported 3 b. Y_GVC_D ≥ 2 Foreign VA in intermediate trade 3 c. Y_GVC_F Deeper cross country production sharing
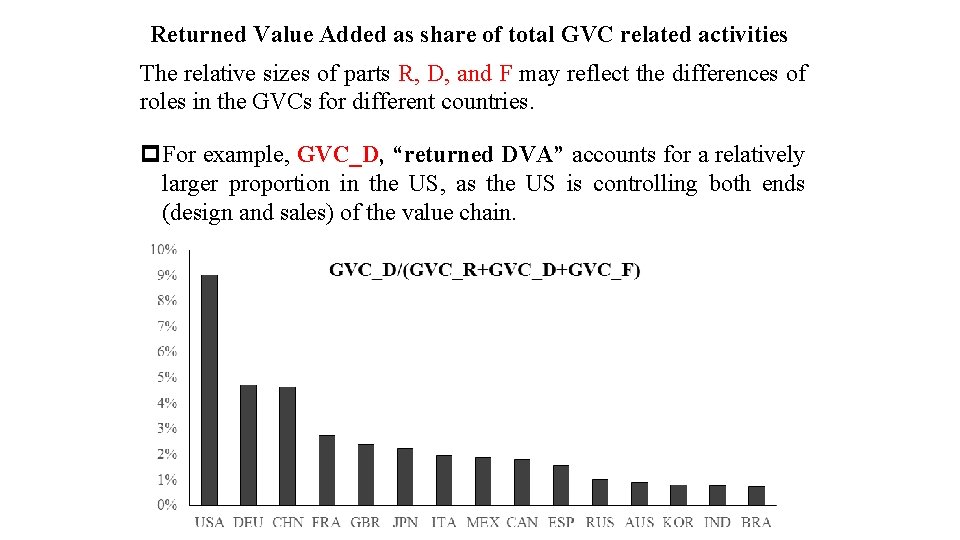
Returned Value Added as share of total GVC related activities The relative sizes of parts R, D, and F may reflect the differences of roles in the GVCs for different countries. p. For example, GVC_D, “returned DVA” accounts for a relatively larger proportion in the US, as the US is controlling both ends (design and sales) of the value chain.
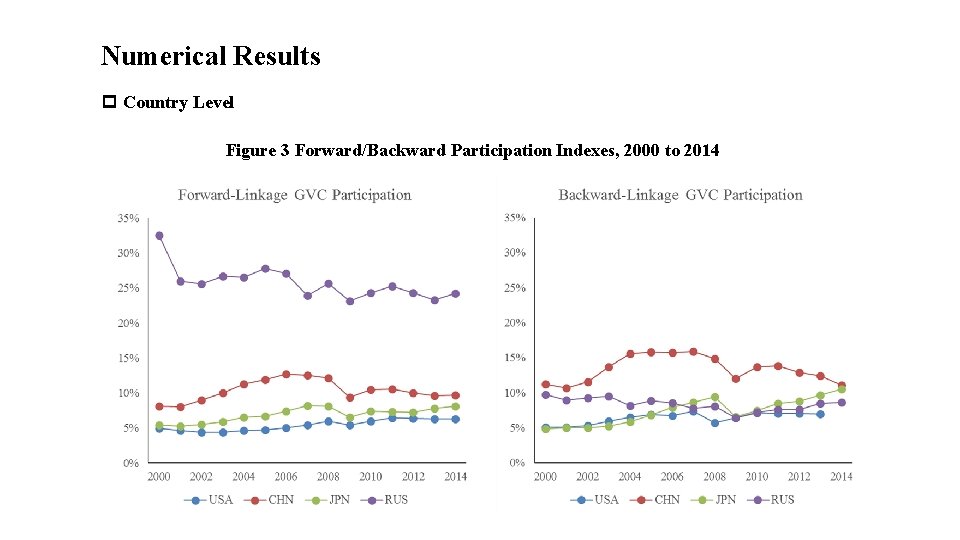
Numerical Results p Country Level Figure 3 Forward/Backward Participation Indexes, 2000 to 2014
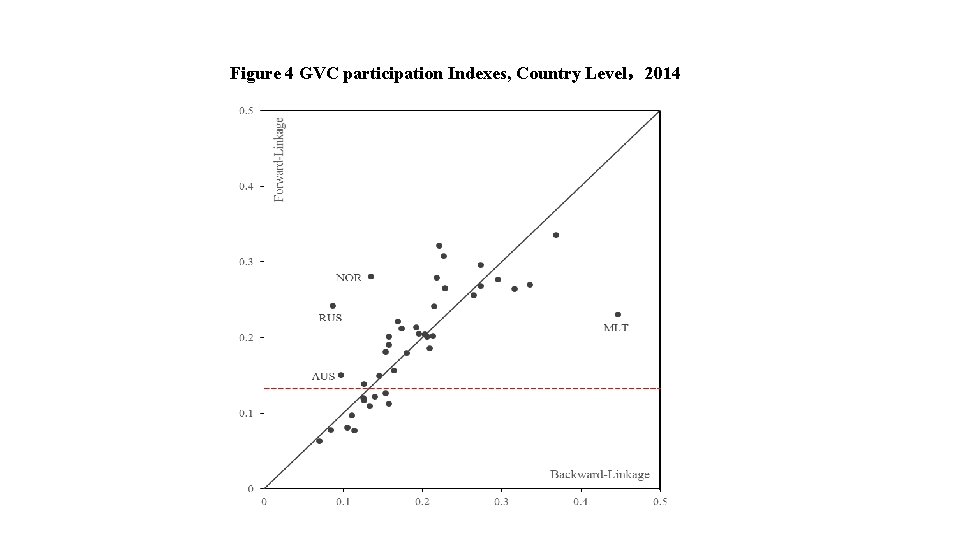
Figure 4 GVC participation Indexes, Country Level,2014
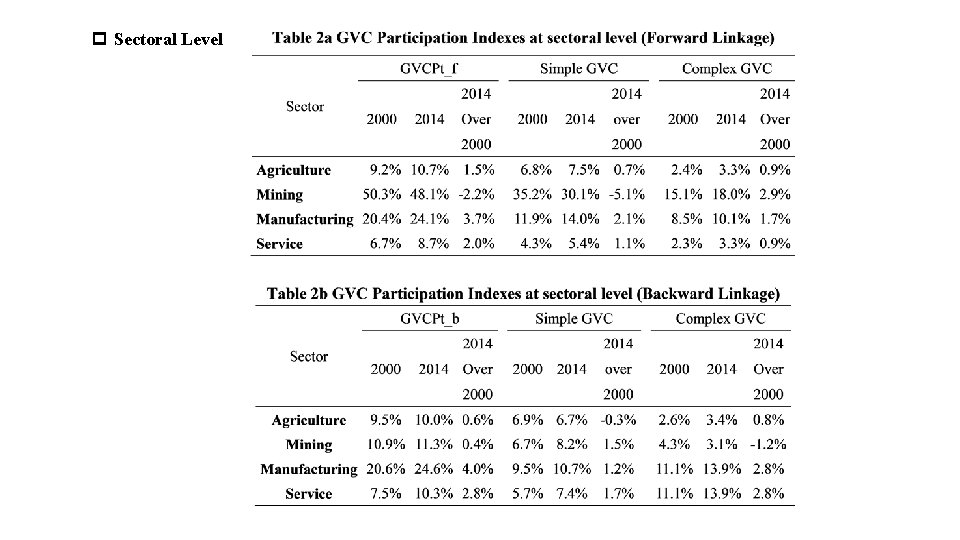
p Sectoral Level
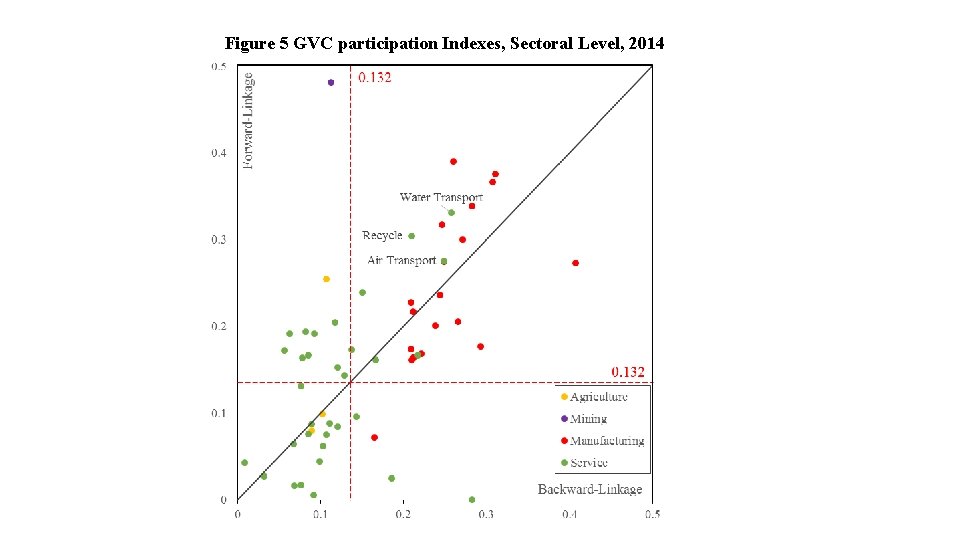
Figure 5 GVC participation Indexes, Sectoral Level, 2014
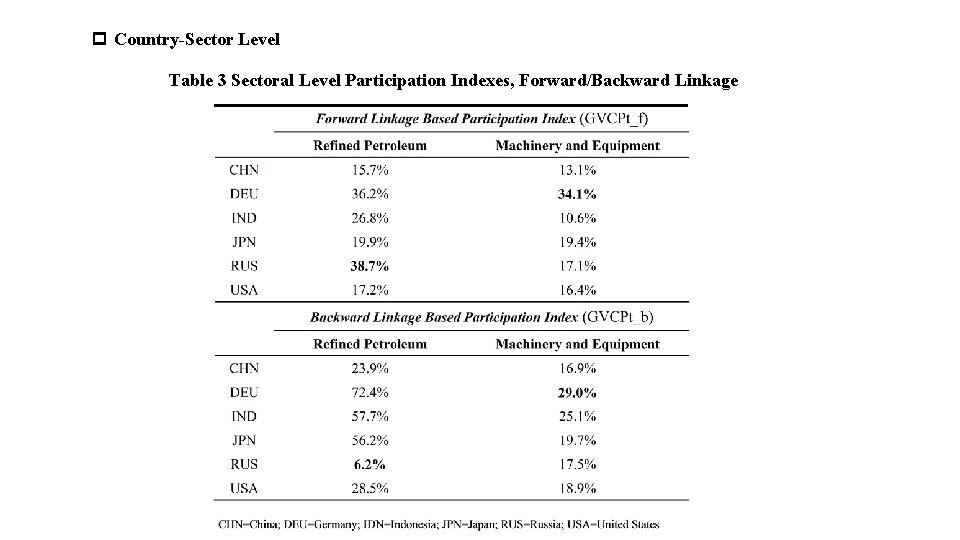
p Country-Sector Level Table 3 Sectoral Level Participation Indexes, Forward/Backward Linkage
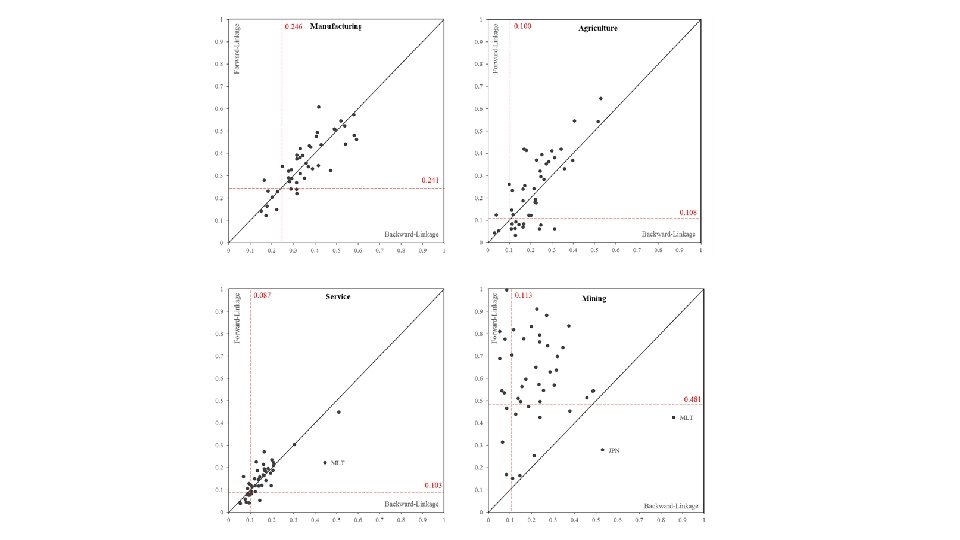
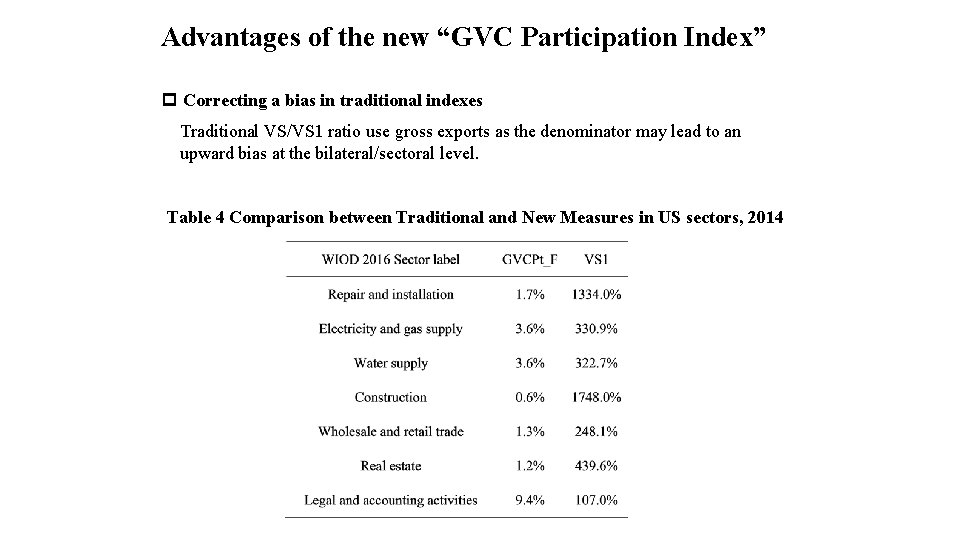
Advantages of the new “GVC Participation Index” p Correcting a bias in traditional indexes Traditional VS/VS 1 ratio use gross exports as the denominator may lead to an upward bias at the bilateral/sectoral level. Table 4 Comparison between Traditional and New Measures in US sectors, 2014
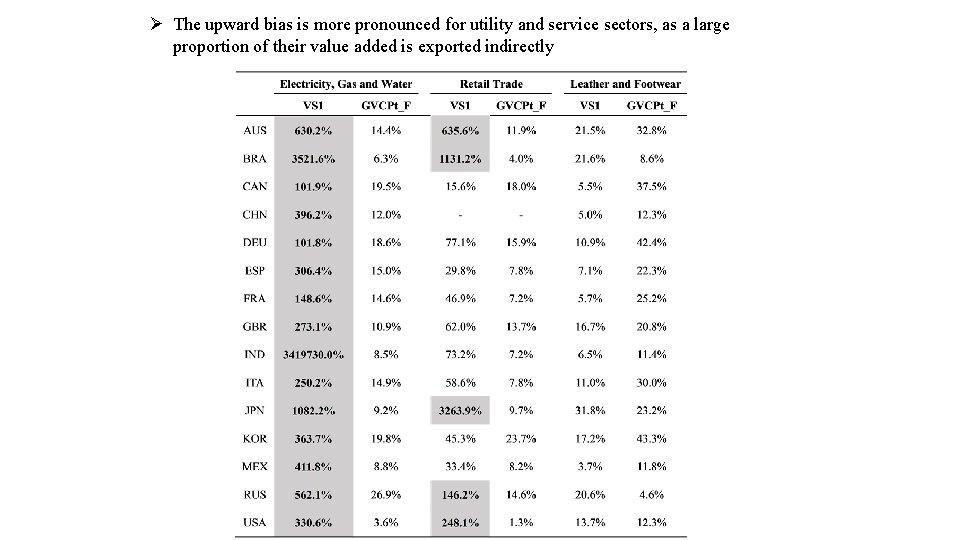
Ø The upward bias is more pronounced for utility and service sectors, as a large proportion of their value added is exported indirectly

p Differentiating “simple” and “complex” GVC participation The “simple” and “complex” parts of GVC participation are different in size and the trend of change
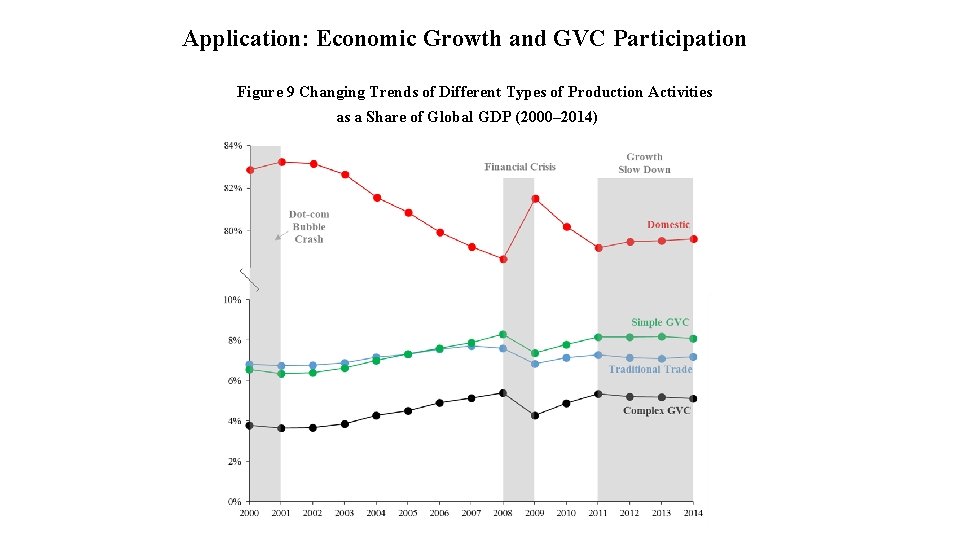
Application: Economic Growth and GVC Participation Figure 9 Changing Trends of Different Types of Production Activities as a Share of Global GDP (2000– 2014)
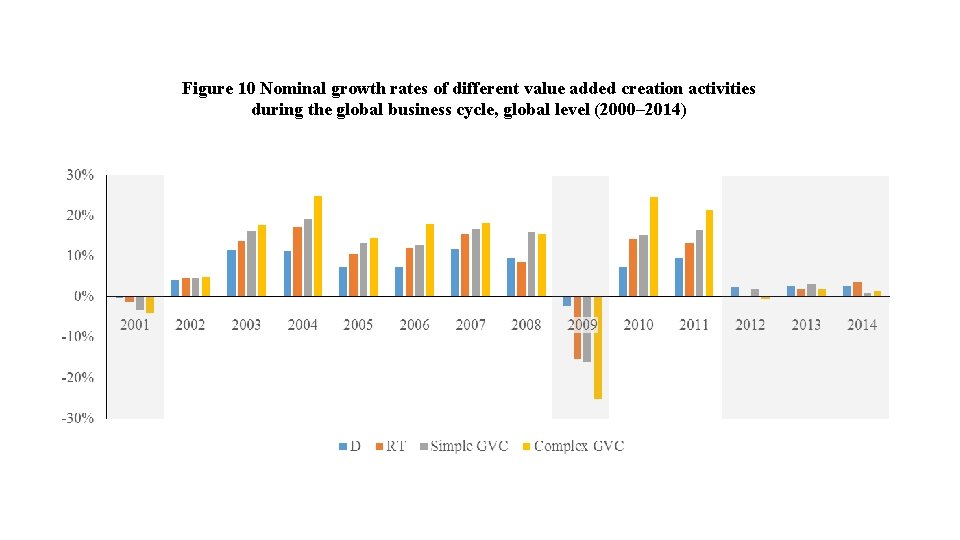
Figure 10 Nominal growth rates of different value added creation activities during the global business cycle, global level (2000– 2014)
p These facts suggest a possible link between the expansion and recession of aggregate economic activities and the share of GVC trade in total production activities. A number of recent papers have suggested that joining GVCs can improve economic growth —— Baldwin and Yan, 2014; OECD, 2014; IMF, 2015, World Bank, 2016 However, none of these studies decomposes trade into traditional trade, and simple and complex GVC activities.
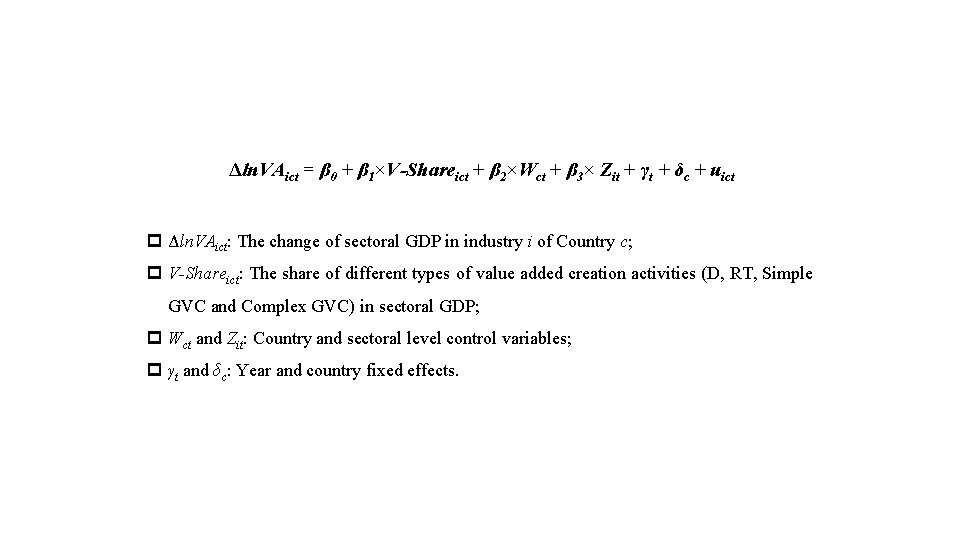
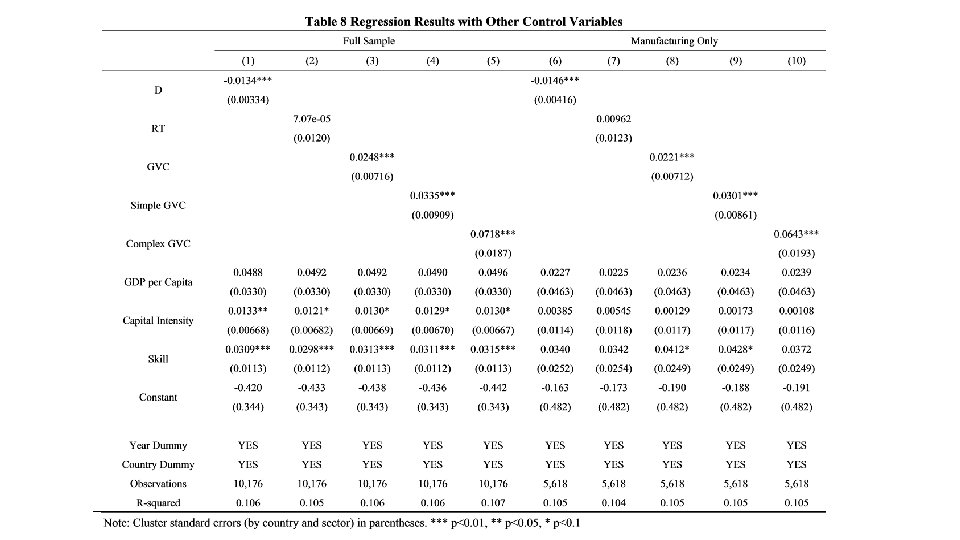
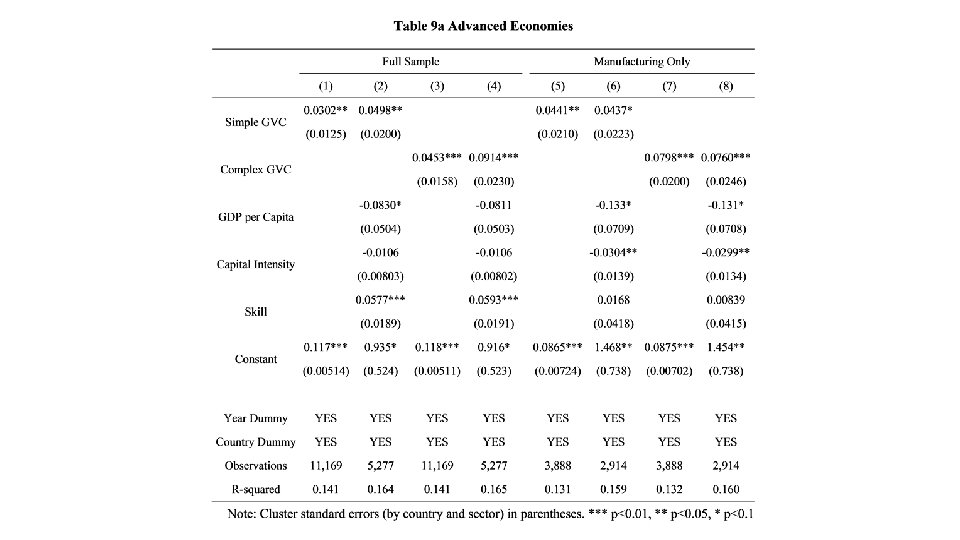
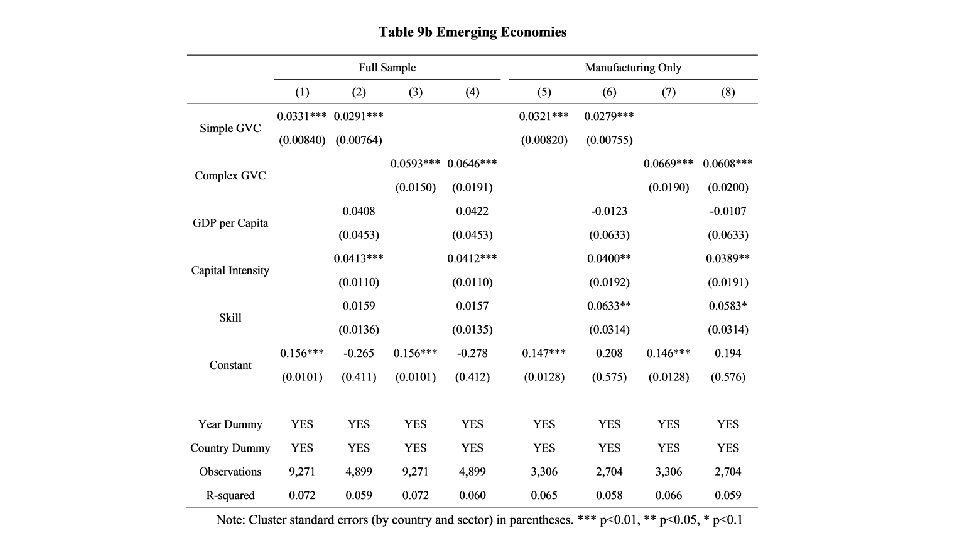
Δln. VAict = β 0 + β 1×V-Shareict + β 2×Wct + β 3× Zit + γt + δc + uict p Δln. VAict: The change of sectoral GDP in industry i of Country c; p V-Shareict: The share of different types of value added creation activities (D, RT, Simple GVC and Complex GVC) in sectoral GDP; p Wct and Zit: Country and sectoral level control variables; p γt and δc: Year and country fixed effects.
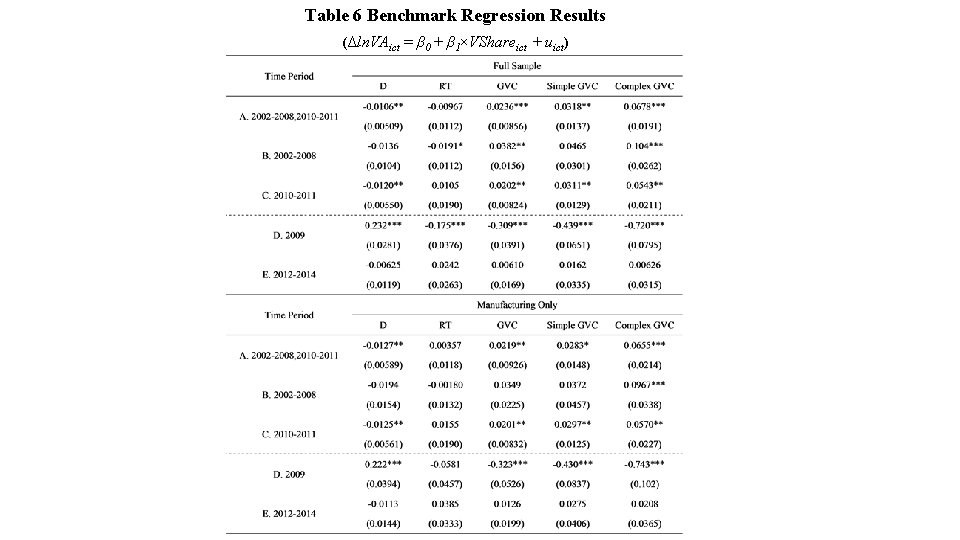
Table 6 Benchmark Regression Results (Δln. VAict = β 0 + β 1×VShareict + uict)
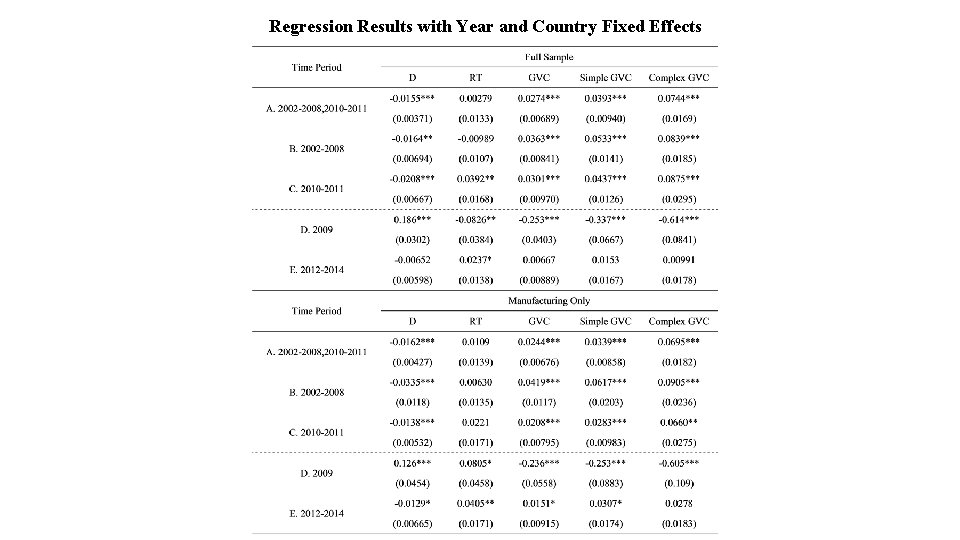
Regression Results with Year and Country Fixed Effects
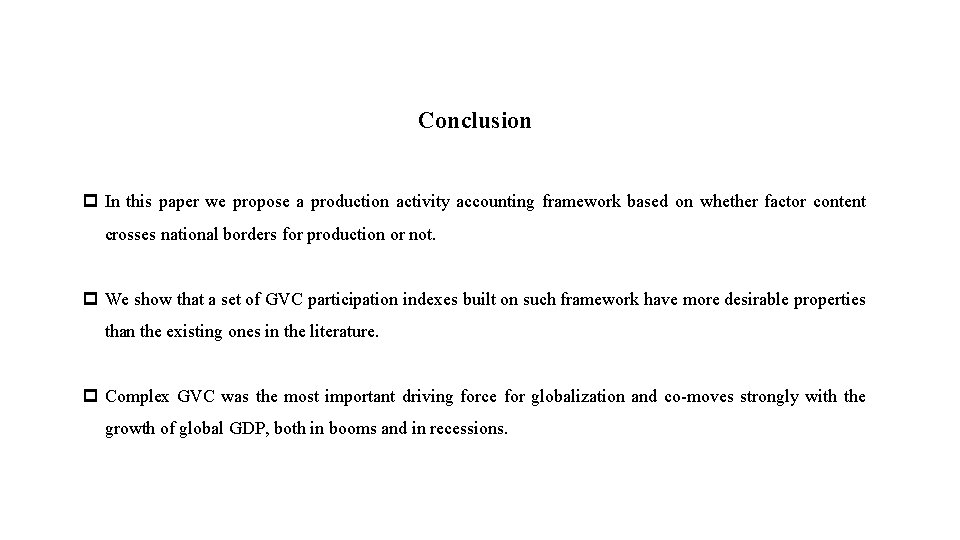
Conclusion p In this paper we propose a production activity accounting framework based on whether factor content crosses national borders for production or not. p We show that a set of GVC participation indexes built on such framework have more desirable properties than the existing ones in the literature. p Complex GVC was the most important driving force for globalization and co-moves strongly with the growth of global GDP, both in booms and in recessions.
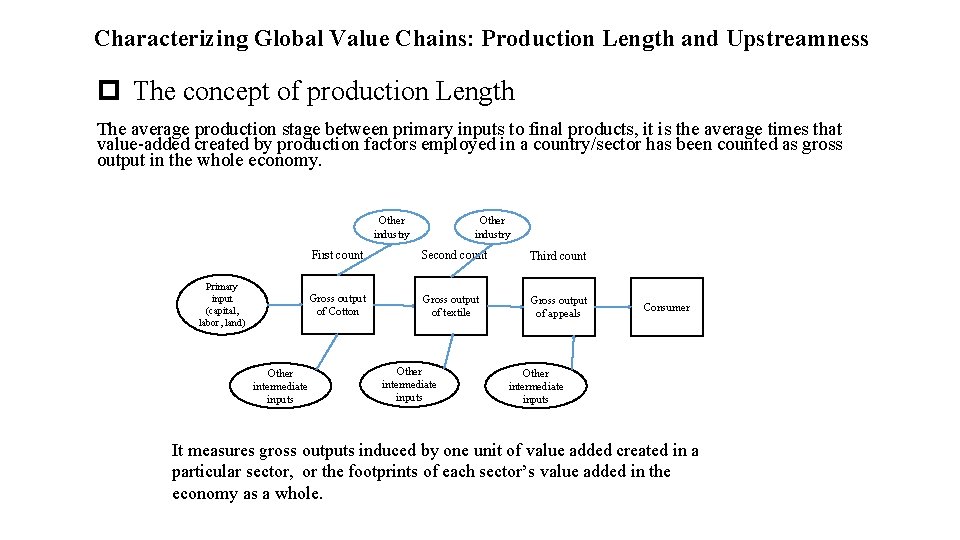
Characterizing Global Value Chains: Production Length and Upstreamness p The concept of production Length The average production stage between primary inputs to final products, it is the average times that value-added created by production factors employed in a country/sector has been counted as gross output in the whole economy. Other industry Primary input (capital, labor, land) First count Second count Third count Gross output of Cotton Gross output of textile Gross output of appeals Other intermediate inputs Consumer Other intermediate inputs It measures gross outputs induced by one unit of value added created in a particular sector, or the footprints of each sector’s value added in the economy as a whole.
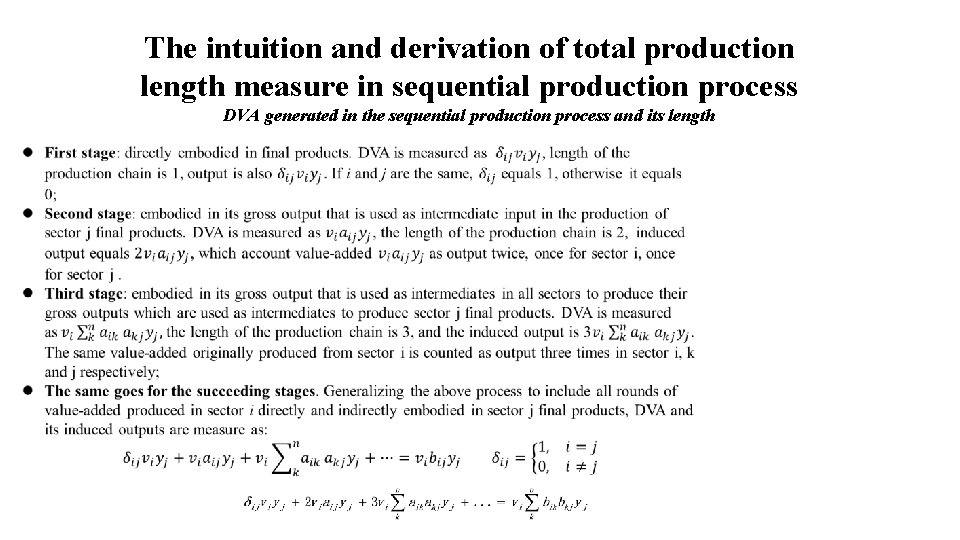
The intuition and derivation of total production length measure in sequential production process DVA generated in the sequential production process and its length
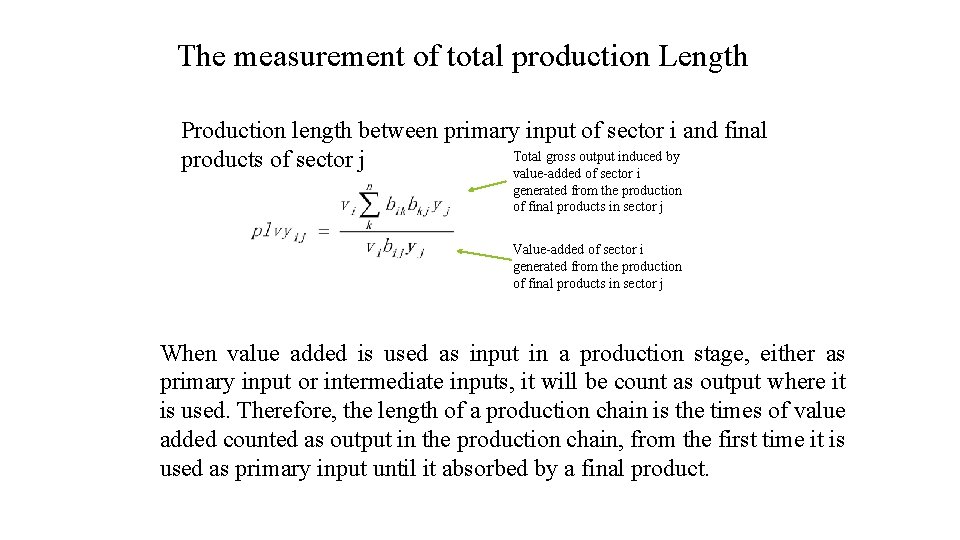
The measurement of total production Length Production length between primary input of sector i and final Total gross output induced by products of sector j value-added of sector i generated from the production of final products in sector j Value-added of sector i generated from the production of final products in sector j When value added is used as input in a production stage, either as primary input or intermediate inputs, it will be count as output where it is used. Therefore, the length of a production chain is the times of value added counted as output in the production chain, from the first time it is used as primary input until it absorbed by a final product.
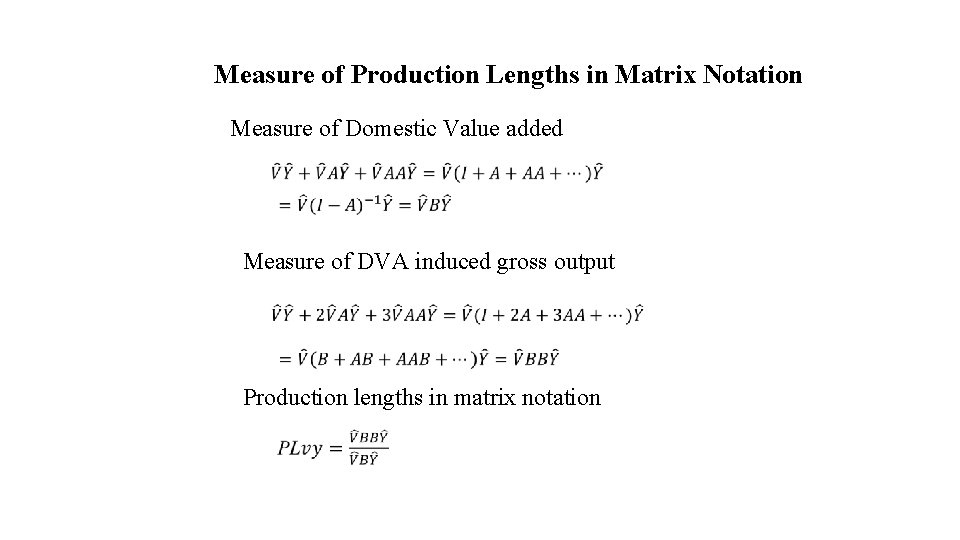
Measure of Production Lengths in Matrix Notation Measure of Domestic Value added Measure of DVA induced gross output Production lengths in matrix notation
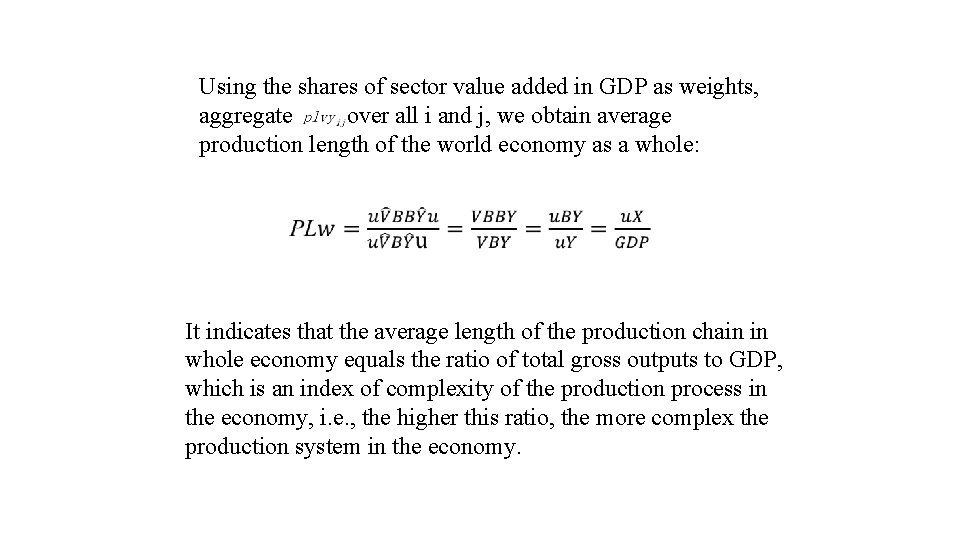
Using the shares of sector value added in GDP as weights, aggregate over all i and j, we obtain average production length of the world economy as a whole: It indicates that the average length of the production chain in whole economy equals the ratio of total gross outputs to GDP, which is an index of complexity of the production process in the economy, i. e. , the higher this ratio, the more complex the production system in the economy.
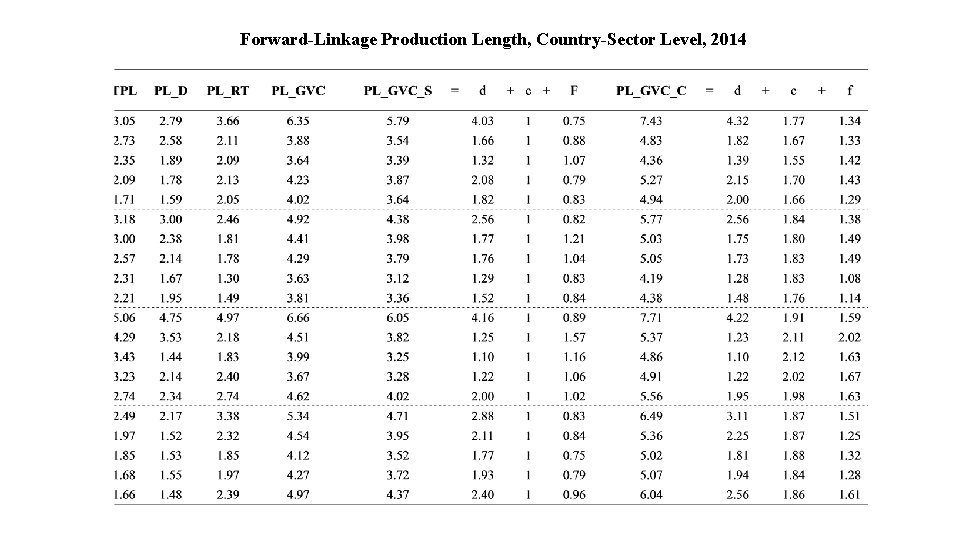
Forward-Linkage Production Length, Country-Sector Level, 2014
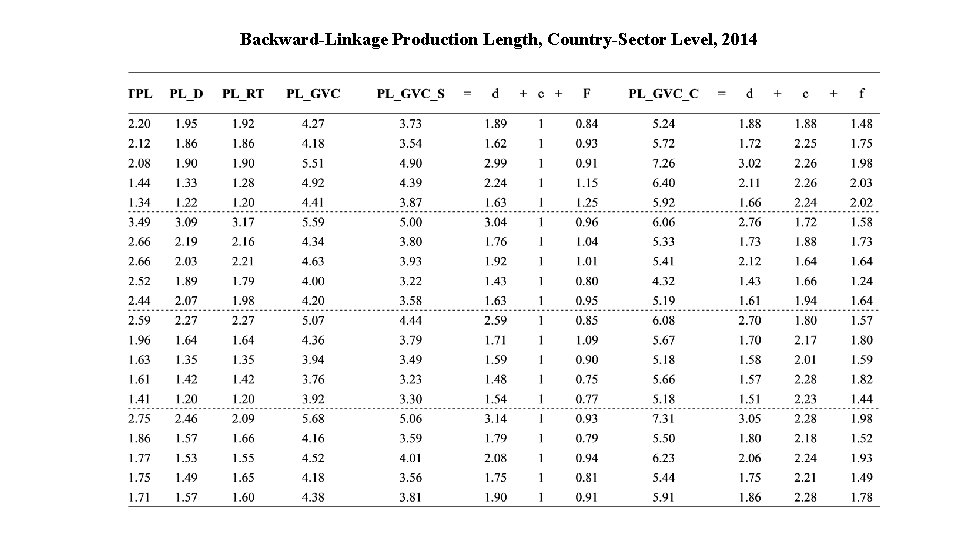
Backward-Linkage Production Length, Country-Sector Level, 2014
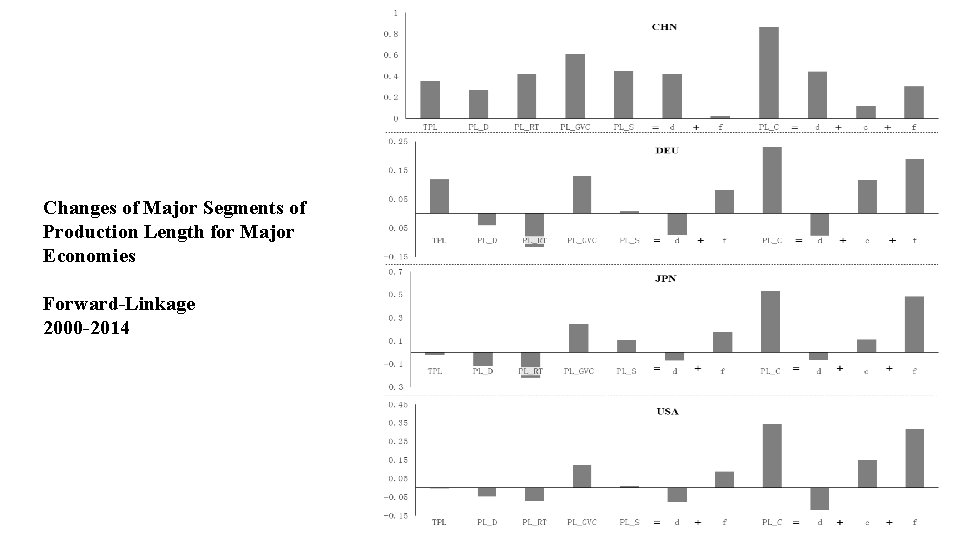
Changes of Major Segments of Production Length for Major Economies Forward-Linkage 2000 -2014
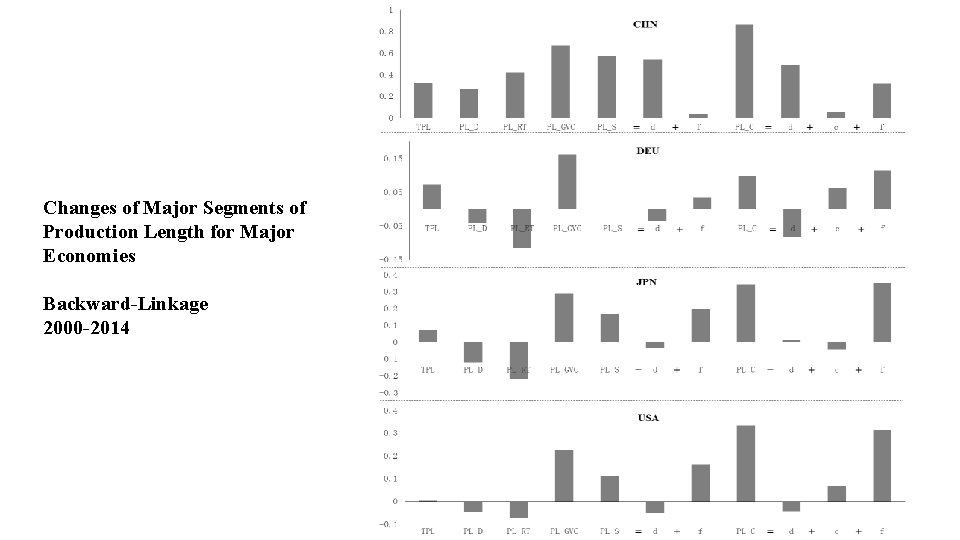
Changes of Major Segments of Production Length for Major Economies Backward-Linkage 2000 -2014
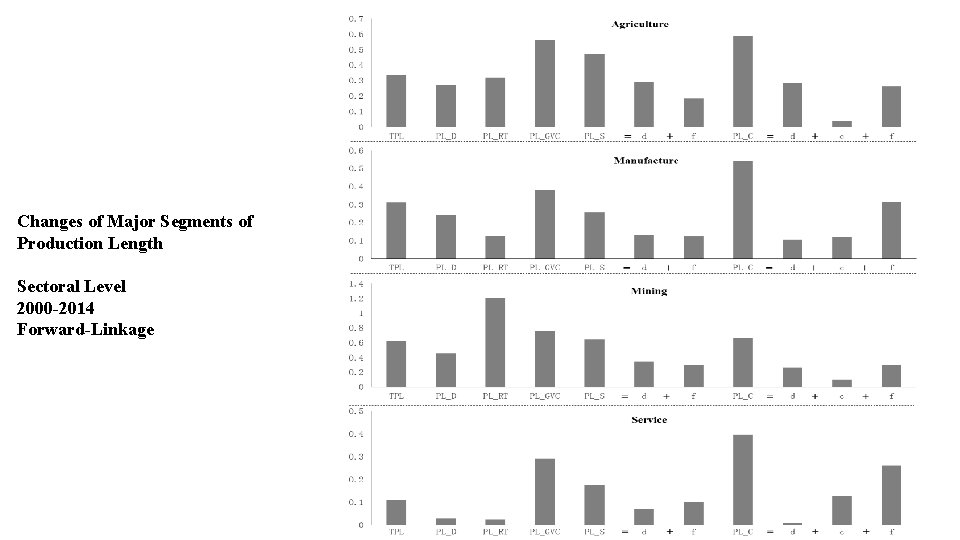
Changes of Major Segments of Production Length Sectoral Level 2000 -2014 Forward-Linkage
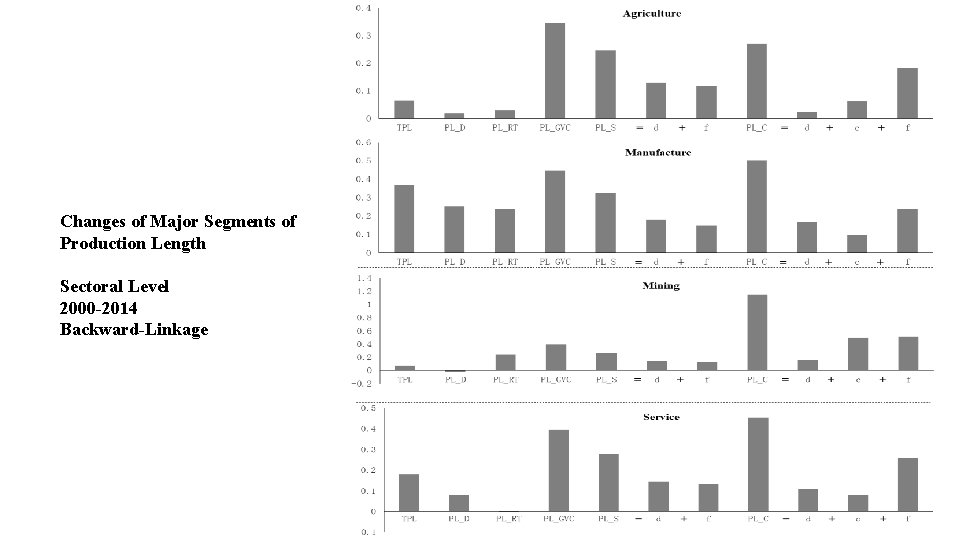
Changes of Major Segments of Production Length Sectoral Level 2000 -2014 Backward-Linkage
Can production length measure directly infer production line position? • Production lengths based on forward and backward linkage are equal each other at the global level because the accounting identity of global final demand always sums to global valueadded. However, they may not equal each other at the country or country/sector level due to international trade and cross border production activities. • What is the relation between production length measure and production line position? Can production length measure be used directly to infer “upstreamness” or “downstreamness” of a country or a country/sector pair? Current literature is not clear on such important questions and often uses production length to infer production line position directly.
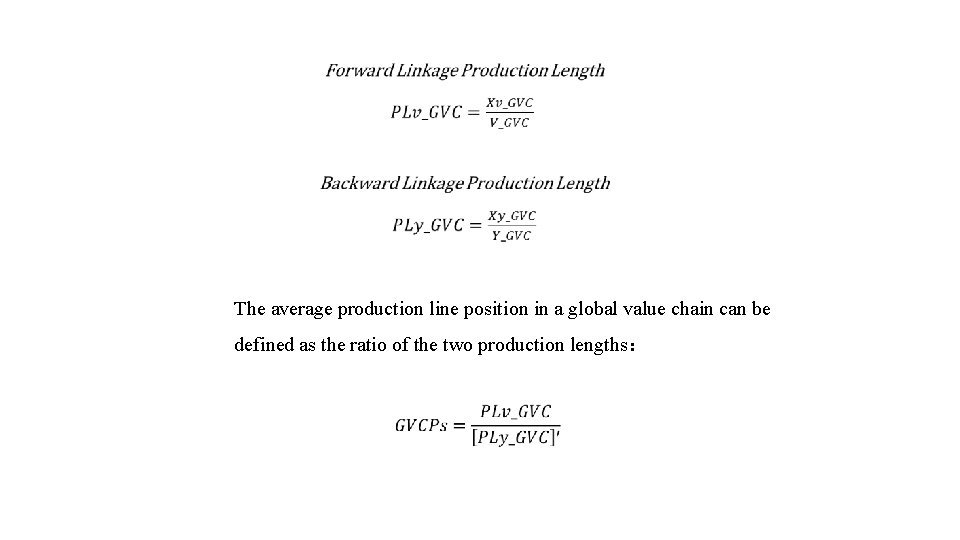
The average production line position in a global value chain can be defined as the ratio of the two production lengths:
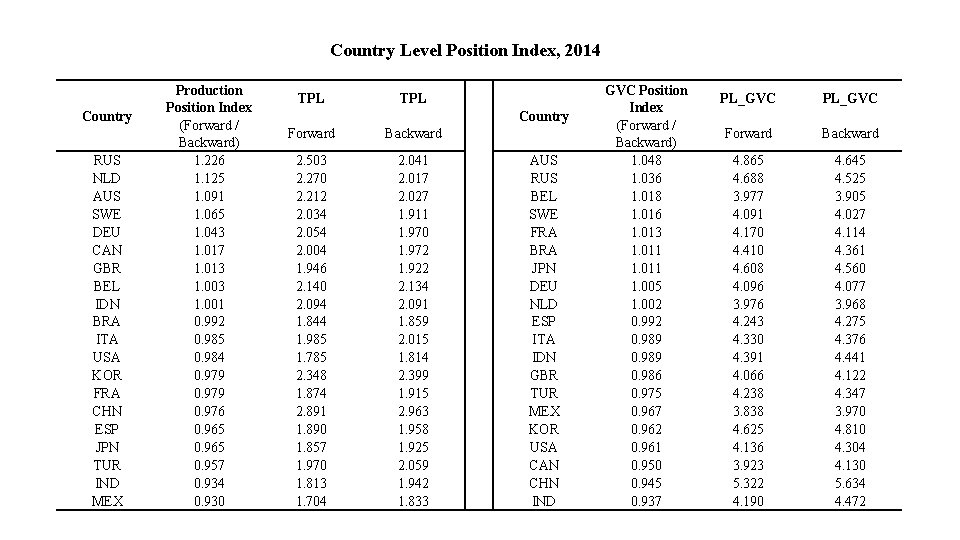
Country Level Position Index, 2014 Country RUS NLD AUS SWE DEU CAN GBR BEL IDN BRA ITA USA KOR FRA CHN ESP JPN TUR IND MEX Production Position Index (Forward / Backward) 1. 226 1. 125 1. 091 1. 065 1. 043 1. 017 1. 013 1. 001 0. 992 0. 985 0. 984 0. 979 0. 976 0. 965 0. 957 0. 934 0. 930 TPL Country Forward Backward 2. 503 2. 270 2. 212 2. 034 2. 054 2. 004 1. 946 2. 140 2. 094 1. 844 1. 985 1. 785 2. 348 1. 874 2. 891 1. 890 1. 857 1. 970 1. 813 1. 704 2. 041 2. 017 2. 027 1. 911 1. 970 1. 972 1. 922 2. 134 2. 091 1. 859 2. 015 1. 814 2. 399 1. 915 2. 963 1. 958 1. 925 2. 059 1. 942 1. 833 AUS RUS BEL SWE FRA BRA JPN DEU NLD ESP ITA IDN GBR TUR MEX KOR USA CAN CHN IND GVC Position Index (Forward / Backward) 1. 048 1. 036 1. 018 1. 016 1. 013 1. 011 1. 005 1. 002 0. 992 0. 989 0. 986 0. 975 0. 967 0. 962 0. 961 0. 950 0. 945 0. 937 PL_GVC Forward Backward 4. 865 4. 688 3. 977 4. 091 4. 170 4. 410 4. 608 4. 096 3. 976 4. 243 4. 330 4. 391 4. 066 4. 238 3. 838 4. 625 4. 136 3. 923 5. 322 4. 190 4. 645 4. 525 3. 905 4. 027 4. 114 4. 361 4. 560 4. 077 3. 968 4. 275 4. 376 4. 441 4. 122 4. 347 3. 970 4. 810 4. 304 4. 130 5. 634 4. 472
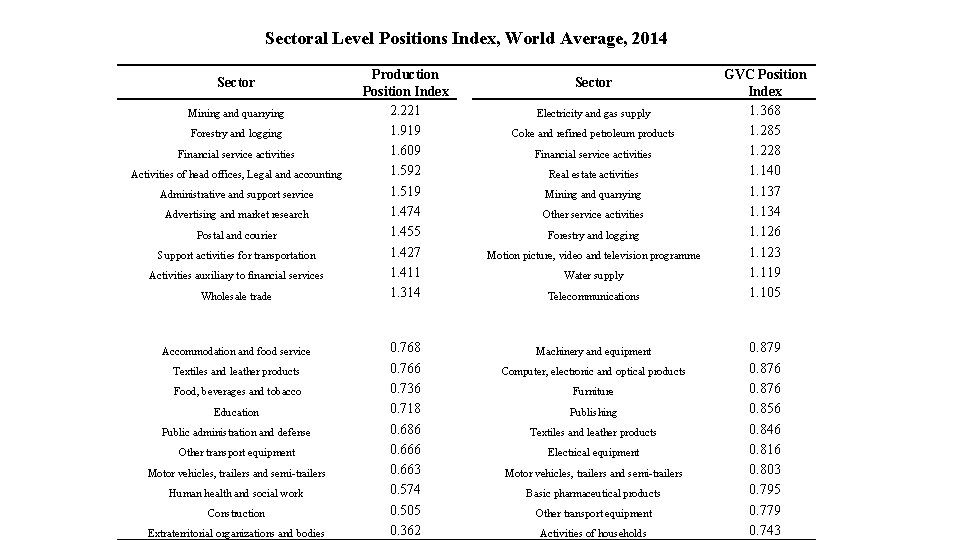
Sectoral Level Positions Index, World Average, 2014 Sector Mining and quarrying Forestry and logging Financial service activities Activities of head offices, Legal and accounting Administrative and support service Advertising and market research Postal and courier Support activities for transportation Activities auxiliary to financial services Wholesale trade Accommodation and food service Textiles and leather products Food, beverages and tobacco Education Public administration and defense Other transport equipment Motor vehicles, trailers and semi-trailers Human health and social work Construction Extraterritorial organizations and bodies Production Position Index 2. 221 1. 919 1. 609 1. 592 1. 519 1. 474 1. 455 1. 427 1. 411 1. 314 0. 768 0. 766 0. 736 0. 718 0. 686 0. 663 0. 574 0. 505 0. 362 Sector Electricity and gas supply Coke and refined petroleum products Financial service activities Real estate activities Mining and quarrying Other service activities Forestry and logging Motion picture, video and television programme Water supply Telecommunications Machinery and equipment Computer, electronic and optical products Furniture Publishing Textiles and leather products Electrical equipment Motor vehicles, trailers and semi-trailers Basic pharmaceutical products Other transport equipment Activities of households GVC Position Index 1. 368 1. 285 1. 228 1. 140 1. 137 1. 134 1. 126 1. 123 1. 119 1. 105 0. 879 0. 876 0. 856 0. 846 0. 816 0. 803 0. 795 0. 779 0. 743
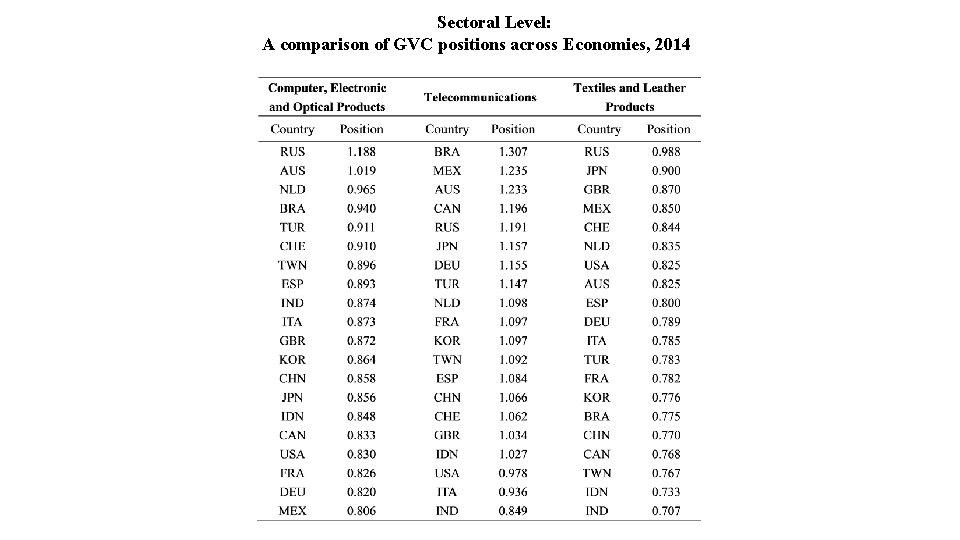
Sectoral Level: A comparison of GVC positions across Economies, 2014
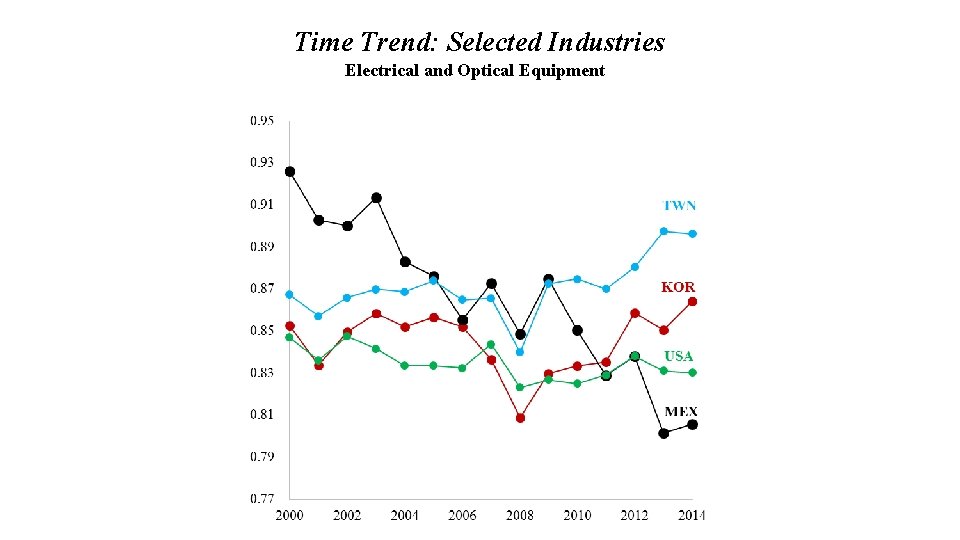
Time Trend: Selected Industries Electrical and Optical Equipment
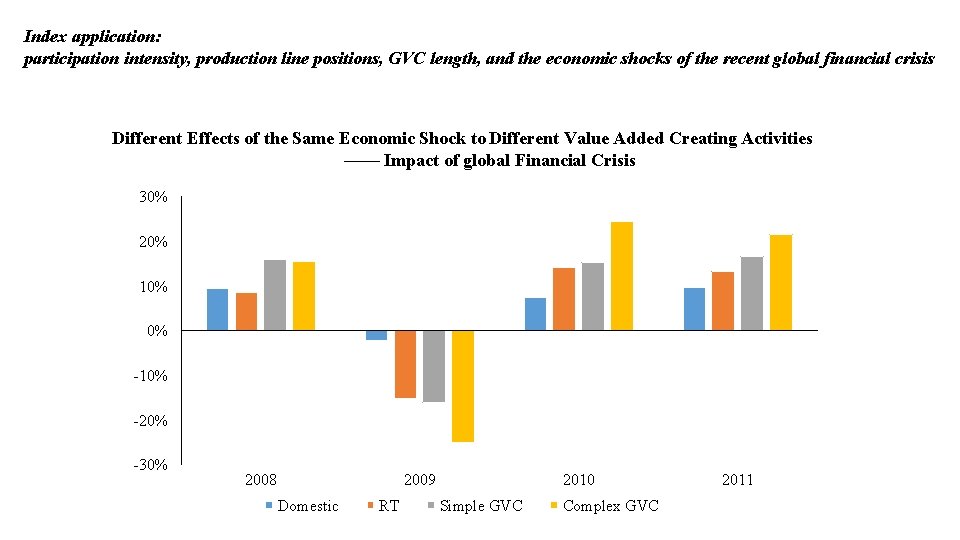
Index application: participation intensity, production line positions, GVC length, and the economic shocks of the recent global financial crisis Different Effects of the Same Economic Shock to Different Value Added Creating Activities —— Impact of global Financial Crisis 30% 20% 10% 0% -10% -20% -30% 2008 2009 Domestic RT 2010 Simple GVC Complex GVC 2011
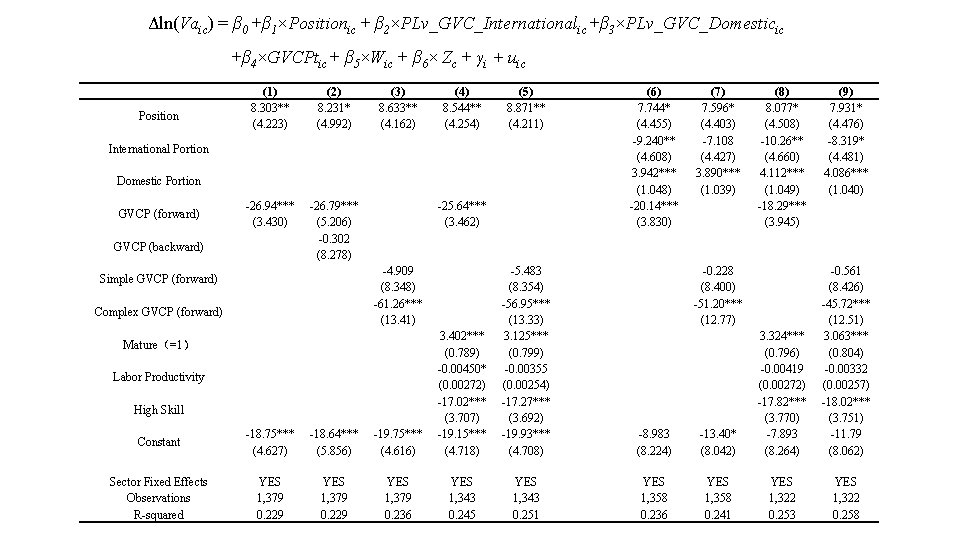
Δln(Vaic) = β 0 +β 1×Positionic + β 2×PLv_GVC_Internationalic +β 3×PLv_GVC_Domesticic +β 4×GVCPtic + β 5×Wic + β 6× Zc + γi + uic Position (1) 8. 303** (4. 223) (2) 8. 231* (4. 992) -26. 94*** (3. 430) -26. 79*** (5. 206) -0. 302 (8. 278) (3) 8. 633** (4. 162) (4) 8. 544** (4. 254) (5) 8. 871** (4. 211) International Portion Domestic Portion GVCP (forward) GVCP (backward) -25. 64*** (3. 462) -4. 909 (8. 348) -61. 26*** (13. 41) Simple GVCP (forward) Complex GVCP (forward) Constant -18. 75*** (4. 627) -18. 64*** (5. 856) -19. 75*** (4. 616) 3. 402*** (0. 789) -0. 00450* (0. 00272) -17. 02*** (3. 707) -19. 15*** (4. 718) Sector Fixed Effects Observations R-squared YES 1, 379 0. 229 YES 1, 379 0. 236 YES 1, 343 0. 245 Mature(=1) Labor Productivity High Skill (6) 7. 744* (4. 455) -9. 240** (4. 608) 3. 942*** (1. 048) -20. 14*** (3. 830) -5. 483 (8. 354) -56. 95*** (13. 33) 3. 125*** (0. 799) -0. 00355 (0. 00254) -17. 27*** (3. 692) -19. 93*** (4. 708) -8. 983 (8. 224) YES 1, 343 0. 251 YES 1, 358 0. 236 (7) 7. 596* (4. 403) -7. 108 (4. 427) 3. 890*** (1. 039) (8) 8. 077* (4. 508) -10. 26** (4. 660) 4. 112*** (1. 049) -18. 29*** (3. 945) -0. 228 (8. 400) -51. 20*** (12. 77) (9) 7. 931* (4. 476) -8. 319* (4. 481) 4. 086*** (1. 040) -13. 40* (8. 042) 3. 324*** (0. 796) -0. 00419 (0. 00272) -17. 82*** (3. 770) -7. 893 (8. 264) -0. 561 (8. 426) -45. 72*** (12. 51) 3. 063*** (0. 804) -0. 00332 (0. 00257) -18. 02*** (3. 751) -11. 79 (8. 062) YES 1, 358 0. 241 YES 1, 322 0. 253 YES 1, 322 0. 258
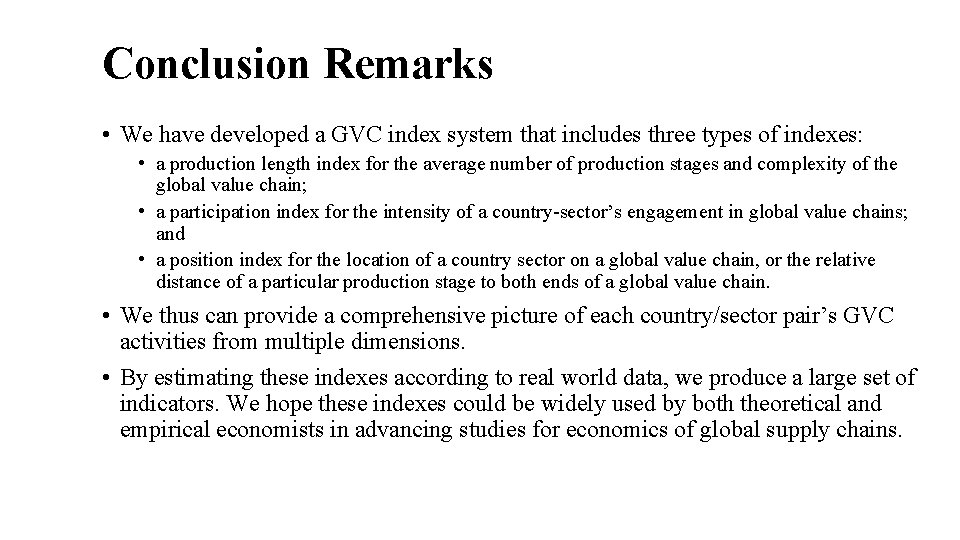
Conclusion Remarks • We have developed a GVC index system that includes three types of indexes: • a production length index for the average number of production stages and complexity of the global value chain; • a participation index for the intensity of a country-sector’s engagement in global value chains; and • a position index for the location of a country sector on a global value chain, or the relative distance of a particular production stage to both ends of a global value chain. • We thus can provide a comprehensive picture of each country/sector pair’s GVC activities from multiple dimensions. • By estimating these indexes according to real world data, we produce a large set of indicators. We hope these indexes could be widely used by both theoretical and empirical economists in advancing studies for economics of global supply chains.

Thanks!
- Slides: 53