Measures of central tendency Computation of mean median


 • \"Mean\" is computed by adding all of the numbers in")
 • \"Median\" of a data set is dependent on whether the")

 • \"Mode\" for a data set is the element that")


- Slides: 33
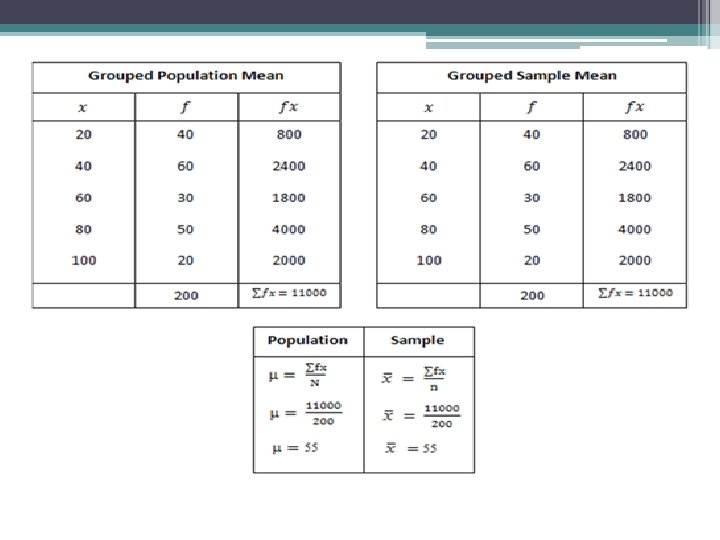
Measures of central tendency Computation of mean, median and mode from grouped and ungrouped data
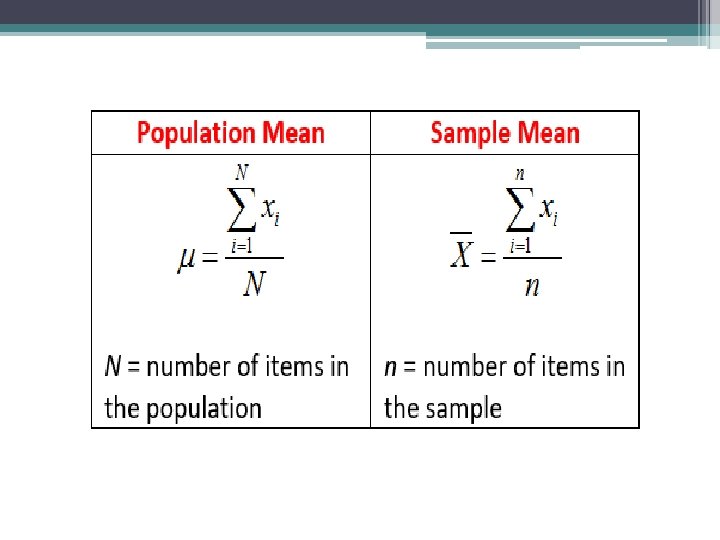
Measures of Central Tendency • Defined as a single value that is used to describe the “center” of the data. • There are three commonly used measures of central tendency. • These are the following: üMEAN üMEDIAN üMODE
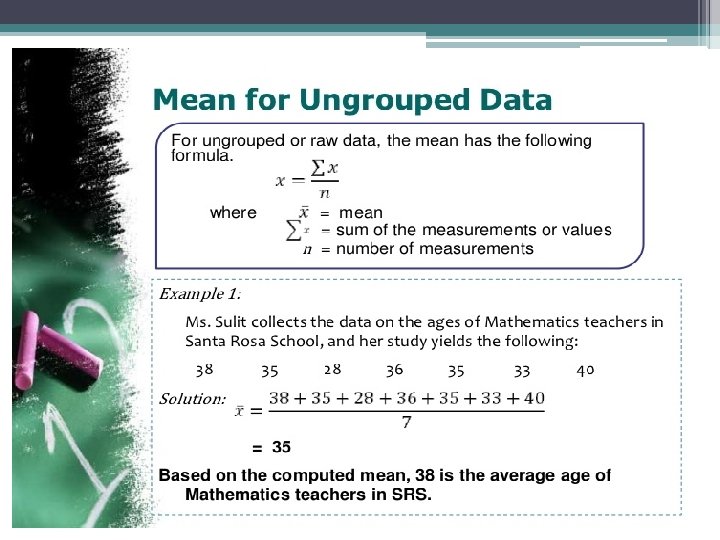
Mean : (average) • "Mean" is computed by adding all of the numbers in the data together and dividing by the number elements contained in the data set. Example : Data Set = 2, 5, 9, 3, 5, 4, 7 • Number of Elements in Data Set = 7 • Mean = ( 2 + 5 + 9 + 7 + 5 + 4 + 3 ) / 7 = 5
Median : (middle) • "Median" of a data set is dependent on whether the number of elements in the data set is odd or even. • First reorder the data set from the smallest to the largest • Mark off high and low values until you reach the middle. • If there 2 middles, add them and divide by 2.
Examples : Odd Number of Elements Data Set = 2, 5, 9, 3, 5, 4, 7 Reordered = 2, 3, 4, 5, 5, 7, 9 Median = 5 Examples : Even Number of Elements Data Set = 2, 5, 9, 3, 5, 4 Reordered = 2, 3, 4, 5, 5, 9 Median = ( 4 + 5 ) / 2 = 4. 5
Mode : (most often) • "Mode" for a data set is the element that occurs the most often. • This happens when two or more elements occur with equal frequency in the data set. Example : • Data Set = 2, 5, 9, 3, 5, 4, 7 • Mode = 5 Example: • Data Set = 2, 5, 2, 3, 5, 4, 7 • Modes = 2 and 5
• Sample Question: Find the sample mean for the following set of numbers: 12, 13, 14, 16, 17, 40, 43, 55, 56, 67, 78, 79, 80, 81, 90, 99, 101, 102, 304, 306, 400, 401, 403, 404, 405. • Step 1: Add up all of the numbers: 12 + 13 + 14 + 16 + 17 + 40 + 43 + 55 + 56 + 67 + 78 + 79 + 80 + 81 + 90 + 99 + 101 + 102 + 304 + 306 + 400 + 401 + 403 + 404 + 405 = 3744. • Step 2: Count the numbers of items in your data set. In this particular data set there are 26 items. • Step 3: Divide the number you found in Step 1 by the number you found in Step 2. 3744/26 = 144. x = ( Σ xi ) / n = 3744/26 = 144
MEDIAN • Median is what divides the scores in the distribution into two equal parts. • It is also known as the middle score or the 50 th percentile. • Fifty percent (50%) lies below the median value and 50% lies above the median value.
Median of Ungrouped Data • Determine the middle most score in a distribution if n is an odd number and get the average of the two middle most scores if n is an even number. • Example 1: Find the median score of 7 students in an English class. x (score) 30 19 17 16 15 10 5 2 x = 16 + 15 2 x = 15. 5
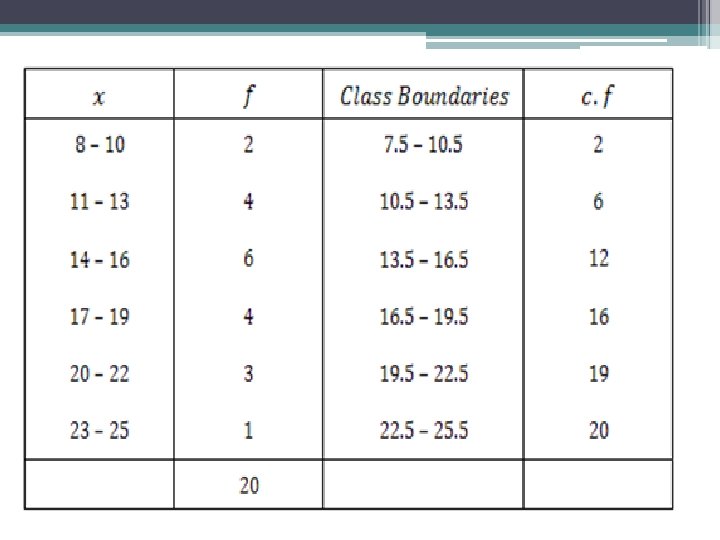
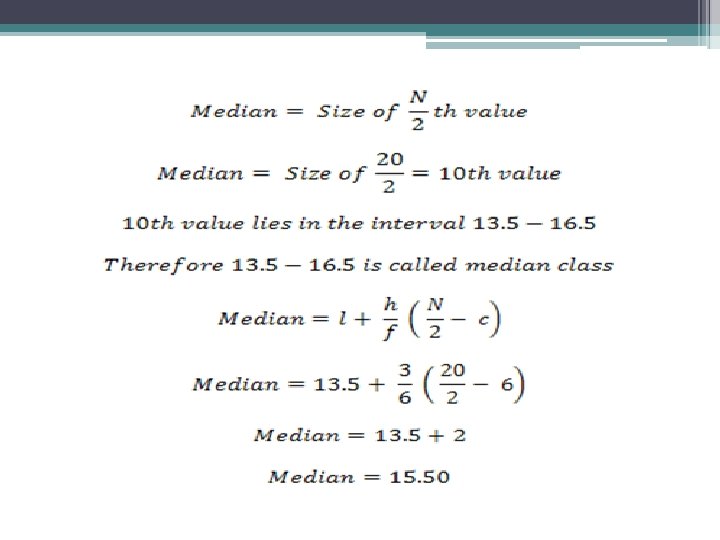
Median for grouped data • Calculation of the median from a grouped frequency distribution
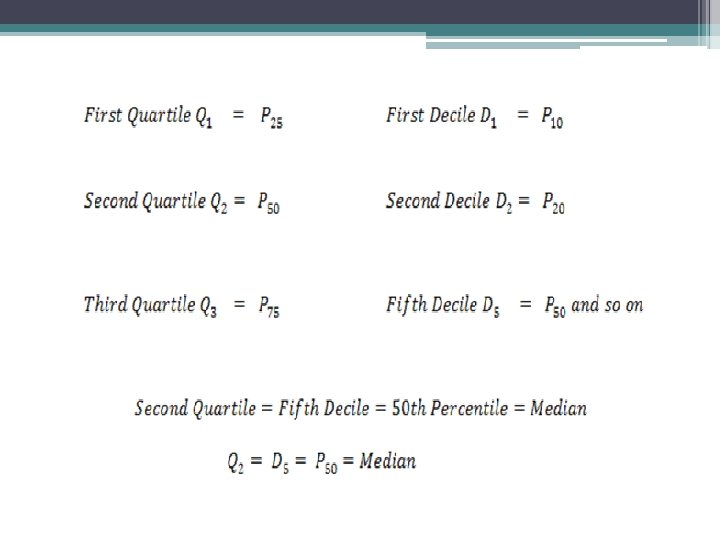
It split a data set into four equal parts
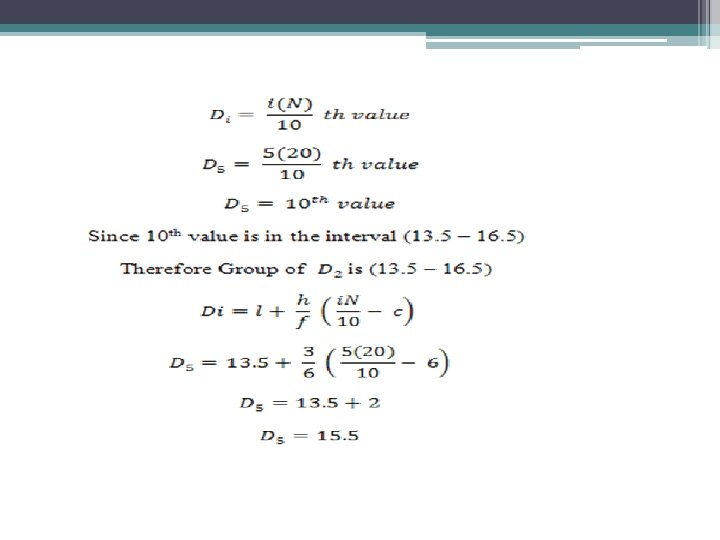
Deciles It split the data set into ten equal parts.
Percentiles • It split the data set into a hundred equal parts. These percentiles can be used to categorize the individuals into percentile 1, . . . , percentile 100.
Hence Prove: Q 2 = D 5=P 50= Median
Mode • The mode or the modal score is a score or scores that occurred most in the distribution. • It is classified as unimodal, bimodal, trimodal or mulitimodal. • Unimodal is a distribution of scores that consists of only one mode • Bimodal is a distribution of scores that consists of two modes. • Trimodal is a distribution of scores that consists of three modes or multimodal is a distribution of scores that consists of more than two modes.
Example Find the modes of the following data sets: 3, 6, 4, 12, 5, 7, 9, 3, 5, 1, 5 Solution The value with the highest frequency is 5 (which occurs 3 times). Hence the mode is Mo = 5.
Mode For Grouped data
Find out Mode from a given data?
Empirical Relationship Between Mean, Median And Mode • A distribution in which the values of mean, median and mode coincide (i. e. mean = median = mode) is known as a symmetrical distribution.
Positively Skewed
Negatively Skewed
Moderately skewed or asymmetrical distribution • In moderately skewed or asymmetrical distribution is very important relationship exists among these three measures of central tendency. • In such distributions the distance between the mean and median is about one-third of the distance between the mean and mode. Karl Pearson expressed this relationship as: Mode = 3 median - 2 mean
• Example Given median = 20. 6, mode = 26 Find mean. • Solution:
Thanks