Measurement of Disease and Health Content Agestandardized rates


 is")


 is a form of health expectancy that")


 �In")

 – calculated from the number of")
, where the number of incident cases")


 % DALYs per 100, 000 population 100.")


- Slides: 54
Measurement of Disease and Health
Content �Age-standardized rates �Life expectancy �Healthy life expectancy �Health indicators �Disability adjusted life years �Global burden of diseases
Age-standardized rates �The age-standardization of rates eliminates the influence of different age distributions on the morbidity or mortality rates being compared.
Age-standardized rates �High-income countries have a much greater proportion of older people in their populations than low- and middle-income countries— the older people have higher rates of cardiovascular disease compared with younger people.
Age-standardized rates �An age-standardized death rate (also referred to as an age-adjusted rate) is a summary measure of the death rate that a population would have if it had a standard age structure. �The standardization of rates can be done either directly or indirectly. �Age-standardized rates enable comparisons to be made between populations that have different age structures.
Age-standardized rates �Standardization can also be done for variables other than age. �This is necessary when comparing two or more populations that have different basic characteristics that independently influence the risk of death (such as age, race, socioeconomic status, etc. ).
Age-standardized rates �Standardized rates are used, whenever relevant, for morbidity as well as mortality. �The choice of a standard population is arbitrary, but can be problematic when comparing rates of low-income and highincome countries.
Age-standardized rates � The standardization of rates can be done either directly or indirectly. �In direct age-adjustment, a common agestructured population is used as standard. �This population may actually exist (e. g. , United States population, 1999) �or may be fictitious (e. g. , two populations may be combined to create a standard). �In indirect age-adjustment, a common set of agespecific rates is applied to the populations whose rates are to be standardized � https: //www. ncbi. nlm. nih. gov/pmc/articles/PMC 3406211/#: ~: text=In%20 direct%20 age%2 Dadjustment%2 C%20 a, pop ulation%20 is%20 used%20 as%20 standard. &text=In%20 indirect%20 age%2 Dadjustment%2 C%20 a, (SMR)%20(5).
Age-standardized rates �Frequently used standard populations include: �the Segi world population �the European standard population based on the Swedish population �the WHO world standard population, which is based on world overall average projected populations 2000– 2025.
Age-standardized rates � All these death rates are influenced by the quality of the original data on the causes of death.
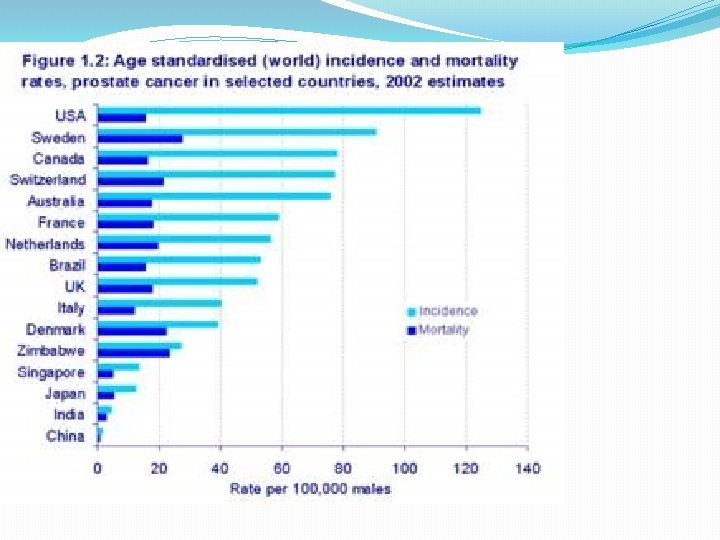
Age-standardized rates
Life expectancy �Life expectancy is a summary measure of the health status of a population. �It is defined as the average number of years an individual of a given age is expected to live if current mortality rates continue.
Life expectancy �Life expectancy at birth is the average number of years that would be lived by babies born in a given time period if mortality levels at each age remain constant. �Similarly, life expectancy at age 65 is the average number of remaining years of life that a man or woman aged 65 will have if mortality levels at each age over 65 remain constant.
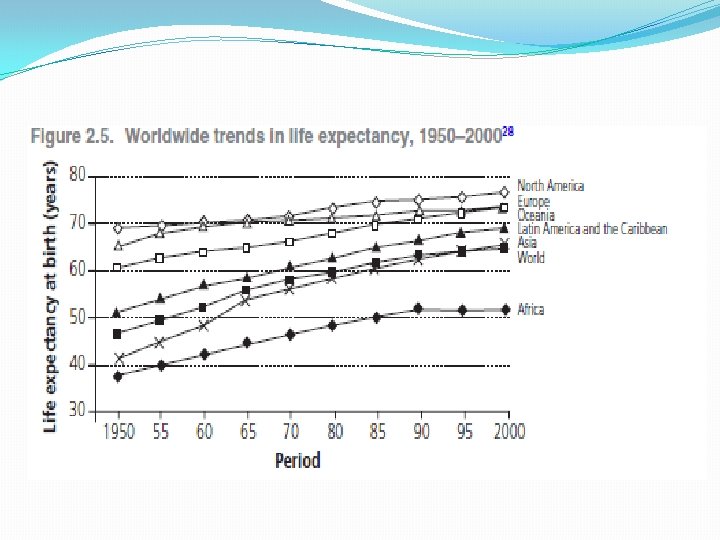
Life expectancy �For the world as a whole, life expectancy at birth has increased from 46. 5 years during the period 1950– 1955 to 65. 0 years during the period 1995– 2000 (see Figure 2. 5). �It is not always easy to interpret the reasons for the differences in life expectancy between countries; different patterns may emerge according to the measures that are used.
Life expectancy �Reversals in life expectancy have occurred in some sub-Saharan countries largely due to AIDS. �Similar reversals in life expectancy have also occurred in middle-aged men in the former Soviet Union, where almost 1 in 2 men die between the ages of 15 and 60 years, largely due to changes in the use of alcohol and tobacco. !!!!!! (Break of Soviet Union)
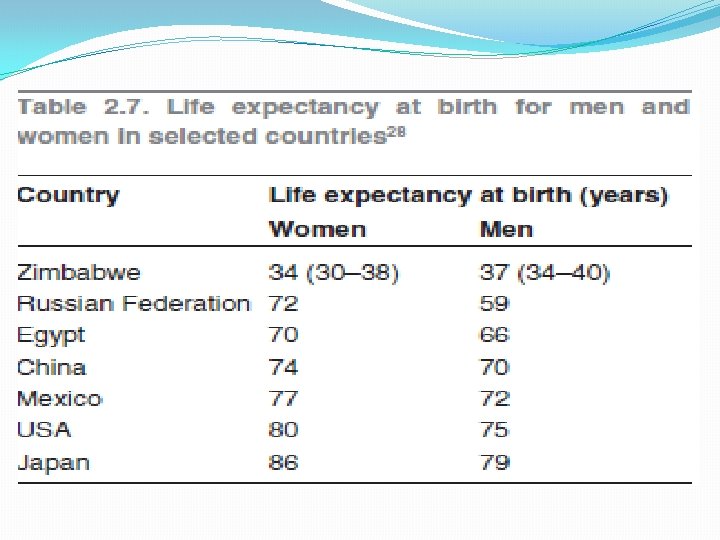
Life expectancy �Life expectancy at birth, as an overall measure of health status, attaches greater importance to deaths in infancy than to deaths later in life. �The following data show the large variations in life expectancies between countries. �For example, a girl born in Japan in 2004 can expect to live 86 years, whereas a girl born in Zimbabwe at the same time will live between 30 and 38 years. �In almost all countries, women live longer than men.
tin Am n rd a 70 Jo or ld 68, 7 W ng pi D EC el o O ric a ia As Af h years D ev n ut So an be rib Ca 75, 2 ha ra Sa th e sia l. A ra nt Ce c ifi Pa c 72, 6 b- an d d an e th es 74, 2 Su a er ic e an d at St 70, 8 La ro p ia As Ar ab 90 80 70 60 50 40 30 20 10 0 Eu st Ea Life expectancy at birth 2015 Both Sexes (UNDP) 80. 3 71. 6 74. 2 58. 9
tin Am O n 71, 9 rd a 82. 9 Jo or ld 70, 2 W ng pi D EC ric a ia As Af h el o D ev n ut So an be rib Ca 78, 4 ha ra Sa th e sia l. A ra nt Ce c ifi Pa c 76, 3 b- an d d an e th es 76, 2 Su a er ic e an d at St 72, 8 La ro p ia As Ar ab 90 80 70 60 50 40 30 20 10 0 Eu st Ea Life expectancy at birth 2015 Females (UNDP) years 73. 8 75. 9 60. 2
tin Am O n rd a 68, 2 Jo 67, 4 or ld 77. 7 W ng pi D EC ric a ia As Af h el o D ev n ut So an be rib Ca 72 ha ra Sa th e sia l. A ra nt Ce c ifi Pa c 68, 7 b- an d d an e th es 72, 3 Su a er ic e an d at St 69, 1 La ro p ia As Ar ab 90 80 70 60 50 40 30 20 10 0 Eu st Ea Life expectancy at birth 2015 Males (UNDP) years 69. 6 72. 6 57. 6
Healthy life expectancy �Healthy life expectancy (HALE) is a form of health expectancy that applies disability weights to health states to compute the equivalent number of years of life expected to be lived in full health. � http: //www. who. int/gho/mortality_burden_disease/life_tables/hale_text/en /
Healthy life expectancy �The healthy life expectancy measure adds a ‘quality of life’ dimension to estimates of life expectancy by dividing it into time spent in different states of health.
Healthy life expectancy �Health status estimates are based on the following survey question; ‘How is your health in general; would you say it was… very good, fair, bad, or very bad’. If a respondent answered ‘very good’ or ‘good’ they were classified as having ‘good’ health. Those who answered ‘fair’, ‘bad’, or ‘very bad’ were classified as having ‘not good’ health and equate to those in ’poor’ health.
Healthy life expectancy �The average number of years that an individual is expected to live in a state of self-assessed good or very good health, based on current mortality rates and prevalence of good or very good health
Healthy life expectancy �The average number of years lived in poor health : the difference between life expectancy and healthy life expectancy �Proportion of life spent in poor health : number of years in poor health as a percentage of life expectancy
Healthy life expectancy �Healthy life expectancy at birth is an estimate of the average number of years babies born this year would live in a state of ‘good’ general health if mortality levels at each age, and the level of good health at each age, remain constant in the future. �Similarly, healthy life expectancy at age 65 is the average number of remaining years a man or woman aged 65 will live in ‘good general health’ if mortality levels and the level of good health at each age beyond 65 remain constant in the future. � https: //www. gov. uk/government/publications/health-profile-forengland/chapter-1 -life-expectancy-and-healthy-life-expectancy#definitions
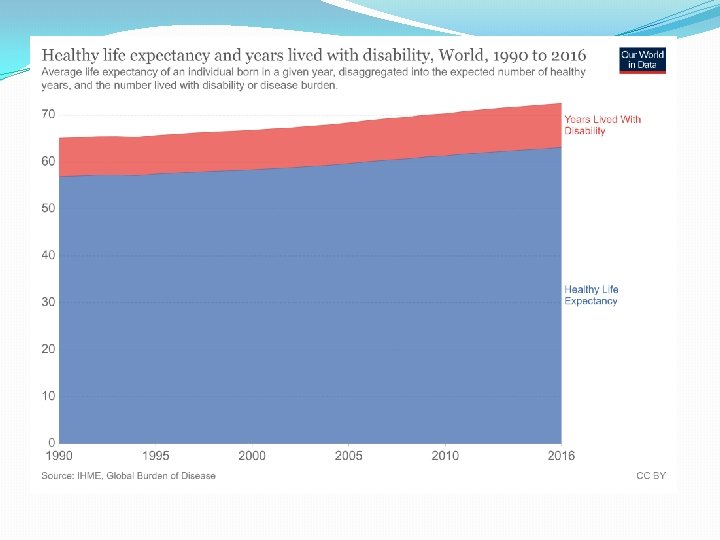
Healthy life expectancy �Overall, global HALE at birth in 2013 for males and females combined was 62 years, 7 years lower than total life expectancy at birth. �In other words, poor health resulted in a loss of nearly 7 years of healthy life, on average globally. �Global HALE at birth for females was only 4 years greater than that for males. In comparison, female life expectancy at birth was almost 5 years higher than that for males. � http: //www. who. int/gho/mortality_burden_disease/life_tables/hale_text/ en/
Healthy life expectancy �HALE at birth ranged from a low of 49 years for African males to 70 years for females in the WHO Western Pacific Region. �The equivalent “lost” healthy years (LHE = total life expectancy minus HALE) ranged from 15% of total life expectancy at birth in the WHO Eastern Mediterranean Region to 10% the WHO Western Pacific Region. � http: //www. who. int/gho/mortality_burden_disease/life_tables/hale_text/en/
Healthy life expectancy �Method of estimation �The equivalent lost healthy year fractions required for the HALE calculation are estimated as the all-cause years lost due to disability (YLD) rate per capita, adjusted for independent comorbidity, by age, sex and country.
Healthy Life expectancy at birth both sexes 80 67, 3 64, 6 70 60 50 52, 3 60, 6 55, 5 64, 1 68 65 68, 7 60, 1 56, 8 58, 5 63, 1 43, 9 40 30 20 10 0 Africa Americas South-East Asia 2000 Europe 2015 Eastern Western Pacific Mediterranean Global
Healthy Life expectancy at birth both sexes 80 70 64, 1 60 50 68 65 56, 8 52, 3 68, 7 60, 1 58, 5 63, 1 62, 9 65 43, 9 40 30 20 10 0 Africa Europe Eastern Mediterranean 2000 Western Pacific 2015 Global Jordan
Healthy Life expectancy at birth males 80 70 65, 4 62, 4 60 50 51, 2 61 59, 6 54, 9 65, 6 56, 1 59, 4 63, 5 67, 3 57 61, 6 42, 9 40 30 20 10 0 Africa Americas South-East Asia 2000 Europe 2015 Eastern Western Pacific Mediterranean Global
Healthy Life expectancy at birth males 80 70 61 60 50 65, 6 56, 1 59, 4 63, 5 67, 3 57 61, 6 62, 2 64, 3 51, 2 42, 9 40 30 20 10 0 Africa Europe Eastern Mediterranean 2000 Western Pacific 2015 Global jordan
Healthy Life expectancy at birth females 80 70 60 50 70, 5 67, 3 69, 2 66, 8 61, 6 56, 2 53, 5 70, 1 66, 5 60, 8 57, 5 64, 6 60, 1 44, 9 40 30 20 10 0 Africa Americas South-East Asia 2000 Europe 2015 Eastern Western Pacific Mediterranean Global
Healthy Life expectancy at birth females 80 67, 3 70 60 50 70, 5 66, 5 57, 5 53, 5 70, 1 60, 8 60, 1 64, 6 63, 8 65, 9 44, 9 40 30 20 10 0 Africa Europe Eastern Mediterranean 2000 Western Pacific 2015 Global jordan
Health indicators �A health indicator is a variable – that can be measured directly to reflect the state of health of people within a community. �WHO presents the most recent data for 50 health indicators each year e. g MMR, child mortality � https: //apps. who. int/iris/bitstream/handle/10665/259951/WHO-HIS-IER-GPM 2018. 1 -eng. pdf; jsessionid=C 7 EDD 2803 C 8206 DED 5 DE 4 D 3 D 088297 BA? sequence=1
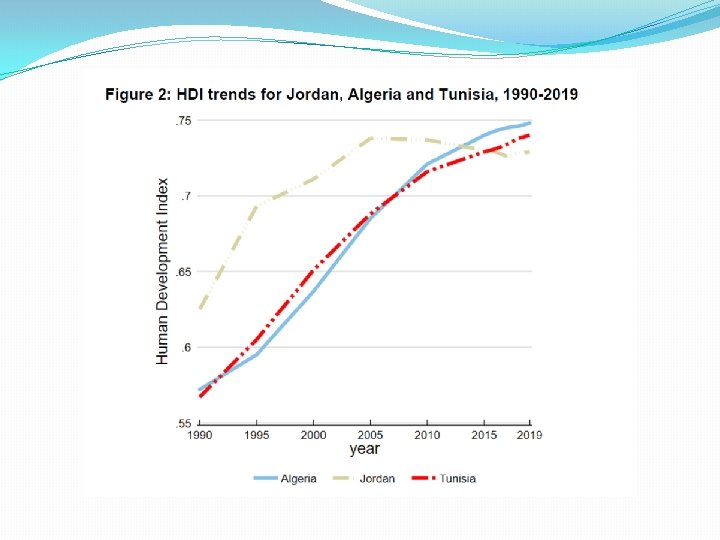
Health indicators �Health indicators can also be used as components in the calculation of a broader social development index. �The best example is the Human Development Index, which ranks countries each year according to a combination of the level of economic development (income), literacy(education), and Health (life expectancy).
Health indicators �Human development classification �HDI was classified according to the quartiles of distributions of the component indicators. �Four categories: � 0. 550 for low human development, � 0. 550– 0. 699 for medium human development, � 0. 700– 0. 799 for high human development and � 0. 800 or greater for very high human development.
Health indicators �Jordan ranked among High Human development �in 2016 ( rank 86) �In 2018 Human Development Index: 0. 735 �Rank: 95 � 2019? ? ? (102) �http: //hdr. undp. org/en/countries/profiles/JOR � http: //hdr. undp. org/sites/all/themes/hdr_theme/country-notes/JOR. pdf
Disability-adjusted life years �The Global Burden of Disease project combines the impact of premature mortality with that of disability. �It captures the population impact of important fatal and non-fatal disabling conditions through a single measure. �The major measure used is disability-adjusted life years (DALYs) which combines: � years of lost life (YLL) � years lost to disability (YLD)
Disability-adjusted life years �years of lost life (YLL) – calculated from the number of deaths at each age multiplied by a global standard life expectancy for the age at which death occurs
Disability-adjusted life years �years lost to disability (YLD), where the number of incident cases due to injury and illness is multiplied by �the average duration of the disease and �a weighting factor reflecting the severity of the disease on a scale from 0 (perfect health) to 1 (dead).
Disability-adjusted life years �The normative reference population has a life expectancy at birth of 82. 5 years for females and 80. 0 years for males. �Time-discounting and non-uniform age weights, which give less weight to years lived at young and older ages, are used in calculating standard DALYs. (revised)
Disability-adjusted life years �One DALY is one lost year of “healthy” life and the measured disease burden is the gap between a population’s current health status and that of an ideal situation where everyone lives into old age, free of disability.
Disability-adjusted life years �DALYs were designed to guide World Bank investment policies for health and to inform global priority setting for health research and international health programs. (compare cost of intervention) �Analysis of DALYs due to a variety of causes and risk factors has given new perspectives on the relative importance of different areas of disease prevention.
Rank Cause Global 2015 DALYs (000 s) % DALYs per 100, 000 population 100. 0 36331 192, 056 7. 2 2615 142, 384 5. 3 1939 139, 874 5. 2 1905 102, 297 3. 8 1393 84, 928 3. 2 1156 76, 020 2. 8 1035 72, 815 2. 7 991 70, 667 2. 6 962 67, 266 2. 5 916 64, 825 2. 4 883 62, 759 2. 4 855 56, 037 2. 1 763 2, 668, 296 0 All Causes 1 Ischaemic heart disease 2 Lower respiratory infections 3 Stroke 4 Preterm birth complications 5 Diarrhoeal diseases 6 Road injury 7 Chronic obstructive pulmonary disease 8 Diabetes mellitus 9 Birth asphyxia and birth trauma 10 Congenital anomalies 11 HIV/AIDS
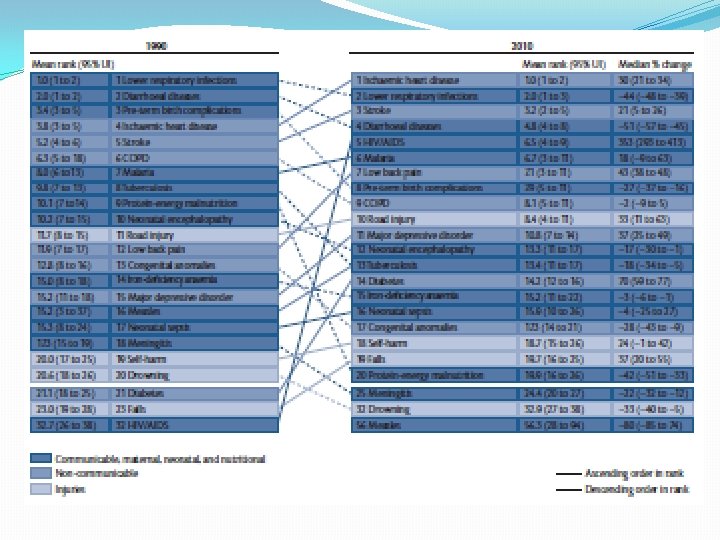
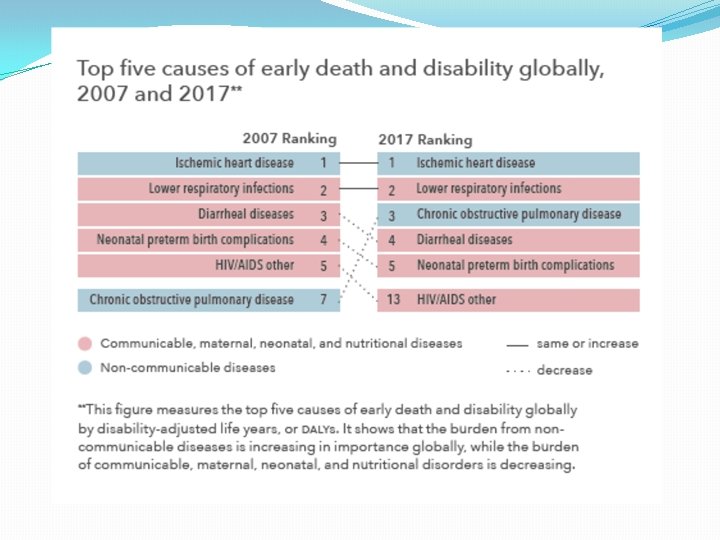
Global burden of disease Project Main findings �The average person in the world today has a much improved chance of living to older age in most countries, but a much higher risk of spending a large portion of life disabled. �The causes of death have also changed among both men and women, a shift from communicable, maternal, neonatal, and nutritional disorders to non-communicable Diseases and injuries �The emergence of chronic non-communicable diseases (NCDs) is prominent in the GBD study, but a “dual burden” seems apparent in numerous countries where infections are still prevalent, especially HIV and TB, while NCD rates rise.
Global burden of disease Project �The prominent risk factors are nevertheless related to NCDs. Hypertension is now the leading risk factor for death in the world, followed by smoking, then alcohol use. �Sociodemographic change is a leading driver of changes in health–except for children, where public health has also made a big difference � https: //epianalysis. wordpress. com/2012/12/13/gbd 2010/