Measurement of Air Temperature The freezing point of


. a). c). Daily cycles of insolation, net")

 are composed of asphalt, concrete, building stone,")


- Slides: 32
Measurement of Air Temperature The freezing point of water in Fahrenheit scale is 32° F, and the boiling point is 212° F. This represents a range of 180° F. Converting from Fahrenheit to Celsius and the reverse can be done using these formulas: C = 5/9 (F-32) F = 9/5 C+32 Try converting 50°F to Celsius.
Measurement of Air Temperature A comparison of the Celsius and Fahrenheit temperature scales. At sea level, the freezing point of water is at Celsius temperature (C) 0°, while it is 32° on the Fahrenheit (F) scale. Boiling occurs at 100°C, or 212°F.
This white wooden louvered box houses maximum-minimum thermometers and other instruments.
The Daily Cycle of Air Temperature - Seasons The earth rotates on its axis, so consequently incoming solar energy varies during each day. We can compare insolation at each solstice and equinox. What to look for in these graphs: Notice how insolation peaks at the same time but its magnitude varies. Notice how net radiation is positive at noon but may be negative in the early morning or late night. Notice how temperature maxima occur later than noon, due to a time lag effect.
The Daily Cycle of Air Temperature b). a). c). Daily cycles of insolation, net radiation, and air temperature. These three graphs show idealized cycles of insolation, net radiation, and air temperature for a midlatitude station in the interior United States. Insolation (a) is a strong determiner of net radiation (b). Air temperatures (c) respond by generally increasing while net radiation is positive and decreasing when it is negative.
Urban and Rural Surfaces In rural areas, the land surface is normally covered with layer of vegetation. In the process of transpiration water is taken up by plants and moved to the leaves, where it evaporates. Since evaporation cools a surface by removing heat, we would expect the rural surface to be cooler.
Urban and Rural Surfaces Urban surfaces (left) are composed of asphalt, concrete, building stone, and similar materials. Sewers drain away rainwater, keeping urban surfaces dry. Rural surfaces (right) are composed of moist soil, covered largely by vegetation.
Urban Heat Islands Air temperatures in the central region of a city are typically several degrees warmer than those of surrounding suburbs and countryside.
Urban Heat Islands On a summer afternoon, temperatures over an urban area are highest, while temperatures remain lower over surrounding rural land. The lines of equal air temperature delineate a heat island.
Heat Islands
Temperature Structure of the Atmosphere How does air temperature change with altitude? Temperature decreases with increasing altitude. This is referred to as the lapse rate. It is usually described as the drop in temperature in o. C per 1000 m (or o. F per 1000 ft. ) At high elevations we can expect temperatures to be colder than at sea level, as at these elevations the air is less dense and is more distant from the potential warming influence of the surface. Example: mountain tops
Temperature Structure of the Atmosphere A typical environmental temperature lapse-rate curve for a summer day in the midlatitudes. The rate of temperature decrease with elevation, or lapse rate, is shown at the average value of 6. 4°C/1000 m ((3. 5°F/1000 ft). The tropopause separates the troposphere, where temperature decreases with increasing elevation, from the stratosphere, where temperature is constant or slightly increases with elevation.
Temperature Changes With Altitude What to look for: Notice the decrease in temperature as altitude increases Notice the increase in the daily temperature range with altitude (as the air is less dense, there is less water vapor and carbon dioxide to warm the surface at night).
Temperature Changes With Altitude Daily maximum and minimum air temperatures for mountain stations in Peru, lat. 15°S
Temperature and Altitude
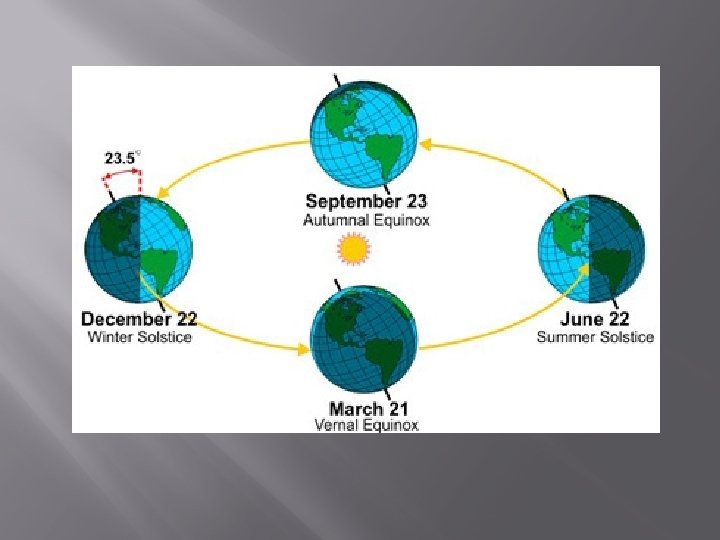
Effect of Latitude � � � Imaginary lines, called lines of latitude, are east-west circles around the globe They divide the Earth into regions according to the sunlight they receive The equator is a latitude line that circles the Earth exactly halfway between the North & South pole.
Effect of Latitude • On/near March 21 & September 23, the sun is directly over the equator making both days and nights exactly the same length • These days are the spring and fall equinoxes.
Effect of Latitude • Two other major lines of latitudes are the Tropic of Cancer and the Tropic of Capricorn
Effect of Latitude • There are times in the year when the sun is directly over both the Tropic of Cancer and Capricorn creating the summer & winter solstices in the Northern Hemisphere • summer solstice June 21 or 22 when over the Tropic of Cancer • winter solstice December 21 or 22 when over the Tropic of Capricorn • During these times, the seasons are opposite in the Southern Hemisphere. Question: What is the significance of June 21 and December 21?
Effect of Latitude • The area between the Equator, the Tropics, and the Arctic/Antarctic circles also have specific names and characteristics. – low latitudes: area between the Tropics of Cancer and Capricorn; receives direct sunlight; almost always hot – high latitudes: area between the Arctic/Antarctic Circles and the North/South poles; a. k. a. “polar zones”; no direct sunlight; always cold – middle latitudes: area between the Tropics and Circles; a. k. a. “temperature zones”; have all seasons: spring, summer, fall, winter
Effect of Latitude
Temperature Inversion When air temperature increases with altitude, an inversion is present. This can develop on clear nights when the surface loses longwave radiation to space. What to look for in this graph: Notice that there is now a bend in the temperature profile. Notice that the temperature at the ground is below zero degrees Celsius. Should water condense and freeze on surfaces, this will lead to frost.
Temperature Inversion A low-level temperature inversion with frost. Instead of temperature decreasing with elevation (dashed line) from, say, 4°C (39°F), the surface temperature is at 1°C (30°F) and temperature increases with elevation (solid line) for several hundred meters (1000 ft. or so) above the ground. Since the surface is below the freezing point, frost can form
How Inversions Form � � � The most common manner in which surface inversions form is through the cooling of the air near the ground at night. Once the sun goes down, the ground loses heat very quickly, and this cools the air that is in contact with the ground. However, since air is a very poor conductor of heat, the air just above the surface remains warm.
Temperature Inversion
Land Water Contrasts Ocean temperatures vary less than land temperatures because water heats more slowly, absorbs energy throughout a surface layer, and can mix and evaporate freely. As a result, temperatures at maritime locations are less variable from day to night and from summer to winter when compared to continental locations.
Land Water Contrasts A recording thermometer made these continuous records of the rise and fall of air temperature over a period of a week in summer at San Francisco, California, and at Yuma, Arizona. The daily cycle is strongly developed at Yuma, a station in the desert. In contrast, the graph for San Francisco, on the Pacific Ocean, shows a very weak daily cycle.
Land Water Contrasts Four differences that illustrate why a land surface heats more rapidly and more intensely than the surface of a deep water body. Locations near the ocean have more uniform air temperatures - cooler in summer and warmer in winter - because of these differences.
Mapping Surface Temperatures The distribution of air temperature is often shown on a map by isotherms lines drawn to connect locations having the same temperature.
Mapping Surface Temperatures Isotherms are used to make temperature maps. Each line connects points having the same temperature. Where temperature changes along one direction, a temperature gradient exists. Where isotherms close in a tight circle, a center exists. This example shows a center of low temperature.
Mean Monthly Air Temperatures for January and July There are six dominant factors controlling surface temperatures: 1. Temperatures decrease from the equator to the poles. 2. Large landmasses located in the subarctic and arctic zones develop centers of extremely low temperatures in winter. 3. Temperatures in equatorial regions change little from January to July. 4. Isotherms make a large north-south shift from January to July over continents in the midlatitude and subarctic zones. 5. Highlands are always colder than surrounding lowlands. 6. Areas of perpetual ice and snow are always intensely cold.