Measure the Following items o The height of


 Number of ice cream cones sold Temperature")
 Number of ice cream cones sold Temperature")


- Slides: 37
Measure the Following items o The height of your table o The width of your table (small side) o The length of a pencil box o The height of your tallest group member
Metric System 10 10, 000 o Universal unit of measurement based on multiples of 10 o Why is universal measurement system important? 100 1, 000, 00
Base unit: defines what you are measuring Liter = volume Gram = mass Meter = distance
Prefixes to know Centi. Deci. Milli. Kilo. Micro. Nano- 100 10 1, 000, 000, 000
100 cm = 1 m 10 dm = 1 m 1000 mm = 1 m 1 km = 1000 m
1 million µm = 1 m 1 billion nm = 1 m 1 dm = 10 cm 1 cm = 10 mm
How would you most accurately measure this line?
Making a Line Graph o Create a data table first o Variables: n Independent/ manipulated variable: what the experimenter changes, manipulates, to determine its effect on another variable n Dependent/ responding variable: “responds” to the change that is made to the independent variable
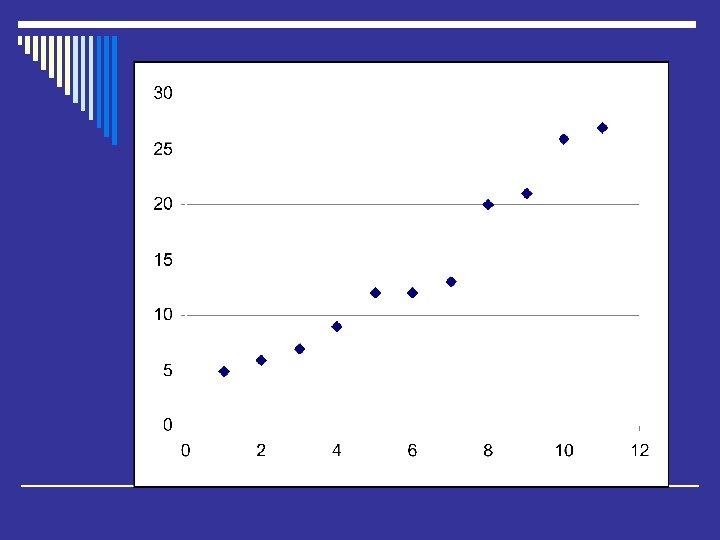
Example experiment If the temperature increases then ice cream sales will also increase because people eat more ice cream when it is hot outside
(Celsius) Number of ice cream cones sold Temperature
(Celsius) Number of ice cream cones sold Temperature
o Interpolation: using the data to estimate a value between the data points. o Extrapolation: making an estimate from outside the range of data o How many ice cream cones would be sold when it is 30°C? o How many ice cream cones would be sold when it is 43°C?
Number of ice cream cones sold How does temperature affect ice cream sales? Temperature (Celsius)
Why?
Why?
Different types of graphs o Line graph: use when there is an independent and dependent variable o Bar graph: use when you are comparing separate categories o Pie graph: use when comparing percentages up to 100%) Nonarthropod invertebrates (11%) Noninsect arthropods (12%) Vertebrates (4%) Insects (73%) (add
Scientific Process
Observations vs. Inferences Observations using your senses to gather information Inferences using prior knowledge to gather further information from your observations
Makeobservations inferences
Make a Hypothesis o Hypothesis: an educated guess as to what will happen and why it will happen o If _______ then ______ because____________
Hypothesis examples If the temperature increases then ice cream sales will also increase because people eat more ice cream when it is hot outside. If you study then you will do better on your Biology test because you will know more of the information. Come up with an example of your own.
Setting up a controlled experiment Review o Independent variable: what the experimenter manipulates o Dependent variable: what responds to the change in the independent variable
Two groups o Control group: the group with no changes that is used for comparison o Experimental group: the group in which one variable is manipulated The groups must be homogeneous (the same) except for one factor. Why? When might an experiment not be possible?
Collect Data Quantitative: numbers Qualitative: description The m&ms are blue and white There are 18 m&ms
Collecting Data How do you count all the red blood cells in the human body? How would you determine the number of salamanders in a region? Scientific sampling: Using a random small population to draw conclusions about a large population
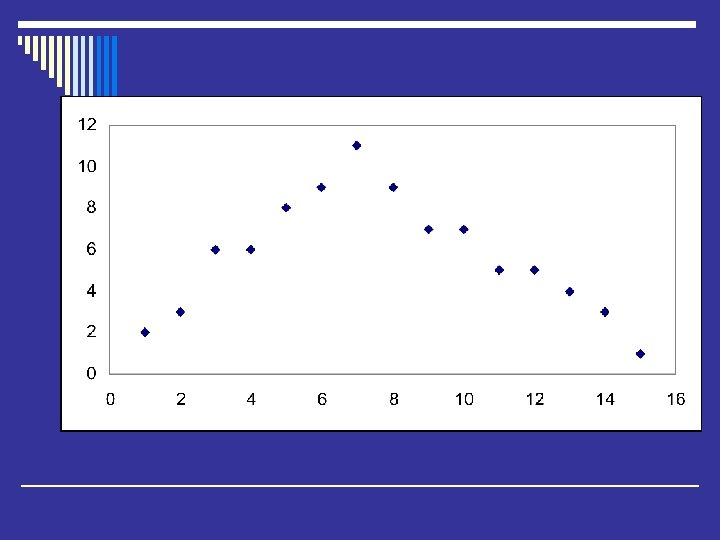
Models and Graphs
Form a Conclusion o Did you support your hypothesis or not? o In science, you never prove!!! o Theory: a well supported conclusion, which is supported by many, many experiments o Who uses the scientific process? Everyone
What is Biology? the study of life
Characteristics of life All living things… o Are made up of at least one cell o Use energy o React to stimuli from the environment
All living things… o Are able to grow, develop, and reproduce o Have a universal genetic code DNA o Have adapatations that allow them to change over time evolution
All living things… o Maintain homeostasis Homeostasis: maintaining a stable internal environment Negative feedback loop Positive feedback loop
Branches of Biology
Branches of Biology