Measure Surface Potential Two Known KPFM Modes FM


 conductive AFM probe")


")


- Slides: 26
Measure Surface Potential: Two Known KPFM Modes FM Provides high resolution and accuracy KPFM measures the work function difference of tip/sample. AM FM Amplitude-Modulation Frequency-Modulation ü Better spatial resolution ü Better accuracy Physical Review B 2005, 71(12) 125424 10/17/2021 Bruker Confidential 1
Adjusting Vdc, until the first harmonic electric force equals to zero
The measured electric force is contributed from tip and the body of the cantilever Which decrease the spacial resolution and accuracy.
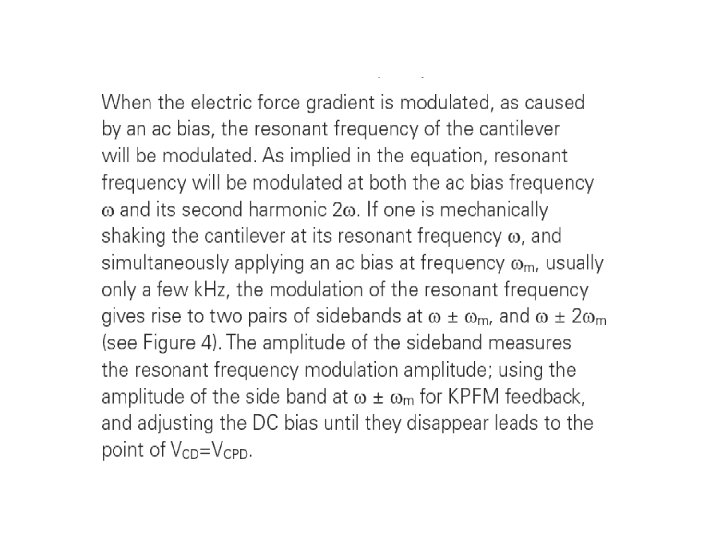
Adjusting Vdc, until the first harmonic electric force Gradient equals to zero
The measured electric force gradient mostly contributed from tip, NOT the body of the cantileve So the spacial resolution and accuracy is much higher than AM-KPFM.
Scaling Topography and Potential Peak. Force KPFM to Take Us Further • But Tapping Mode Requires : • k to be not too small • Q not to be too big Tapping and KPFM scaling in conflict. • Peak Force Tapping Mode Allows Freedom to use: • Smaller k (10 x or more) • Big Q (10 x or more) Peak. Force Tapping and KPFM scaling aligned. 10/17/2021 Bruker Nano Surfaces Division 11
Peak. Force KPFM Retains FM-KPFM’s High Resolution Peak. Force KPFM-AM Peak. Force KPFM 10/17/2021 Bruker Nano Surfaces Division 12
Peak. Force KPFM Offers Simultaneous Mechanical Information LDPE Height 100 nm PS Modulus 10 MPa Potential 150 m. V Deformation 25 nm PS=Poly. Styrene LDPE=Low Density Poly. Ethylene Adhesion 5 n. N 10/17/2021 Bruker Nano Surfaces Division 13
Peakforce FM-KPFM has better spacial resolution and accuracy, but when the features is too small, limitation exists.
PF-KPFM for quantitative characterization of work function “Remove the Residual Additives toward Enhanced Efficiency with Higher Reproducibility in Polymer Solar Cells. ” PF-KPFM surface potential images (1μm scan) Pure polymer • PF-KPFM shows that the methanol wash (Device C) increased the work function difference • This reduced the electron injection barrier, leading to better device performance Ye, L. et al. , 2013. J. Phys. Chem. C, 117(29), pp. 14920– 8 10/17/2021 Bruker Confidential 15
C-AFM Principle of Operation conductive AFM probe DC bias voltage (-12 V to +12 V) (1. 0 p. A – 1. 0 m. A) p. A-Amplifier extra gain + filter to ADC 1 n. A / V gain 1 p. A RMS noise
TUNA Principle of Operation (50 f. A – 100 p. A) conductive AFM probe p. A-Amplifier to ADC thin dielectric film DC bias voltage (-12 V to +12 V) 1 p. A / V gain 50 f. A RMS noise extra gain + filter Closed loop (constant current mode) In development
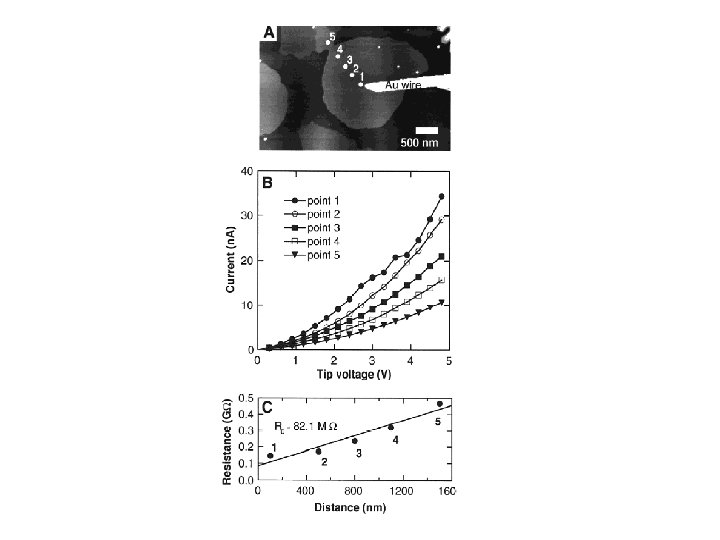
Conducting Probe Atomic Force Microscopy: A Characterization Tool for Molecular Electronics ( C. D. Frisbie, Adv. Mater. 1999 11 261)
Resistance of Grain Boundary
Probing Electrical Transport in Nanomaterials: Conductivity of Individual Carbon Nanotubes Science 272 523(1996)
PF-TUNA extends nanoscale electrical characterization with exclusive Peak. Force Tapping technology • High bandwidth, high gain, yet low noise: The high 20 p. A/V gain setting provides at once full peak current detection with >10 k. Hz bandwidth and most sensitive current imaging with <100 f. A noise in the cycle averaged current. • 6 gain settings from 100 n. A/V to 20 p. A/V access <100 f. A to >100 n. A current range without changing probe holder or amplifier. Benefit: Remain on the same spot on the sample the whole time. • Complementary correlated information from PF QNM: directly correlated nanomechanical and conductivity properties 10/17/2021 22 Bruker Confidential
Peak. Force TUNA • PF-TUNA extends nanoscale electrical characterization with exclusive Peak. Force Tapping technology • Simultaneously collect conductivity, modulus, adhesion, dissipation, and deformation data at each imaging pixel. • PFTUNA is enabled by a new current amplifier design • 6 selectable gain settings • <100 f. A to >100 n. A current range 1) Peak Current C 2) Contact-Averaged Current B<-->D 3) Cycle-Averaged Current (TUNA Current) A<------>E 10/17/2021 23 Bruker Confidential
Peak. Force TUNA Application PP+rubber+CB. Top surface vs. Bulk Top Current, 3 V Adhesion Modulus Height 5 V 1. 06 n. A Bulk Height ~0. 9 GPa ~100 MPa 10/17/2021 1. 19 n. A Current, 3 V Adhesion Modulus 720 p. A 740 p. A 522 p. A 1. 20 n. A ~75 MPa Bruker Confidential 24
Peak. Force TUNA Application Adhesion Height height~3 nm width~15 nm P 3 HT Organic conductive nanowires Peak Current, +3 V bias ~100 p. A small and fragile samples, very challenging to contact mode based conductivity measurements TUNA Current, +3 V bias ~15 p. A Adhesion 10/17/2021 25 Bruker Confidential
PF-TUNA for high-resolution mapping of current on polymer-nanotube composites “Nanoscale investigation of the electrical properties in semiconductor polymer-carbon nanotube hybrid materials. ” Topography Current Carbon nanotube • Topographic imaging can confirm that the CNTs are dispersed and the P 3 HT fibers grow perpendicular to the CNT • High-res PF-TUNA current map indicates that the current is controlled by the spreading resistance beneath the tip • Negligible lateral forces and normal force ~50 p. N make it possible to map current distribution over individual nanofibers Desbief, S. et al. , 2012. Nanoscale, 4(8), pp. 2705– 12. 10/17/2021 Bruker Confidential 26