Mean shift Mean shift or segmentation in general

 Why? To find “chunks” of image that have")


 which uses the kernel")


 for the center")

 kernel")


=Mean shift vector")


 d – segmented result")


- Slides: 56
Mean shift
Mean shift (or segmentation in general) Why? To find “chunks” of image that have meaning possibly objects Because pixels are too small to work with individually and most pixels are like their neighbors To compress the image
Mean shift example
Examples of mean shift segmentation:
Examples of mean shift segmentation:
Mean shift definition • Mean shift is a feature-space analysis technique for locating the maxima of a density function. • Originally presented in 1975 by Fukunaga and Hostetler. • Mean shift is used for various purposes like image processing, computer vision.
Mean shift definition - continue • The basic idea of mean shift: • Given a collection of n points, we want to separate the points into regions by finding the densest regions. • In other words, we want to be able to locate each point to its region. • In images, the points are actually pixels. We use mean shift algorithm to separate the image into regions.
הדגמה Region of interest Center of mass Mean Shift vector 8
הדגמה Region of interest Center of mass Mean Shift vector 9
הדגמה Region of interest Center of mass Mean Shift vector 10
הדגמה Region of interest Center of mass Mean Shift vector 11
הדגמה Region of interest Center of mass Mean Shift vector 12
הדגמה Region of interest Center of mass Mean Shift vector 13
הדגמה Region of interest Center of mass 14
Mean shift – 1 D density example
Mean shift – using density function • We want to represent all discrete points into a dense function so that we can calculate the maxima of the function around each point (and by that, to find the densest area around the point). • Since we want to calculate the derivative of the density function (in 1 D points) or the gradient of the function (in 2 D points) we must convert the points into a density function.
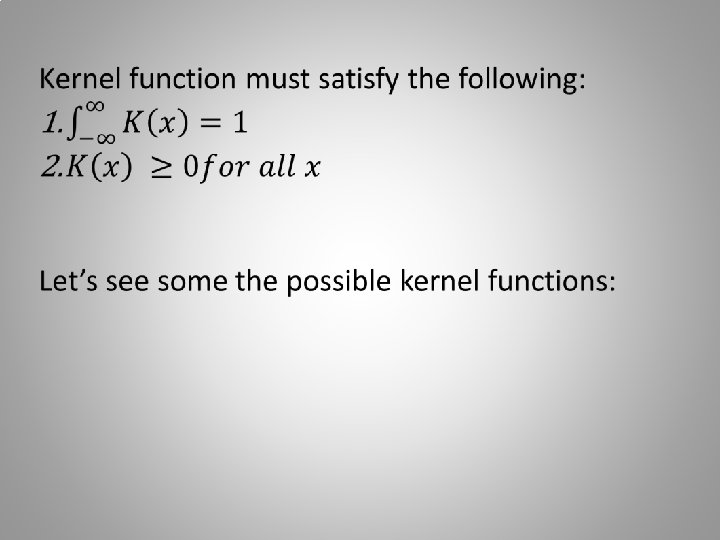
Mean shift – kernel function Let’s define density function p(x) which uses the kernel function K(x). P(x) – x is coordinate point K(x) – x is the distance of a given point.
KERNEL של סוגים o Uniform
KERNEL של סוגים o Epanechnikov
Density function • Source: http: //luthuli. cs. uiuc. edu/~daf/courses/CS-498 -DAF-PS/Segmentation. pdf
Mean shift – 1 D density example uniform kernel
Mean shift – 2 D density example uniform kernel Calculating p(x) for the center of the circle (h=1): There are 18 points in the circle. 12 points outside the circle. 30 points all together. By the kernel function we’ll count 0. 5 18 times, and in the rest we’ll count 0. We get a number close to 0. 5 which is the biggest number that p(x) can get.
Mean shift – 1 D density example Epanechnikov kernel
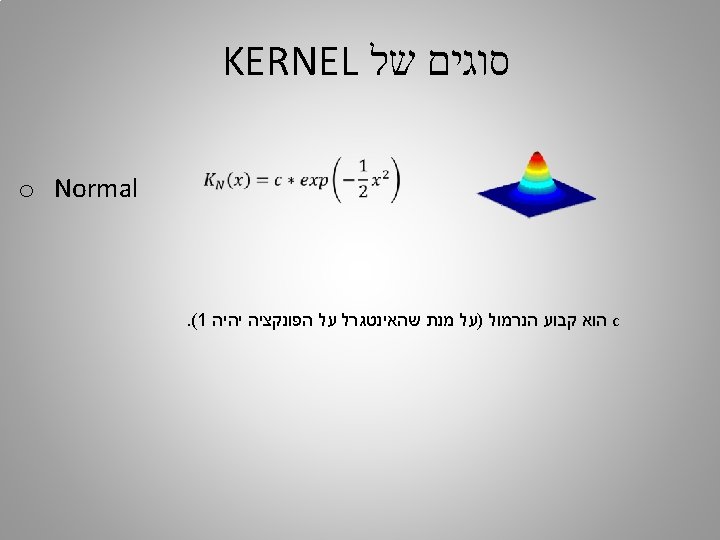
Mean shift – 1 D density example normal (gaussian) kernel
Mean shift – h Which maxima to go?
Depends on h h
Depends on h h
H window The h window should be big enough to find significant mode (we don’t want to locate the red point into the gray point. Too small maxima). And the h window should not be too big (so that all the points will converge into both peaks and not only one of them).
Finding a maximum • Source: http: //luthuli. cs. uiuc. edu/~daf/courses/CS-498 -DAF-PS/Segmentation. pdf
Finding a maximum - continue • Source: http: //luthuli. cs. uiuc. edu/~daf/courses/CS-498 -DAF-PS/Segmentation. pdf
Finding a maximum - continue • Source: http: //luthuli. cs. uiuc. edu/~daf/courses/CS-498 -DAF-PS/Segmentation. pdf
Finding a maximum - continue • Source: http: //luthuli. cs. uiuc. edu/~daf/courses/CS-498 -DAF-PS/Segmentation. pdf
m(x)=Mean shift vector
Finding a maximum - continue Translating the kernel window by the mean shift vector is guaranteed to converge at a nearby point where the density function has zero gradient. Basin of attraction – the set of all locations that converge to the same mode define the basin of attraction. Source: http: //luthuli. cs. uiuc. edu/~daf/courses/CS-498 -DAF-PS/Segmentation. pdf
We want to move the green point to the center of the densest area around it. We’ll call the function above. 37
Calling again the function. The point getting closer to the densest area. 38
Calling the function again. The point is at the densest area. Or closer than a threshold defined ahead. 39
H window – 2 D The window h should also be big enough to prevent saddle point (in 2 D points).
Finally images!!
Mean shift on images Smoothing through replacing the pixel in the center of a window by the weighted average of the pixels in the window indiscriminately blurs the image, removing not only the noise but also salient information. Using mean shift filtering reduces the amount of smoothing near abrupt changes.
Mean shift on images If p is the color dimensions of an image (1 if the image is grayscale and 3 in case of color image). d=p+2 is the image dimensions (2 for x, y pixels locations). In images each pixel has d-dimensional vector of information.
Mean shift in images - continue •
Mean shift filtering algorithm •
Mean shift filtering - example
Mean shift - images Mean shift based filtering for gray-level data. a – input b – mean shift paths for the pixels in the white rectangle marked in the picture. The black dots are the points of convergence.
Mean shift images - continue
Mean shift image segmentation •
Mean shift image segmentation – example (cameraman again) d – segmented result
Image segmentation example
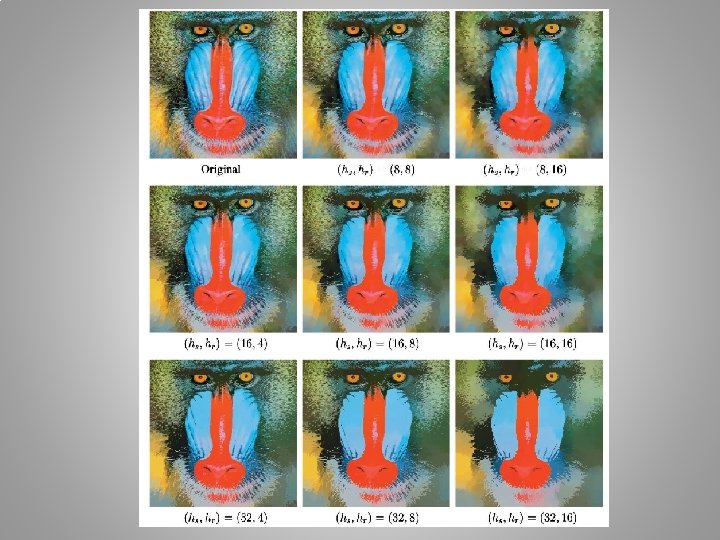
Mean shift segmentation - example
sources • Segmenting images and mean shift by D. A Forsyth. • Introduction To Mean Shift Algorithm (https: //saravananthirumuruganathan. wordpress. com/2010/04/01/introduction-to-mean-shiftalgorithm/) by Saravanan Thirumuruganathan. • Mean Shift: A Robust Approach Toward Feature Space Analysis by Dorin Comaniciu, Member, IEEE, and Peter Meer, Senior Member, IEEE
THE END!!