
Mean Shift A Robust Approach Toward Feature Space
Mean Shift : A Robust Approach Toward Feature Space Analysis - Bayesian Background Modeling 2009. 10. 9 lbg@dongseo. ac. kr 2020 -11 -04 1
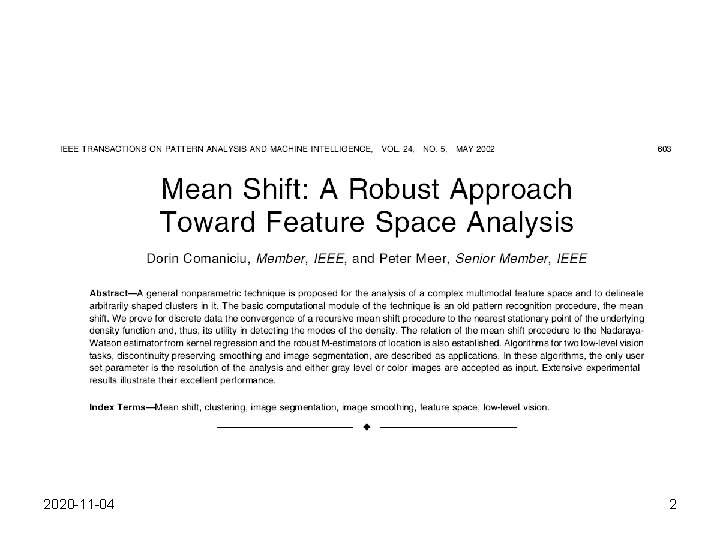
2020 -11 -04 2

Mean Shift Theory and Applications Yaron Ukrainitz & Bernard Sarel 2020 -11 -04 3
Agenda • Mean Shift Theory • What is Mean Shift ? • Density Estimation Methods • Nonparametric Kernel Density Estimation • Deriving the Mean Shift • Mean shift properties • Applications • Clustering • Discontinuity Preserving Smoothing • Object Contour Detection • Segmentation • Object Tracking 2020 -11 -04 4
Mean Shift Theory 2020 -11 -04 5
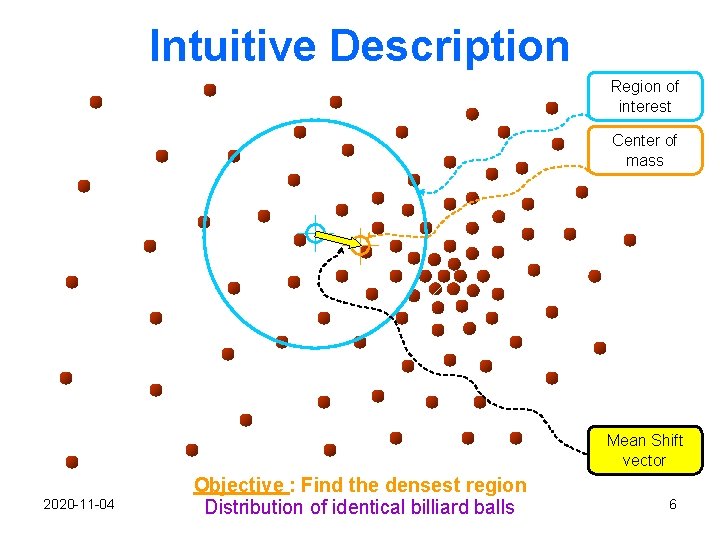
Intuitive Description Region of interest Center of mass Mean Shift vector 2020 -11 -04 Objective : Find the densest region Distribution of identical billiard balls 6
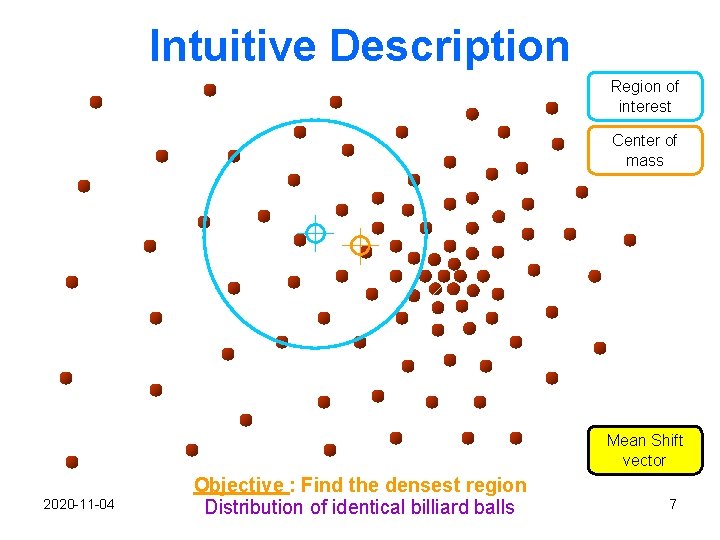
Intuitive Description Region of interest Center of mass Mean Shift vector 2020 -11 -04 Objective : Find the densest region Distribution of identical billiard balls 7
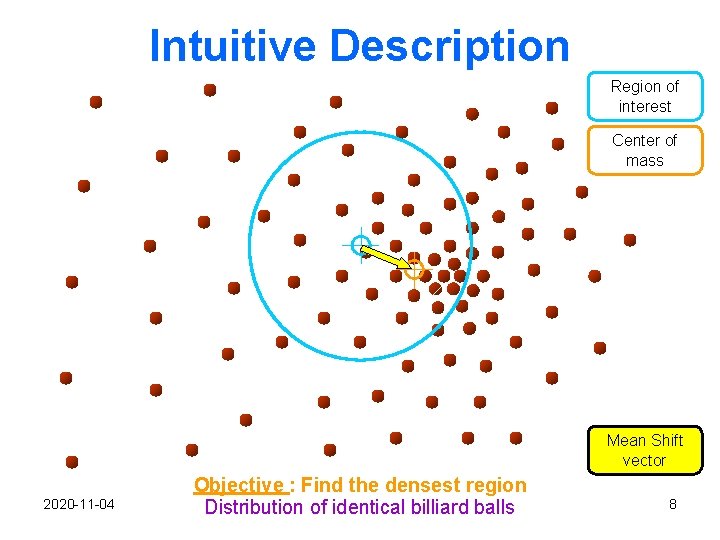
Intuitive Description Region of interest Center of mass Mean Shift vector 2020 -11 -04 Objective : Find the densest region Distribution of identical billiard balls 8
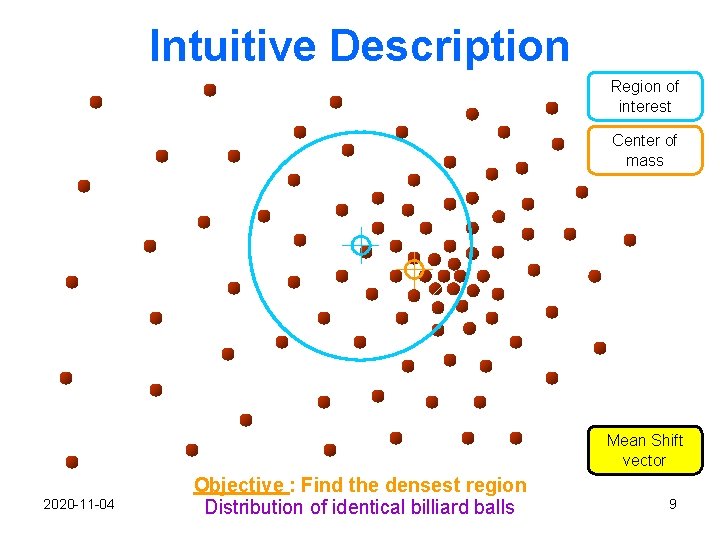
Intuitive Description Region of interest Center of mass Mean Shift vector 2020 -11 -04 Objective : Find the densest region Distribution of identical billiard balls 9
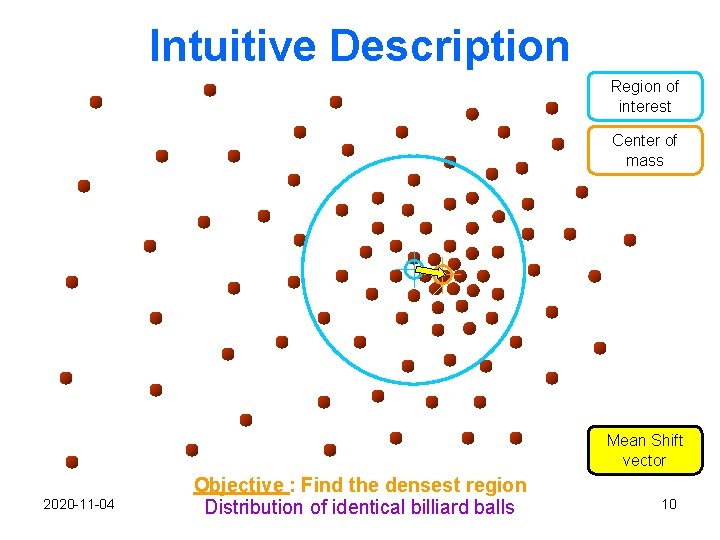
Intuitive Description Region of interest Center of mass Mean Shift vector 2020 -11 -04 Objective : Find the densest region Distribution of identical billiard balls 10
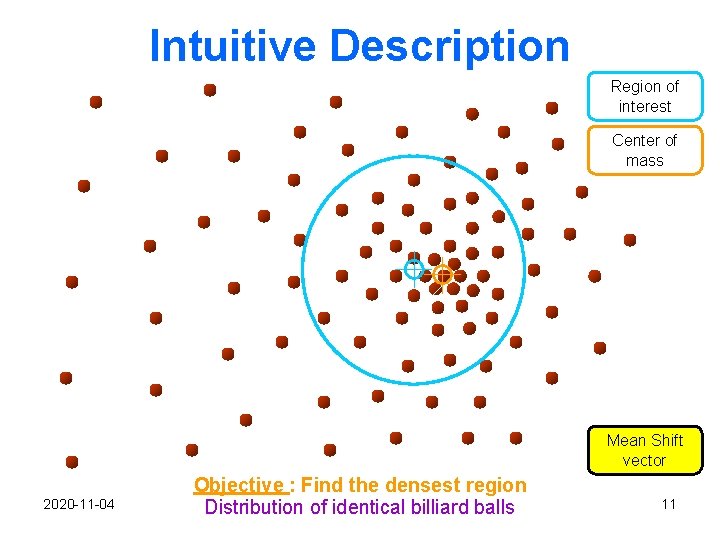
Intuitive Description Region of interest Center of mass Mean Shift vector 2020 -11 -04 Objective : Find the densest region Distribution of identical billiard balls 11
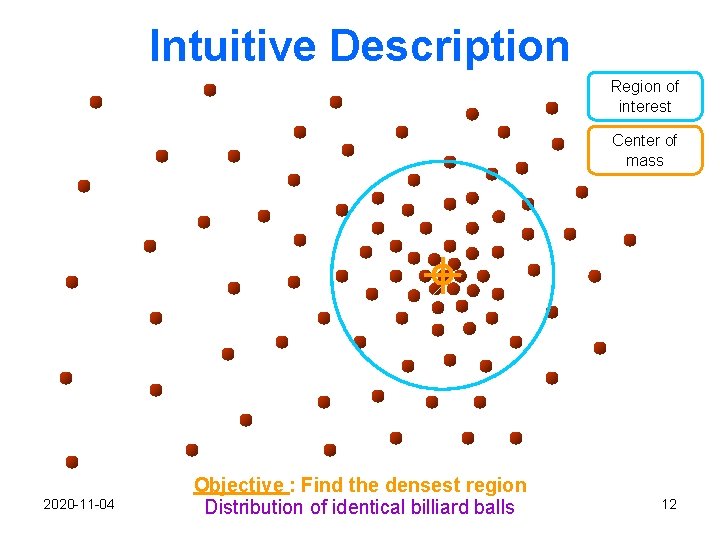
Intuitive Description Region of interest Center of mass 2020 -11 -04 Objective : Find the densest region Distribution of identical billiard balls 12
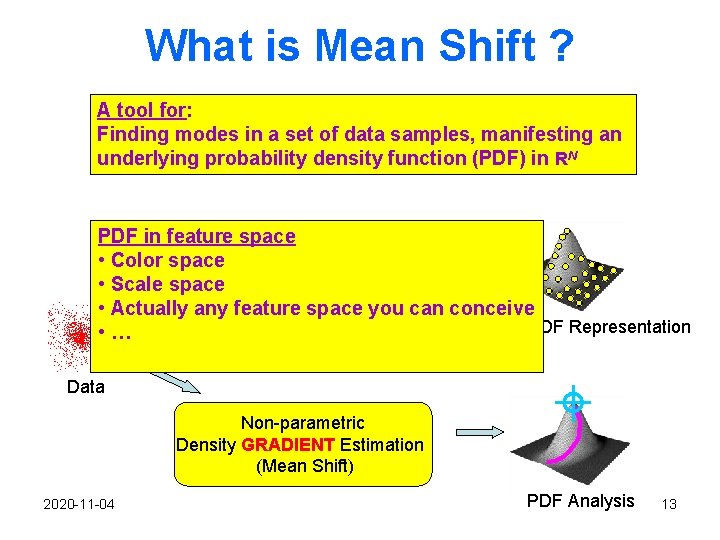
What is Mean Shift ? A tool for: Finding modes in a set of data samples, manifesting an underlying probability density function (PDF) in RN PDF in feature space • Color space Non-parametric • Scale space. Density Estimation • Actually any feature space you can conceive Discrete PDF Representation • … Data Non-parametric Density GRADIENT Estimation (Mean Shift) 2020 -11 -04 PDF Analysis 13
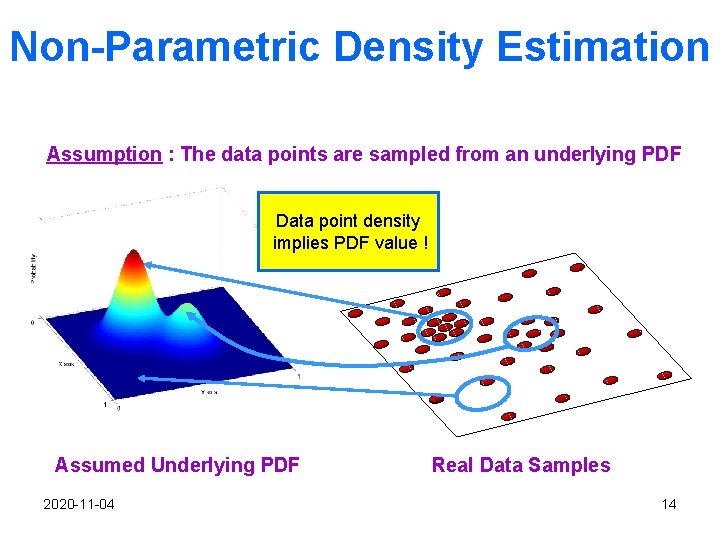
Non-Parametric Density Estimation Assumption : The data points are sampled from an underlying PDF Data point density implies PDF value ! Assumed Underlying PDF 2020 -11 -04 Real Data Samples 14
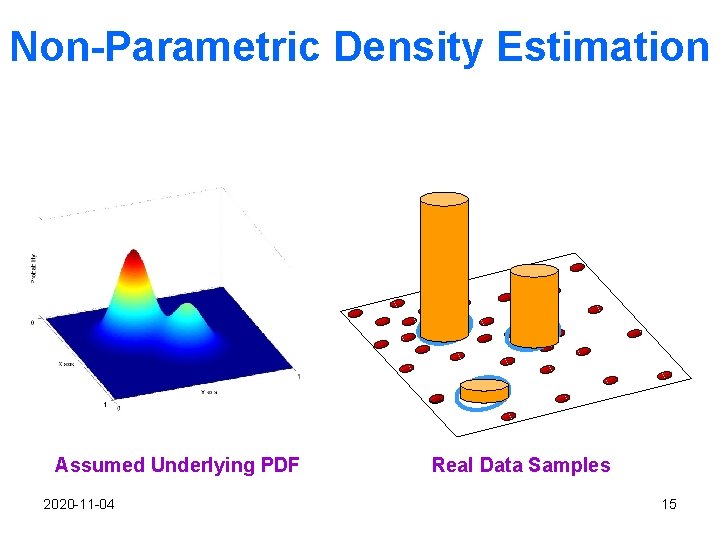
Non-Parametric Density Estimation Assumed Underlying PDF 2020 -11 -04 Real Data Samples 15
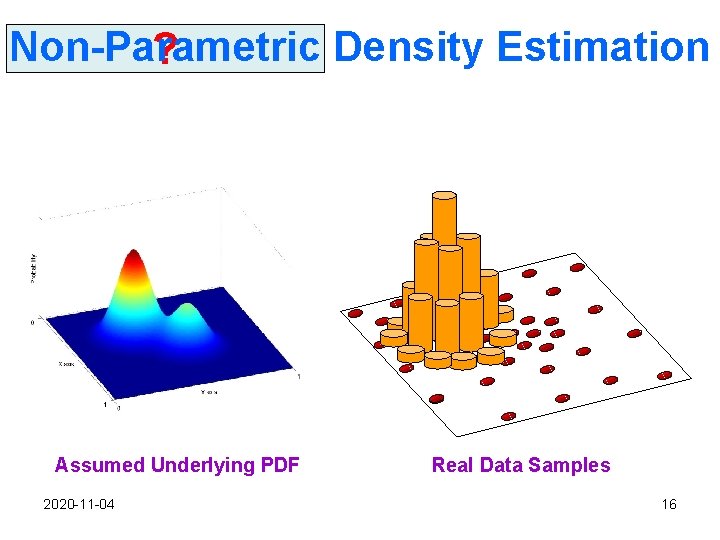
Non-Parametric Density Estimation ? Assumed Underlying PDF 2020 -11 -04 Real Data Samples 16
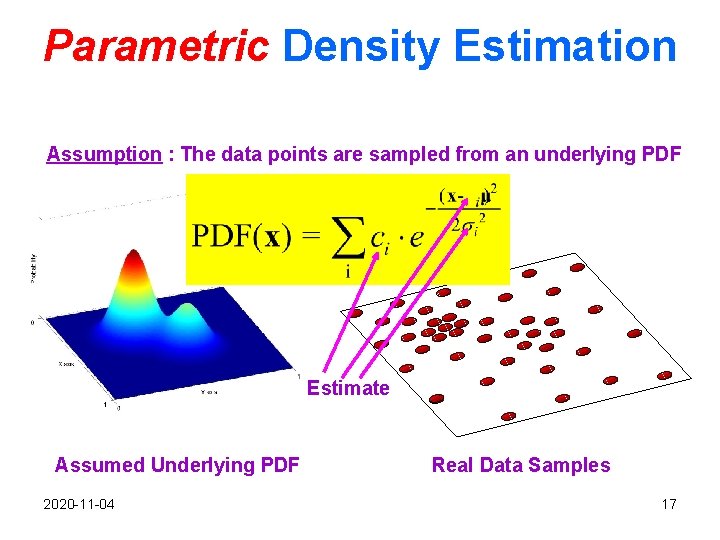
Parametric Density Estimation Assumption : The data points are sampled from an underlying PDF Estimate Assumed Underlying PDF 2020 -11 -04 Real Data Samples 17
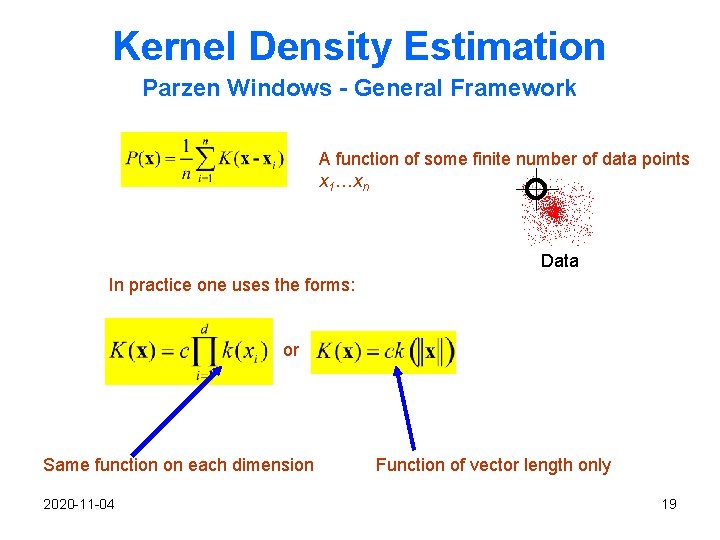
Kernel Density Estimation Parzen Windows - General Framework A function of some finite number of data points x 1…xn Data In practice one uses the forms: or Same function on each dimension 2020 -11 -04 Function of vector length only 19
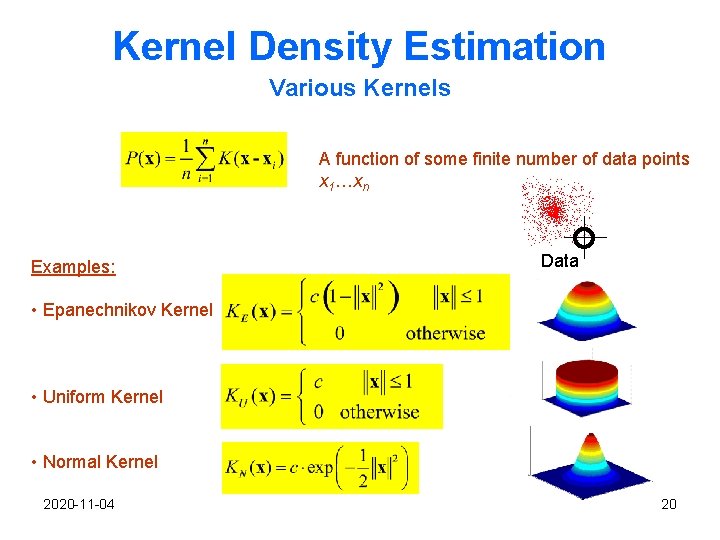
Kernel Density Estimation Various Kernels A function of some finite number of data points x 1…xn Examples: Data • Epanechnikov Kernel • Uniform Kernel • Normal Kernel 2020 -11 -04 20
Nonparametric Kernel Density Estimation 2020 -11 -04 21
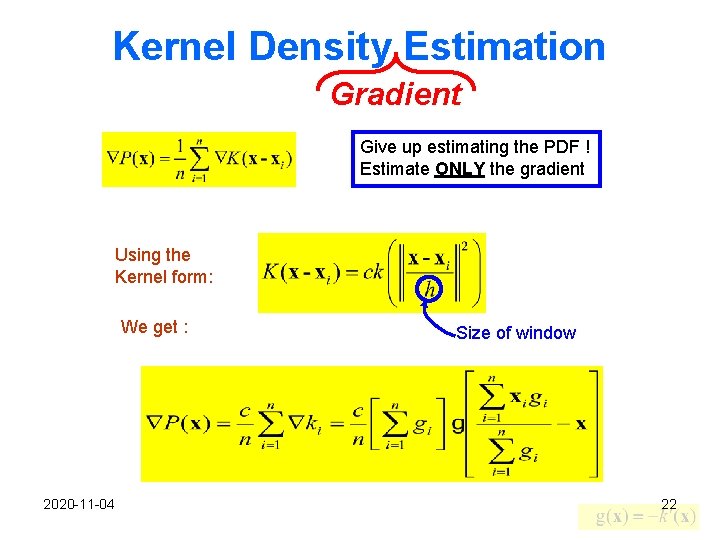
Kernel Density Estimation Gradient Give up estimating the PDF ! Estimate ONLY the gradient Using the Kernel form: We get : 2020 -11 -04 Size of window 22
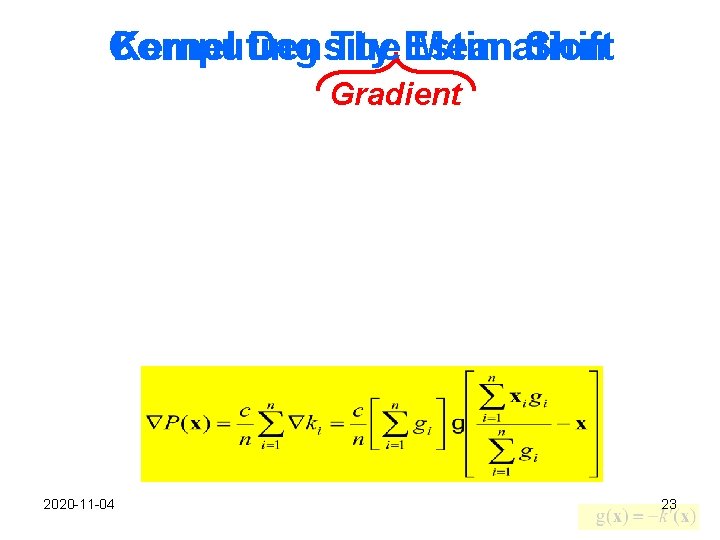
Computing Kernel Density The Estimation Mean Shift Gradient 2020 -11 -04 23
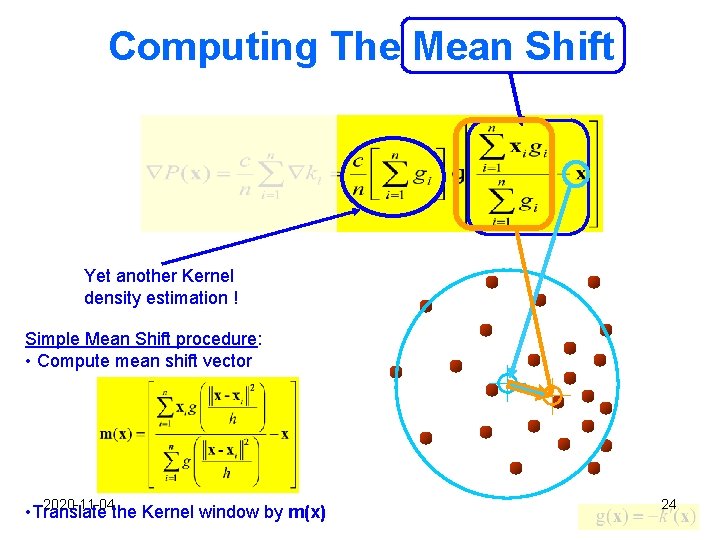
Computing The Mean Shift Yet another Kernel density estimation ! Simple Mean Shift procedure: • Compute mean shift vector 2020 -11 -04 • Translate the Kernel window by m(x) 24
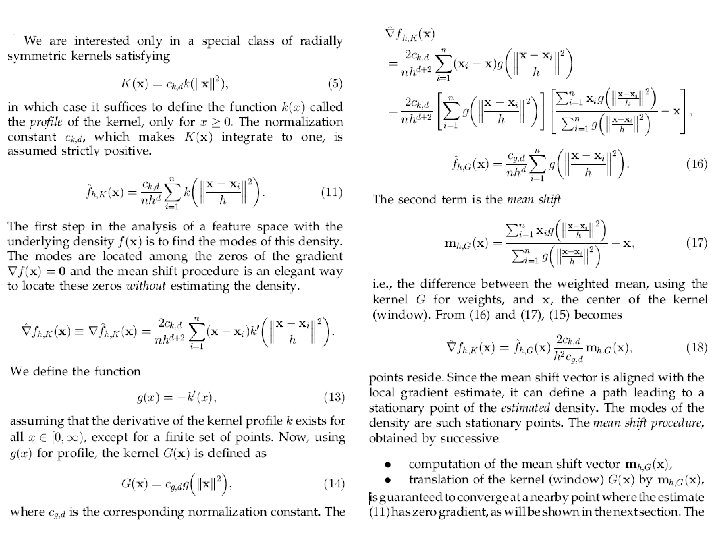
2020 -11 -04 25
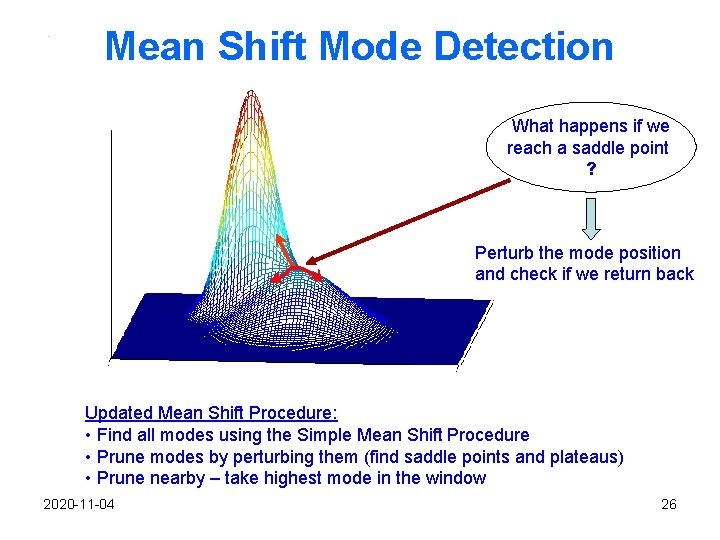
Mean Shift Mode Detection What happens if we reach a saddle point ? Perturb the mode position and check if we return back Updated Mean Shift Procedure: • Find all modes using the Simple Mean Shift Procedure • Prune modes by perturbing them (find saddle points and plateaus) • Prune nearby – take highest mode in the window 2020 -11 -04 26
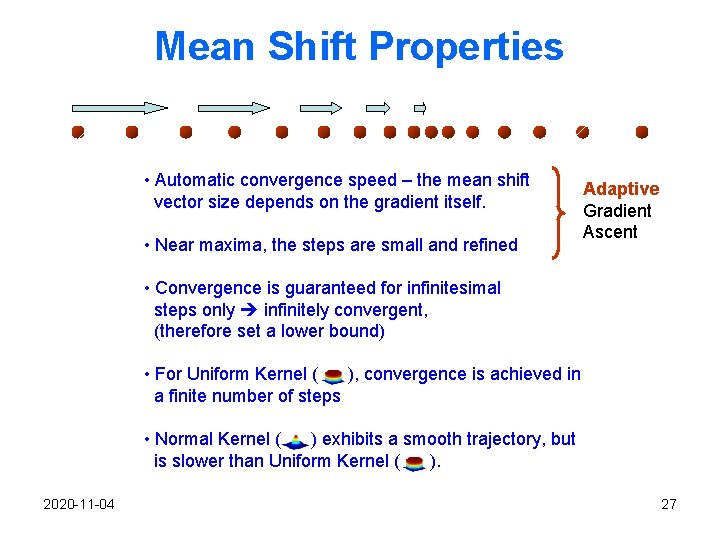
Mean Shift Properties • Automatic convergence speed – the mean shift vector size depends on the gradient itself. • Near maxima, the steps are small and refined Adaptive Gradient Ascent • Convergence is guaranteed for infinitesimal steps only infinitely convergent, (therefore set a lower bound) • For Uniform Kernel ( ), convergence is achieved in a finite number of steps • Normal Kernel ( ) exhibits a smooth trajectory, but is slower than Uniform Kernel ( ). 2020 -11 -04 27
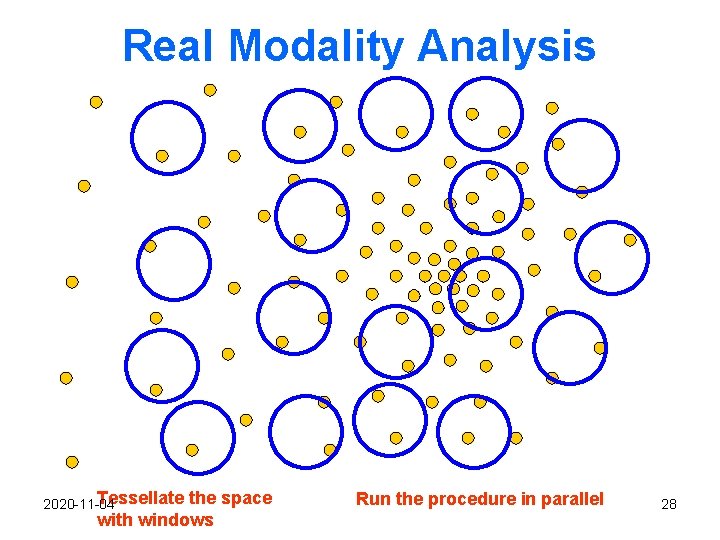
Real Modality Analysis Tessellate 2020 -11 -04 the space with windows Run the procedure in parallel 28
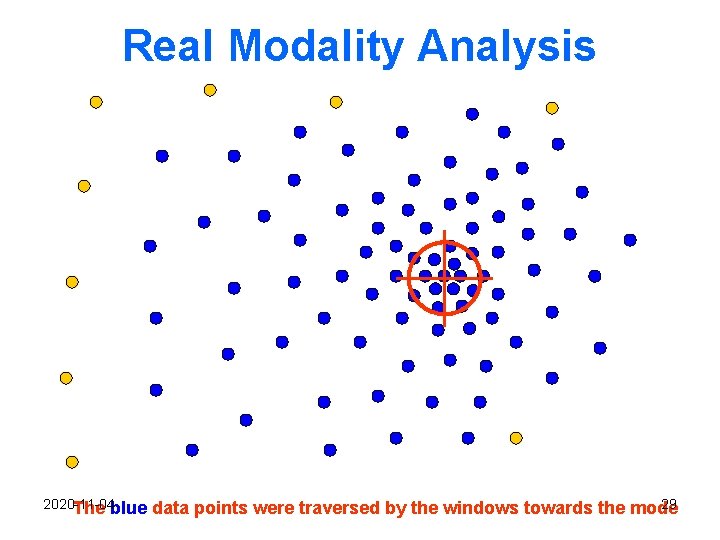
Real Modality Analysis 2020 -11 -04 The blue 29 data points were traversed by the windows towards the mode
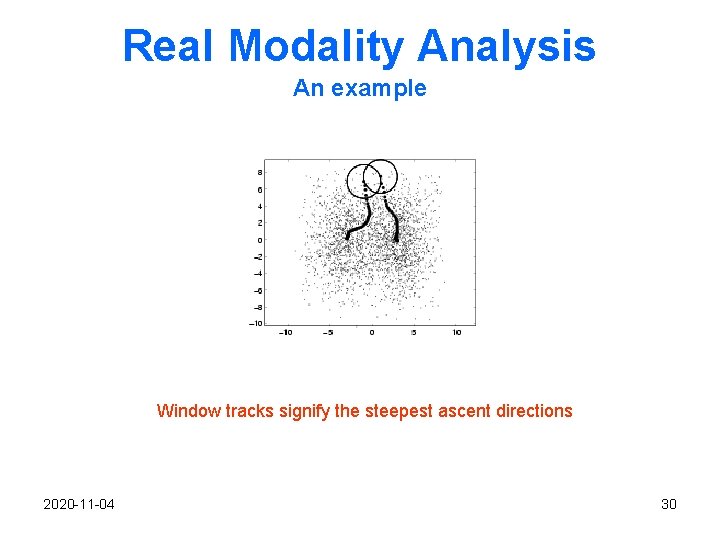
Real Modality Analysis An example Window tracks signify the steepest ascent directions 2020 -11 -04 30
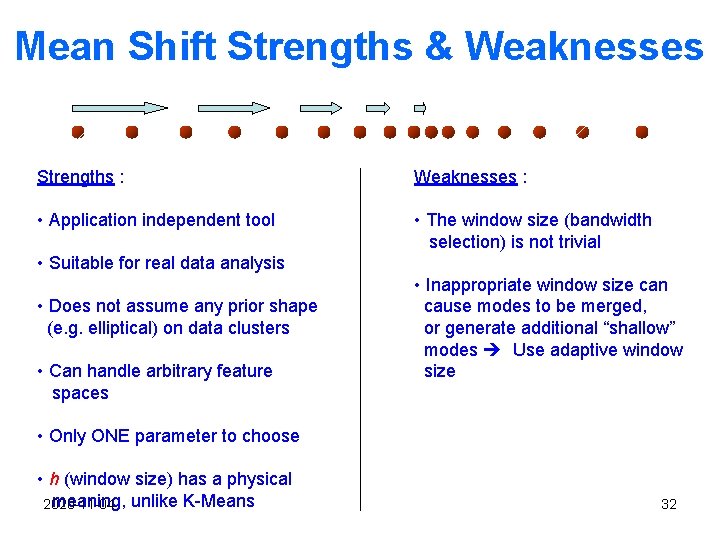
Mean Shift Strengths & Weaknesses Strengths : Weaknesses : • Application independent tool • The window size (bandwidth selection) is not trivial • Suitable for real data analysis • Does not assume any prior shape (e. g. elliptical) on data clusters • Can handle arbitrary feature spaces • Inappropriate window size can cause modes to be merged, or generate additional “shallow” modes Use adaptive window size • Only ONE parameter to choose • h (window size) has a physical meaning, unlike K-Means 2020 -11 -04 32

Mean Shift Applications 2020 -11 -04 33
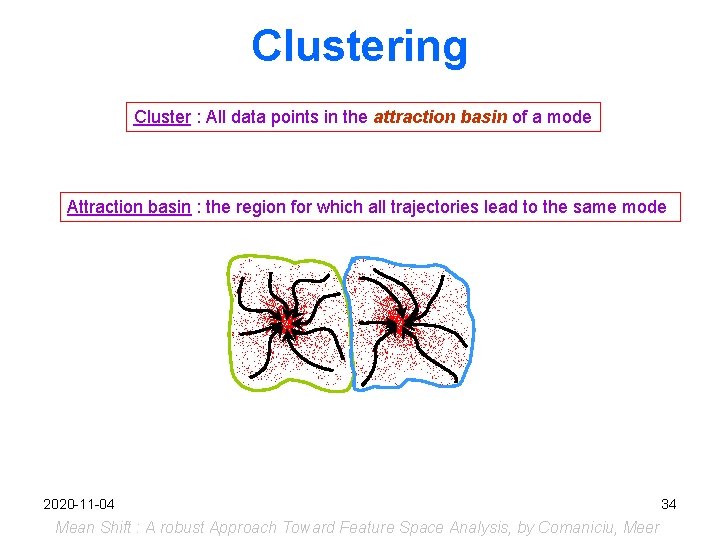
Clustering Cluster : All data points in the attraction basin of a mode Attraction basin : the region for which all trajectories lead to the same mode 2020 -11 -04 Mean Shift : A robust Approach Toward Feature Space Analysis, by Comaniciu, Meer 34
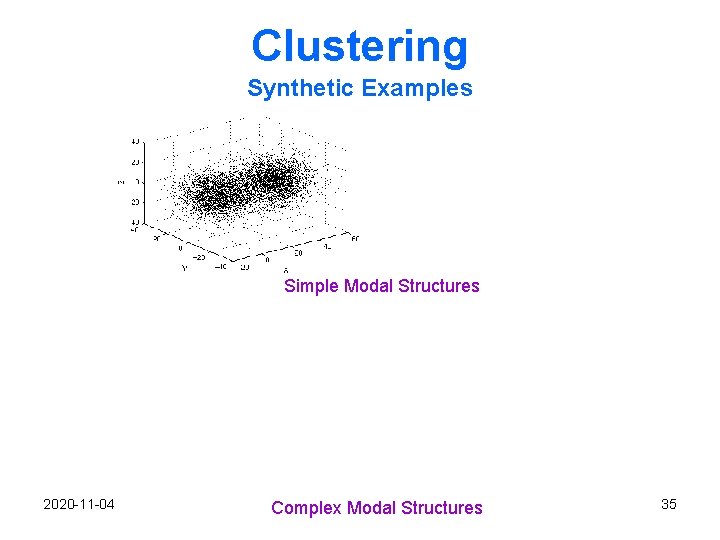
Clustering Synthetic Examples Simple Modal Structures 2020 -11 -04 Complex Modal Structures 35
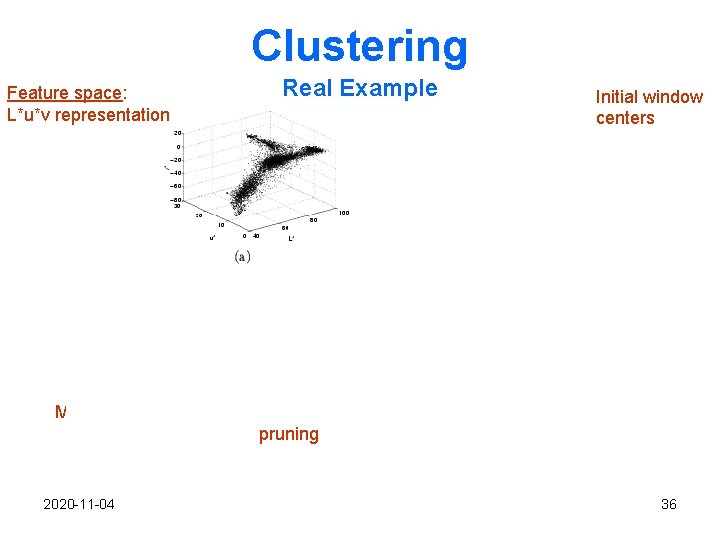
Clustering Feature space: L*u*v representation Modes found 2020 -11 -04 Real Example Modes after pruning Initial window centers Final clusters 36
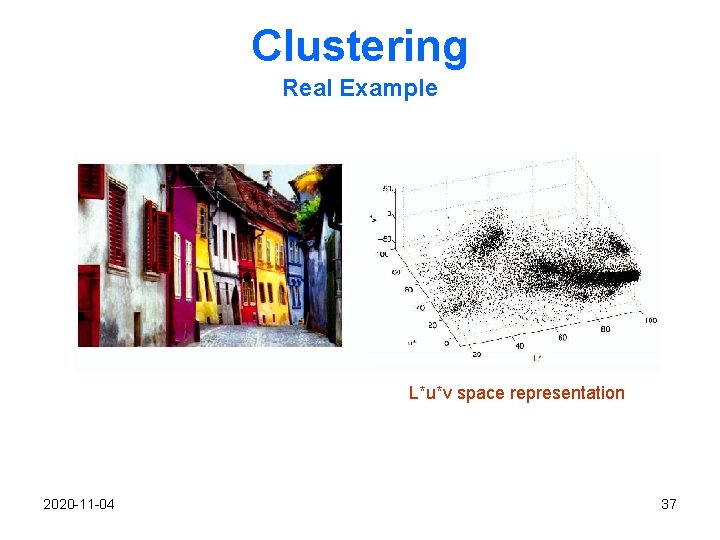
Clustering Real Example L*u*v space representation 2020 -11 -04 37
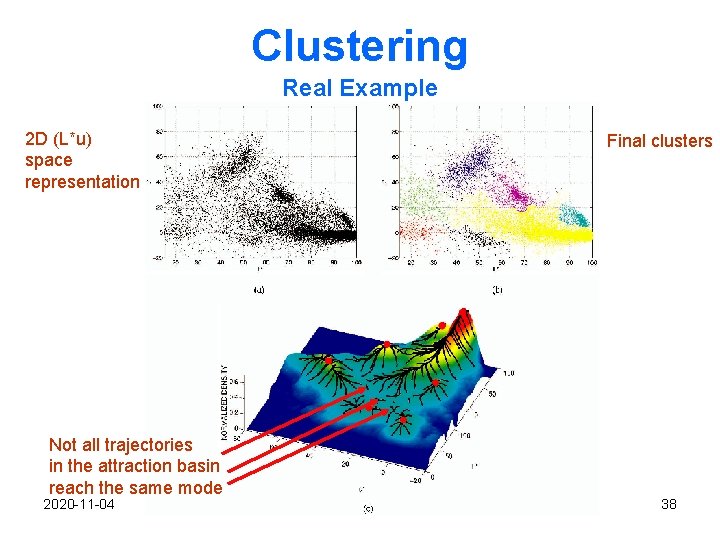
Clustering Real Example 2 D (L*u) space representation Not all trajectories in the attraction basin reach the same mode 2020 -11 -04 Final clusters 38
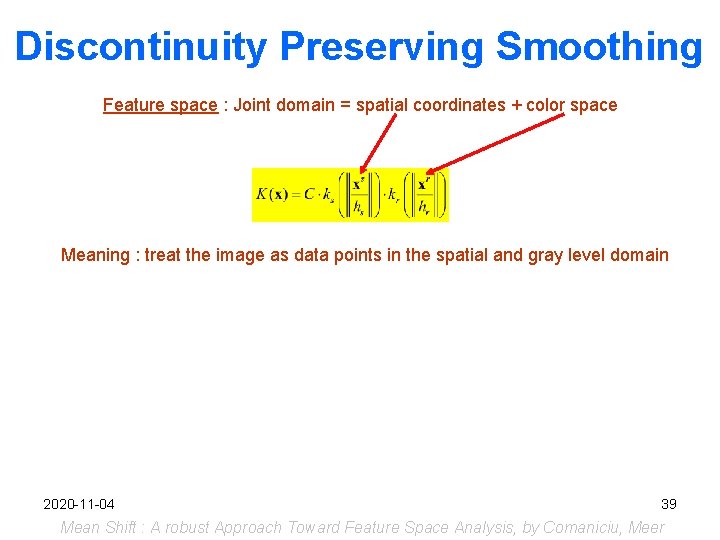
Discontinuity Preserving Smoothing Feature space : Joint domain = spatial coordinates + color space Meaning : treat the image as data points in the spatial and gray level domain Image Data (slice) 2020 -11 -04 Mean Shift vectors Smoothing result 39 Mean Shift : A robust Approach Toward Feature Space Analysis, by Comaniciu, Meer
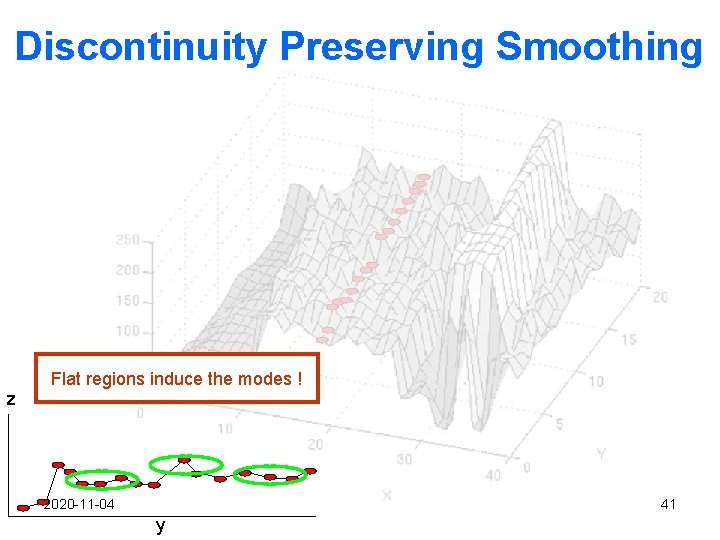
Discontinuity Preserving Smoothing Flat regions induce the modes ! z 2020 -11 -04 41 y
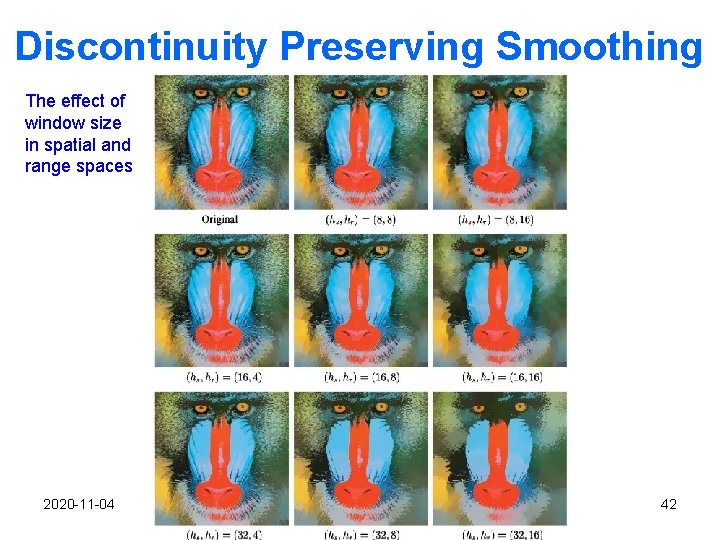
Discontinuity Preserving Smoothing The effect of window size in spatial and range spaces 2020 -11 -04 42
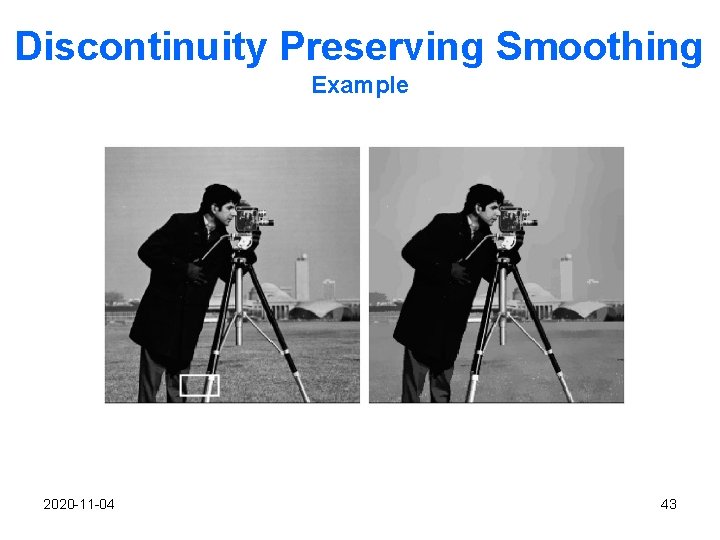
Discontinuity Preserving Smoothing Example 2020 -11 -04 43
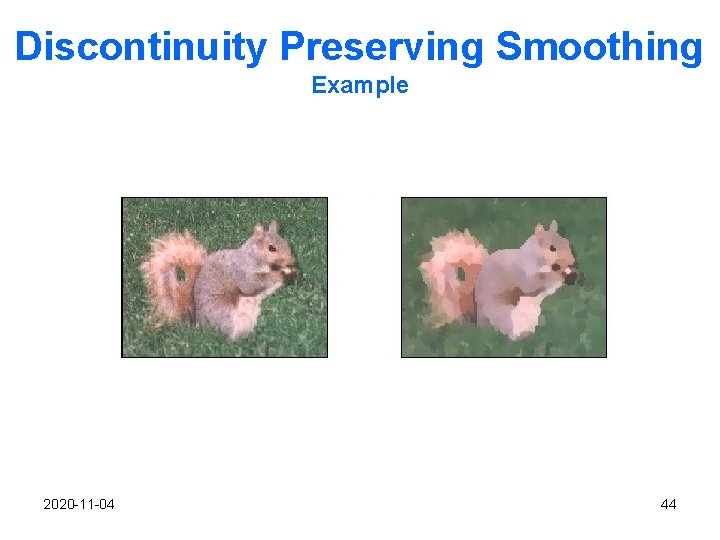
Discontinuity Preserving Smoothing Example 2020 -11 -04 44
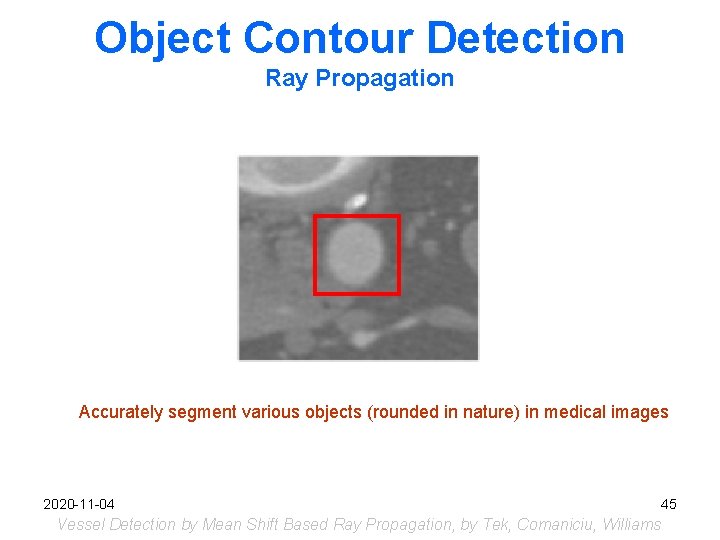
Object Contour Detection Ray Propagation Accurately segment various objects (rounded in nature) in medical images 2020 -11 -04 45 Vessel Detection by Mean Shift Based Ray Propagation, by Tek, Comaniciu, Williams
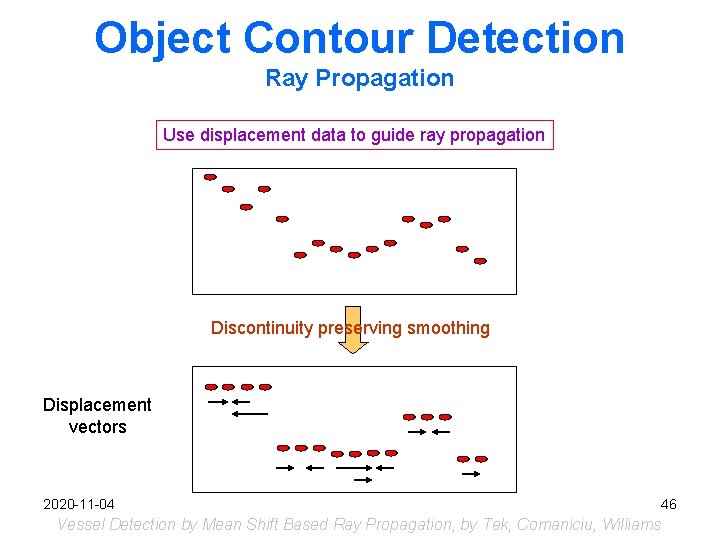
Object Contour Detection Ray Propagation Use displacement data to guide ray propagation Discontinuity preserving smoothing Displacement vectors 2020 -11 -04 46 Vessel Detection by Mean Shift Based Ray Propagation, by Tek, Comaniciu, Williams
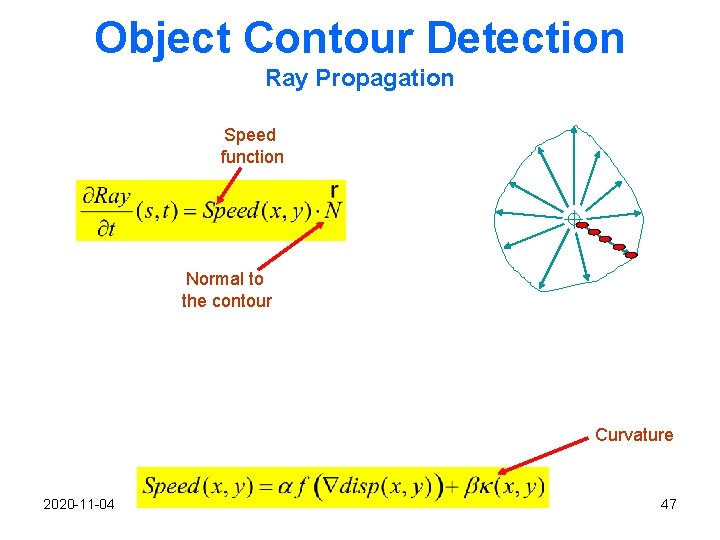
Object Contour Detection Ray Propagation Speed function Normal to the contour Curvature 2020 -11 -04 47
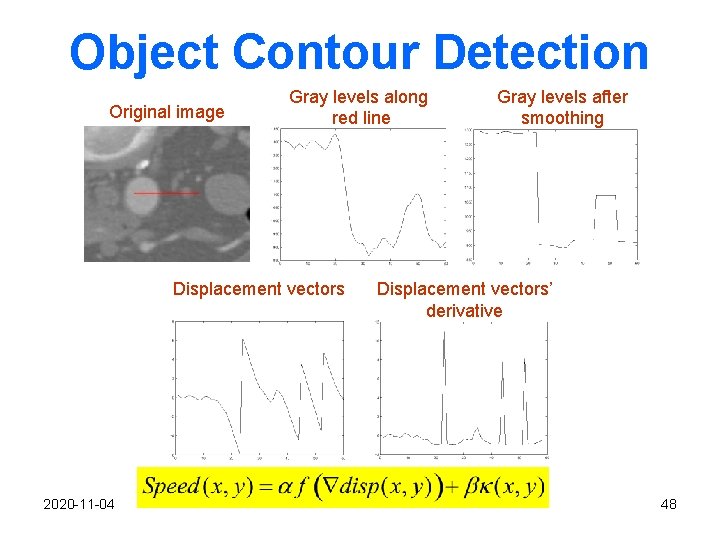
Object Contour Detection Original image Gray levels along red line Displacement vectors 2020 -11 -04 Gray levels after smoothing Displacement vectors’ derivative 48
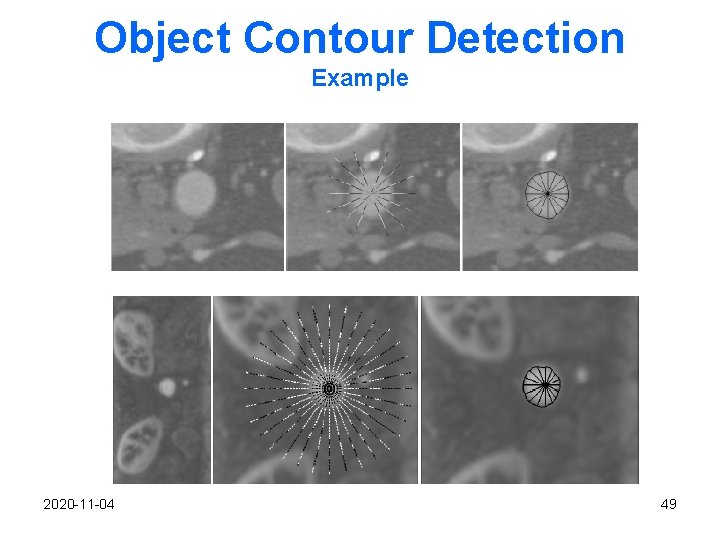
Object Contour Detection Example 2020 -11 -04 49
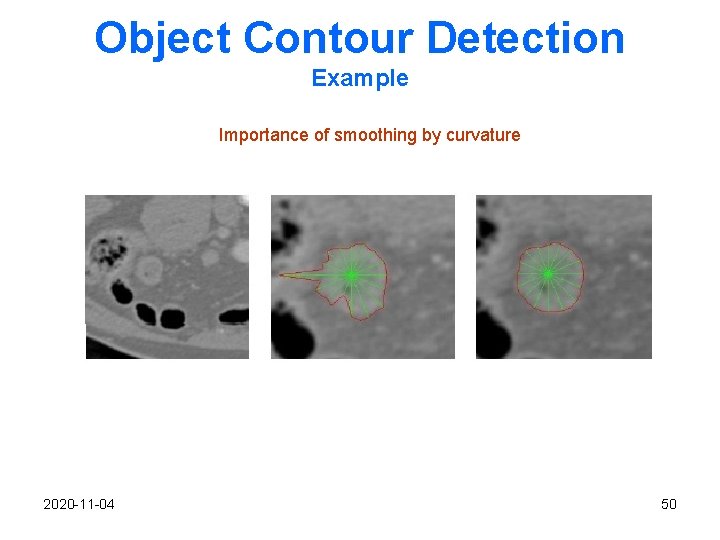
Object Contour Detection Example Importance of smoothing by curvature 2020 -11 -04 50
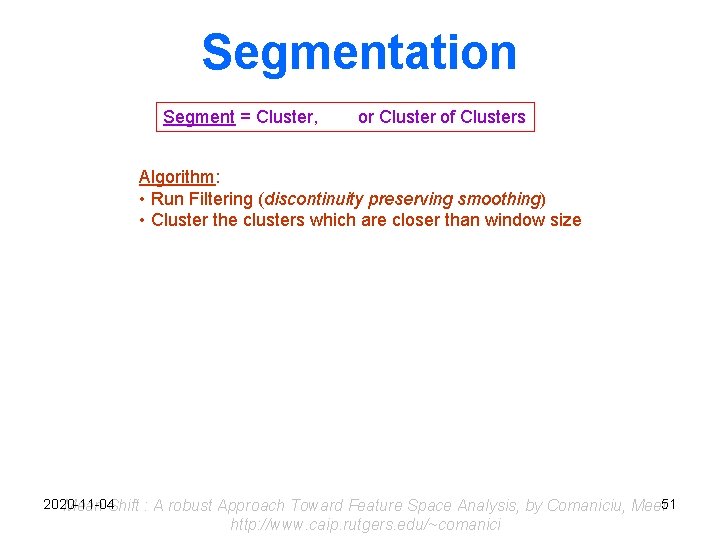
Segmentation Segment = Cluster, or Cluster of Clusters Algorithm: • Run Filtering (discontinuity preserving smoothing) • Cluster the clusters which are closer than window size Image Data (slice) Mean Shift vectors Smoothing result Segmentation result 2020 -11 -04 Mean Shift : A robust Approach Toward Feature Space Analysis, by Comaniciu, Meer 51 http: //www. caip. rutgers. edu/~comanici
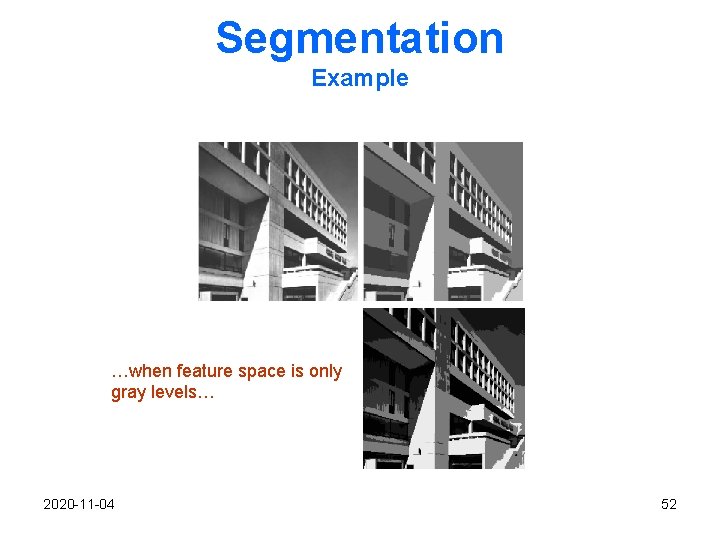
Segmentation Example …when feature space is only gray levels… 2020 -11 -04 52
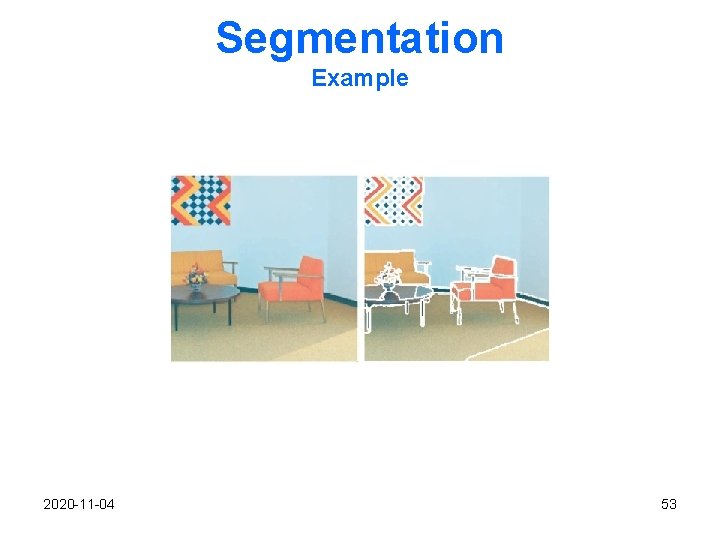
Segmentation Example 2020 -11 -04 53
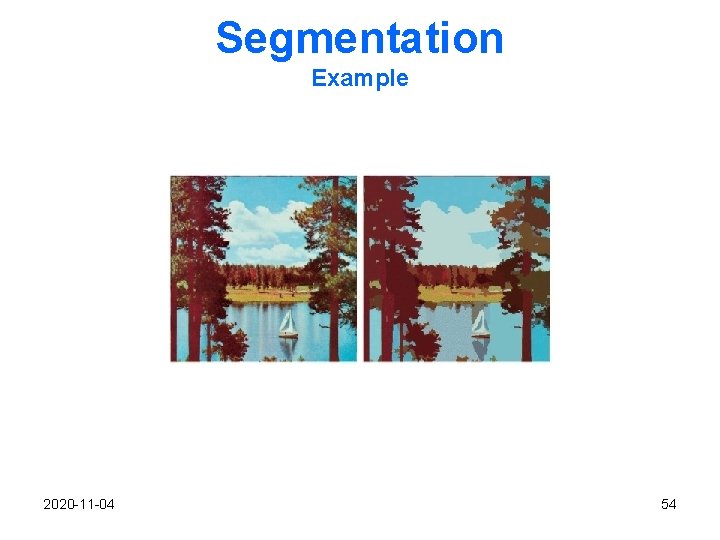
Segmentation Example 2020 -11 -04 54
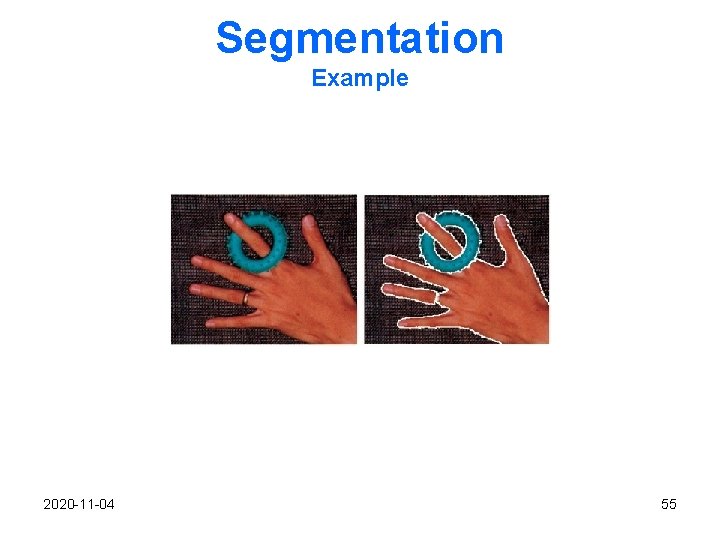
Segmentation Example 2020 -11 -04 55
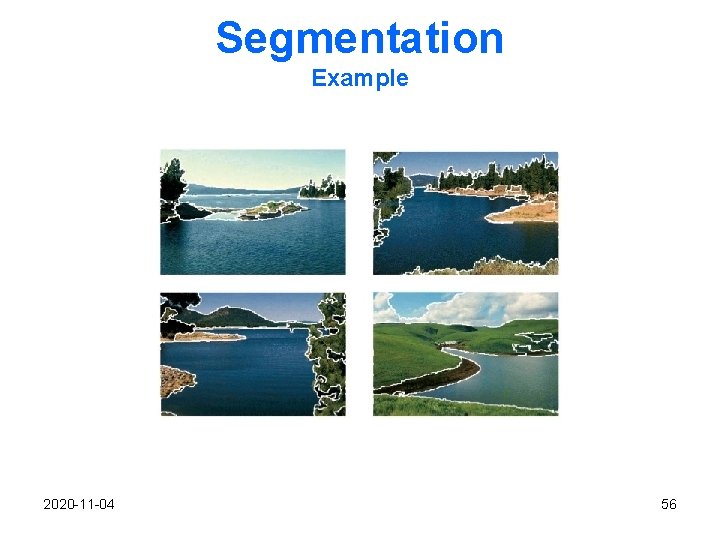
Segmentation Example 2020 -11 -04 56
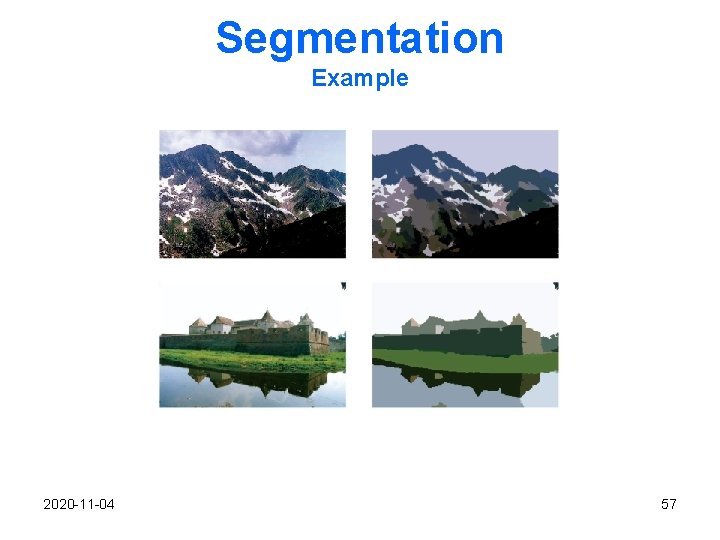
Segmentation Example 2020 -11 -04 57
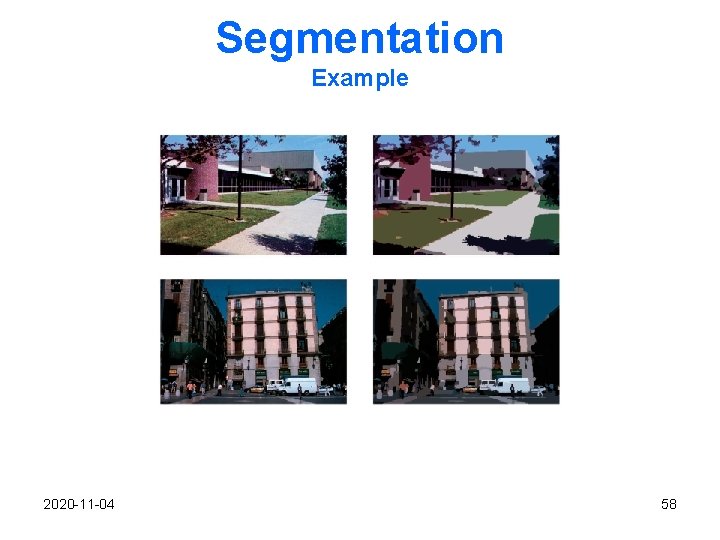
Segmentation Example 2020 -11 -04 58
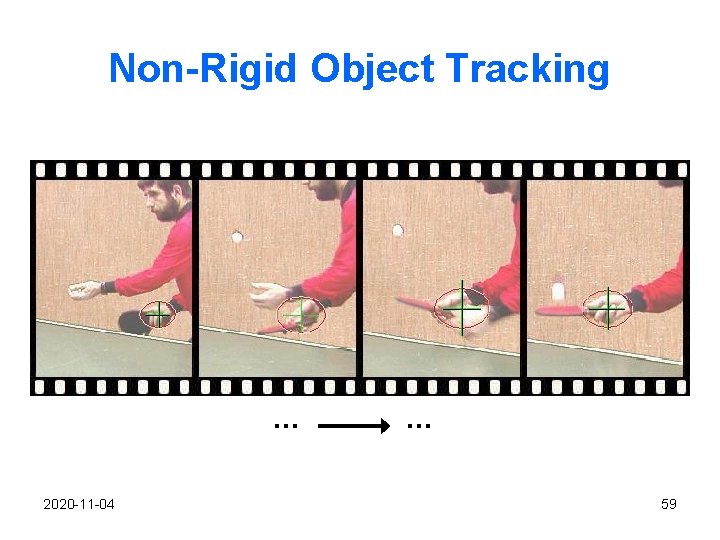
Non-Rigid Object Tracking … 2020 -11 -04 … 59
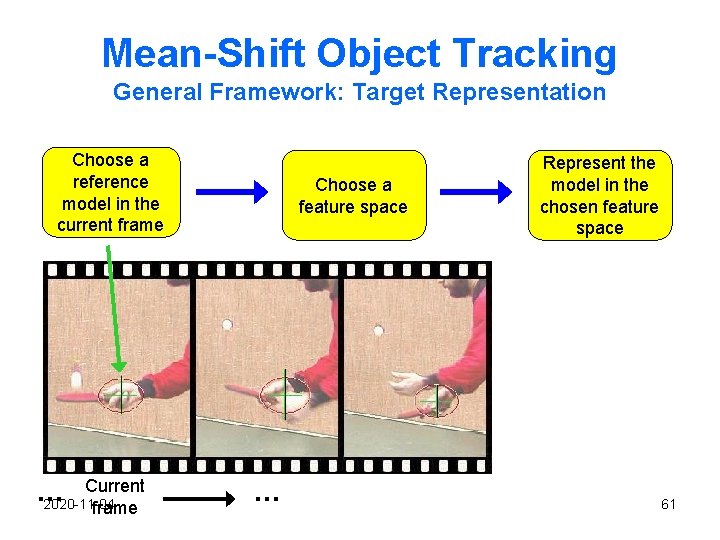
Mean-Shift Object Tracking General Framework: Target Representation Choose a reference model in the current frame Current … 2020 -11 -04 frame Choose a feature space … Represent the model in the chosen feature space 61
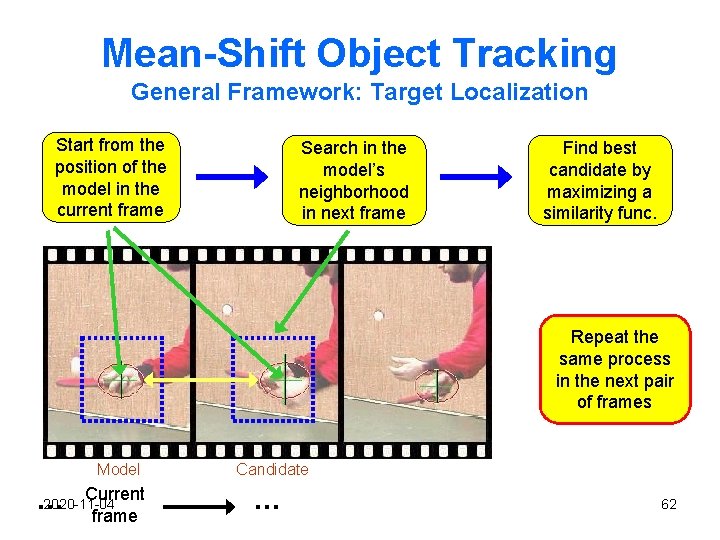
Mean-Shift Object Tracking General Framework: Target Localization Start from the position of the model in the current frame Search in the model’s neighborhood in next frame Find best candidate by maximizing a similarity func. Repeat the same process in the next pair of frames Model Current … 2020 -11 -04 frame Candidate … 62
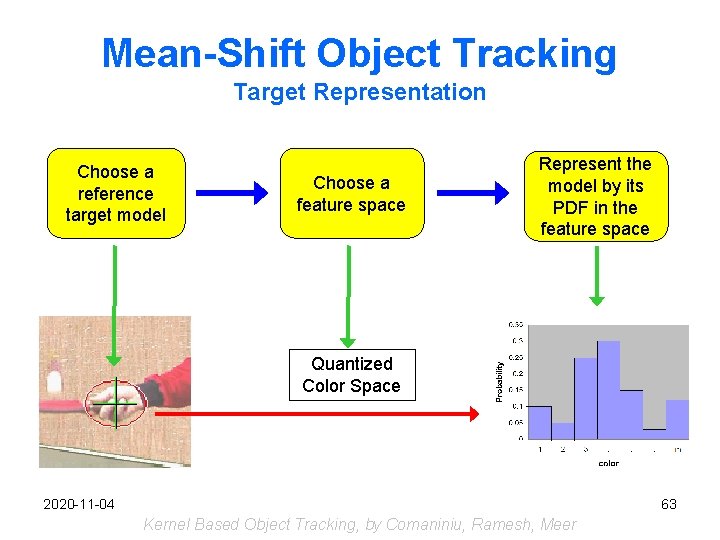
Mean-Shift Object Tracking Target Representation Choose a reference target model Choose a feature space Represent the model by its PDF in the feature space Quantized Color Space 2020 -11 -04 63 Kernel Based Object Tracking, by Comaniniu, Ramesh, Meer
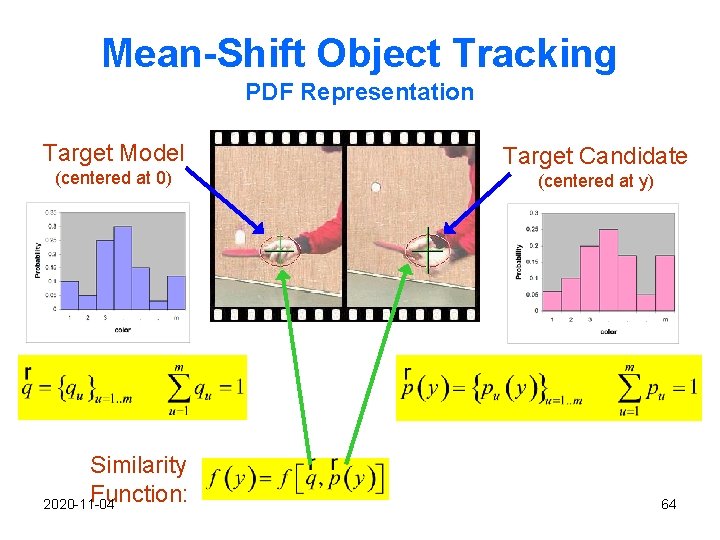
Mean-Shift Object Tracking PDF Representation Target Model (centered at 0) Similarity Function: 2020 -11 -04 Target Candidate (centered at y) 64
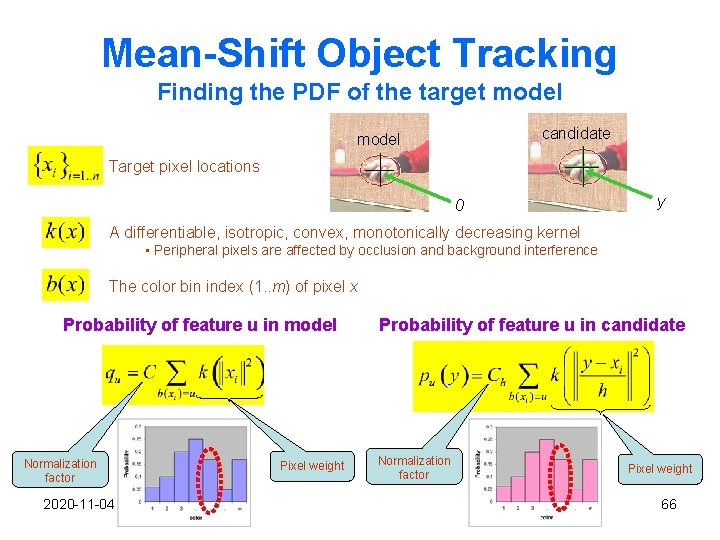
Mean-Shift Object Tracking Finding the PDF of the target model candidate model Target pixel locations 0 y A differentiable, isotropic, convex, monotonically decreasing kernel • Peripheral pixels are affected by occlusion and background interference The color bin index (1. . m) of pixel x Probability of feature u in model Normalization factor 2020 -11 -04 Pixel weight Probability of feature u in candidate Normalization factor Pixel weight 66
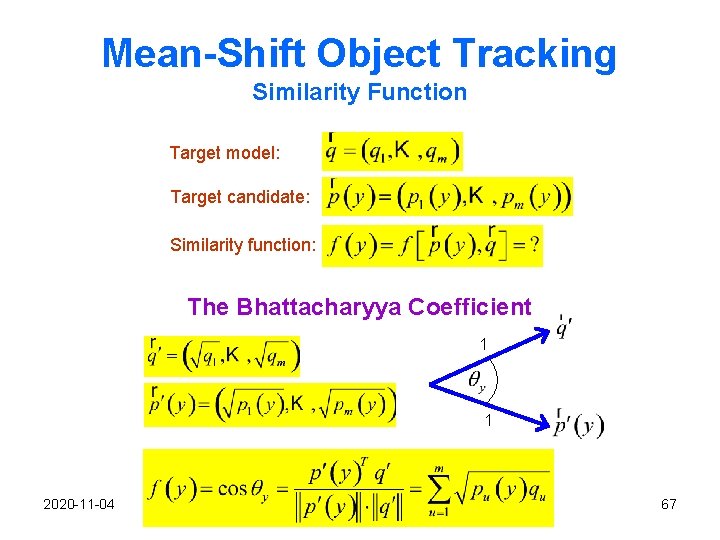
Mean-Shift Object Tracking Similarity Function Target model: Target candidate: Similarity function: The Bhattacharyya Coefficient 1 1 2020 -11 -04 67
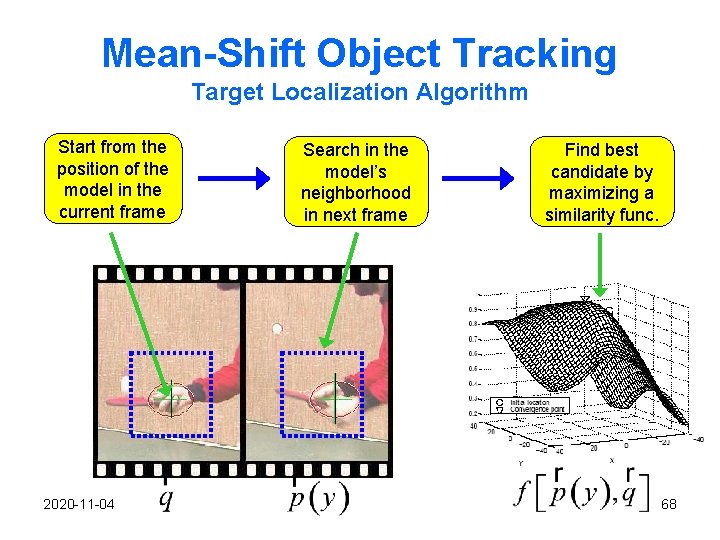
Mean-Shift Object Tracking Target Localization Algorithm Start from the position of the model in the current frame 2020 -11 -04 Search in the model’s neighborhood in next frame Find best candidate by maximizing a similarity func. 68
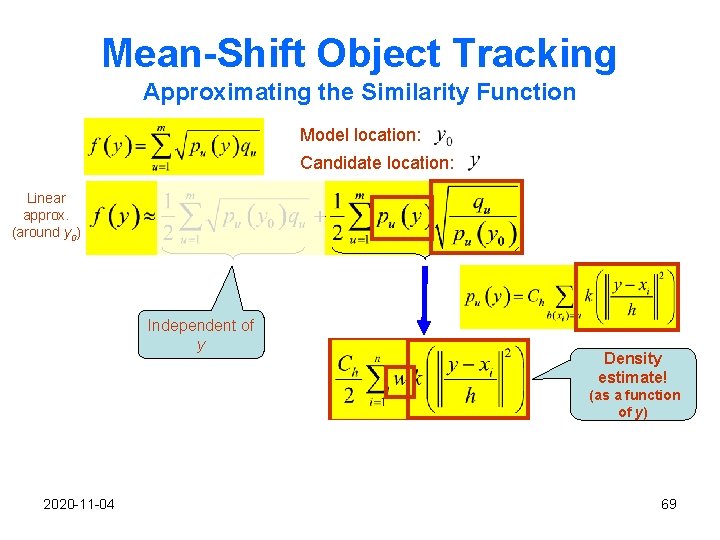
Mean-Shift Object Tracking Approximating the Similarity Function Model location: Candidate location: Linear approx. (around y 0) Independent of y Density estimate! (as a function of y) 2020 -11 -04 69
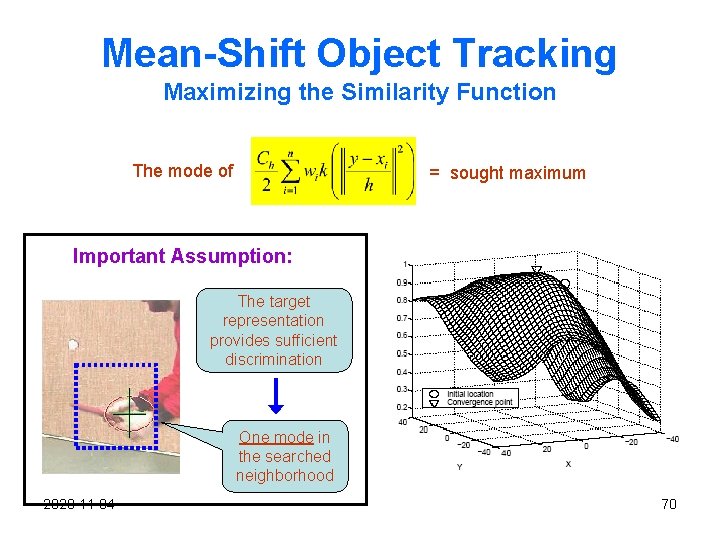
Mean-Shift Object Tracking Maximizing the Similarity Function The mode of = sought maximum Important Assumption: The target representation provides sufficient discrimination One mode in the searched neighborhood 2020 -11 -04 70
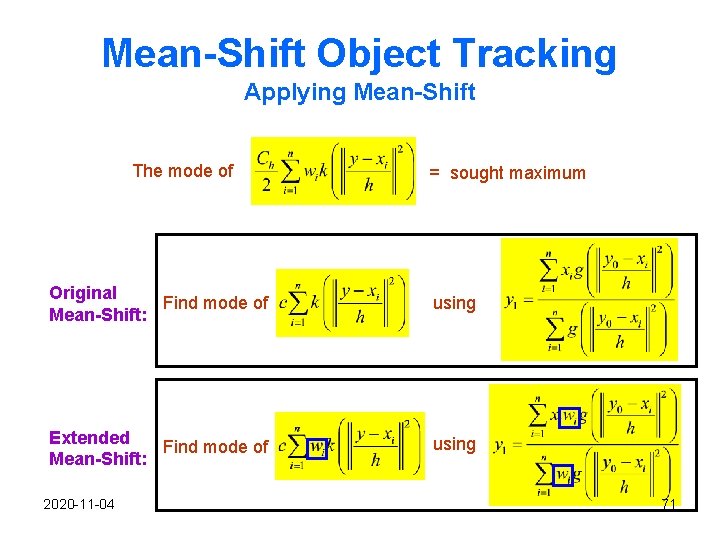
Mean-Shift Object Tracking Applying Mean-Shift The mode of = sought maximum Original Find mode of Mean-Shift: using Extended Find mode of Mean-Shift: using 2020 -11 -04 71
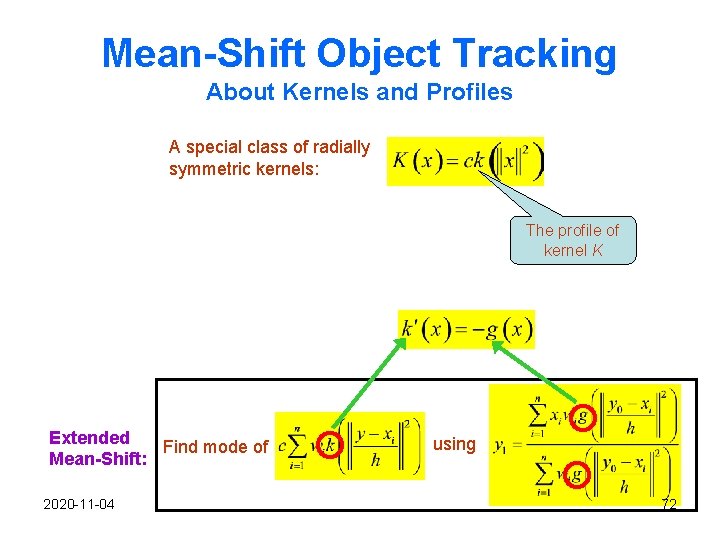
Mean-Shift Object Tracking About Kernels and Profiles A special class of radially symmetric kernels: The profile of kernel K Extended Find mode of Mean-Shift: 2020 -11 -04 using 72
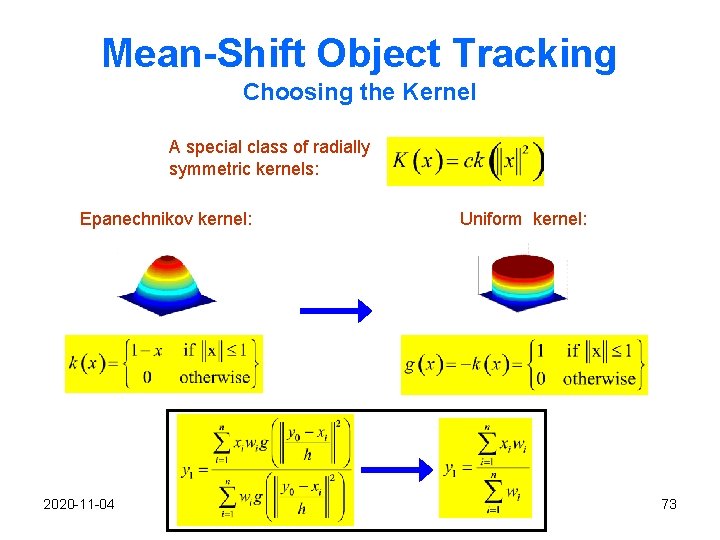
Mean-Shift Object Tracking Choosing the Kernel A special class of radially symmetric kernels: Epanechnikov kernel: 2020 -11 -04 Uniform kernel: 73
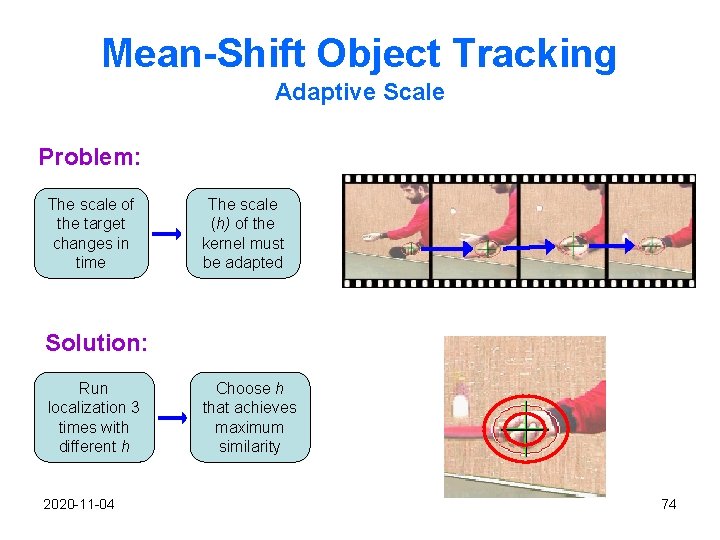
Mean-Shift Object Tracking Adaptive Scale Problem: The scale of the target changes in time The scale (h) of the kernel must be adapted Solution: Run localization 3 times with different h 2020 -11 -04 Choose h that achieves maximum similarity 74
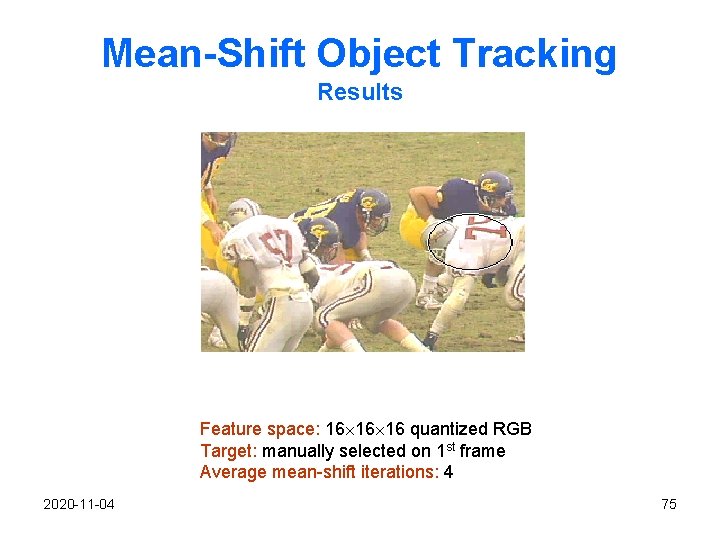
Mean-Shift Object Tracking Results Feature space: 16 16 16 quantized RGB Target: manually selected on 1 st frame Average mean-shift iterations: 4 2020 -11 -04 75
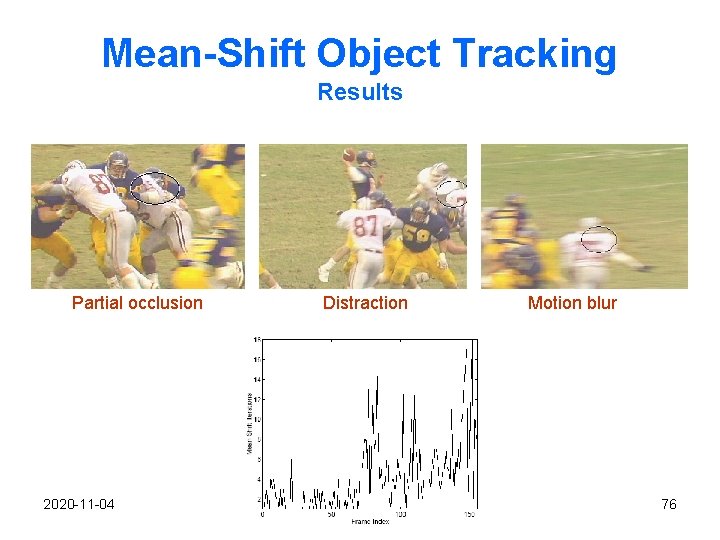
Mean-Shift Object Tracking Results Partial occlusion 2020 -11 -04 Distraction Motion blur 76
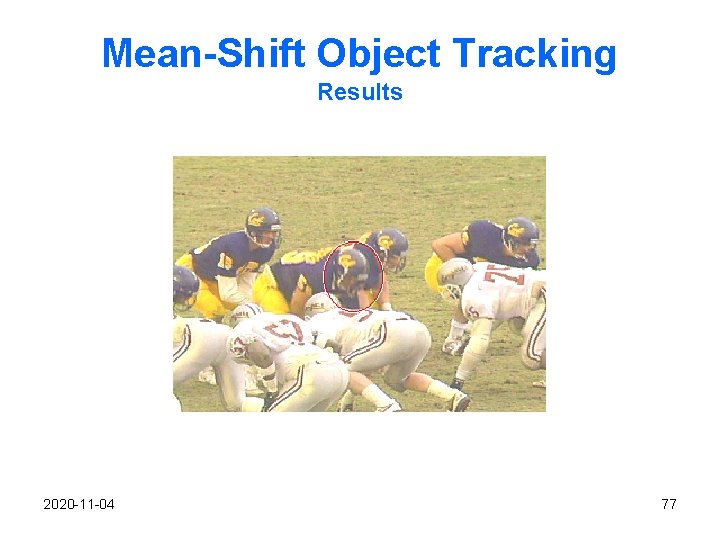
Mean-Shift Object Tracking Results 2020 -11 -04 77
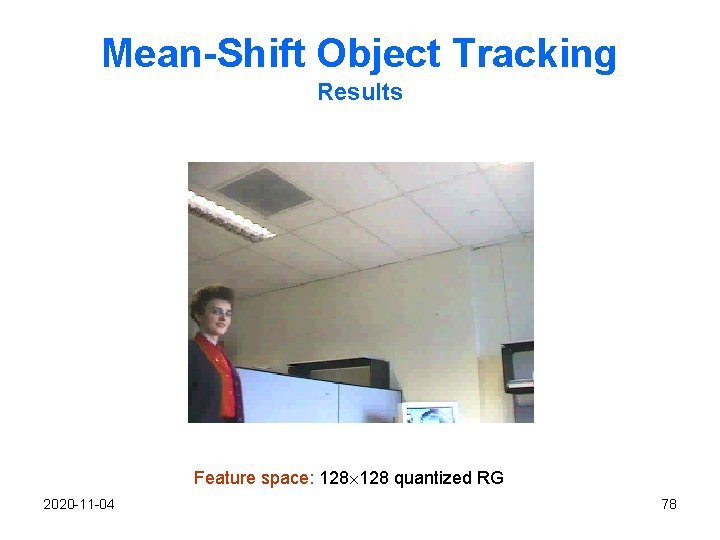
Mean-Shift Object Tracking Results Feature space: 128 quantized RG 2020 -11 -04 78
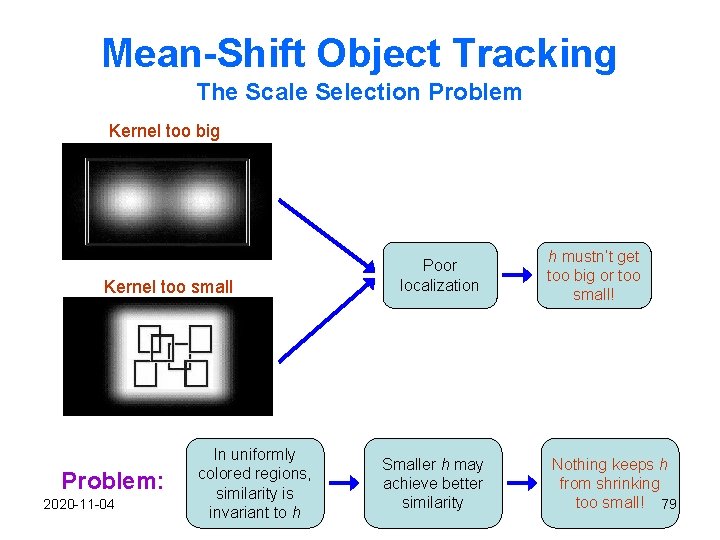
Mean-Shift Object Tracking The Scale Selection Problem Kernel too big Kernel too small Problem: 2020 -11 -04 In uniformly colored regions, similarity is invariant to h Poor localization Smaller h may achieve better similarity h mustn’t get too big or too small! Nothing keeps h from shrinking too small! 79
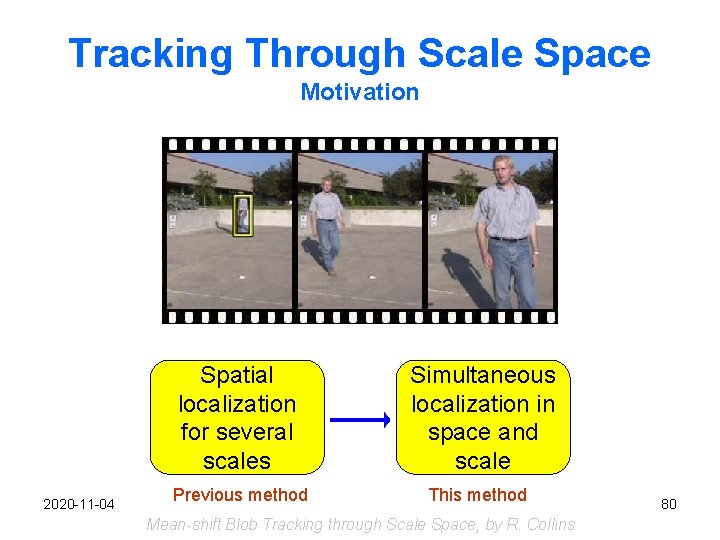
Tracking Through Scale Space Motivation Spatial localization for several scales 2020 -11 -04 Previous method Simultaneous localization in space and scale This method Mean-shift Blob Tracking through Scale Space, by R. Collins 80
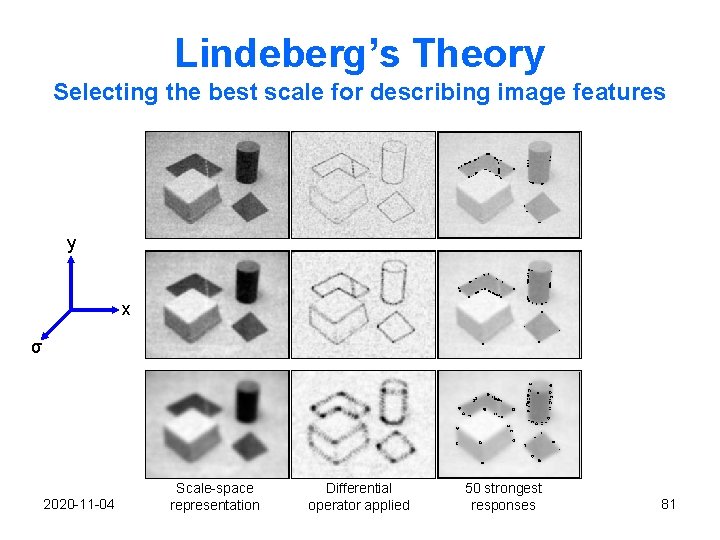
Lindeberg’s Theory Selecting the best scale for describing image features y x σ 2020 -11 -04 Scale-space representation Differential operator applied 50 strongest responses 81
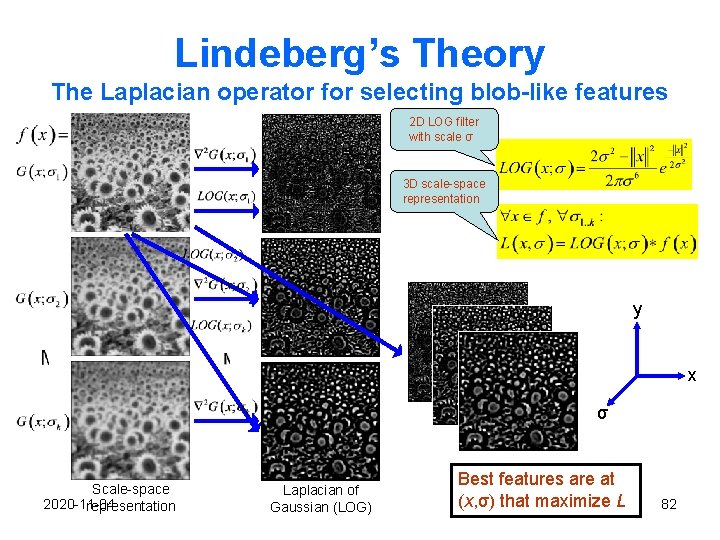
Lindeberg’s Theory The Laplacian operator for selecting blob-like features 2 D LOG filter with scale σ 3 D scale-space representation y x σ Scale-space 2020 -11 -04 representation Laplacian of Gaussian (LOG) Best features are at (x, σ) that maximize L 82
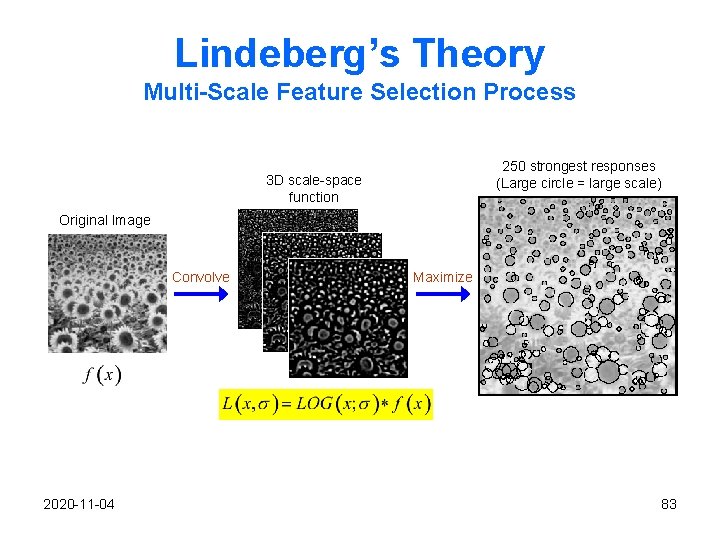
Lindeberg’s Theory Multi-Scale Feature Selection Process 250 strongest responses (Large circle = large scale) 3 D scale-space function Original Image Convolve 2020 -11 -04 Maximize 83
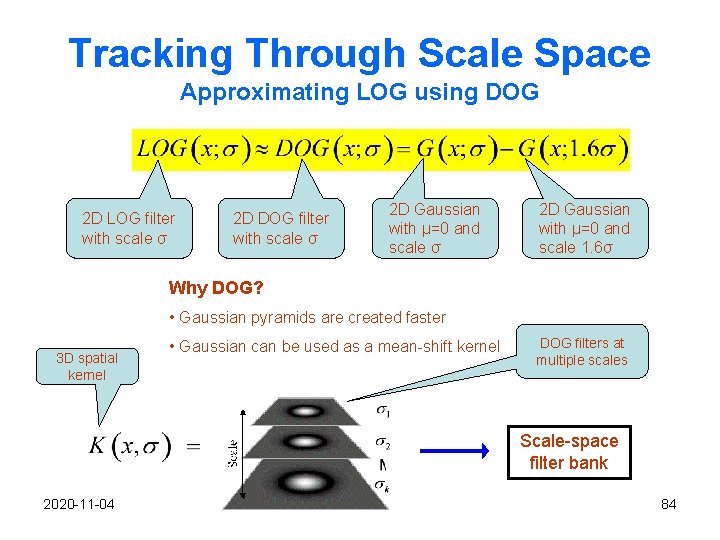
Tracking Through Scale Space Approximating LOG using DOG 2 D LOG filter with scale σ 2 D DOG filter with scale σ 2 D Gaussian with μ=0 and scale 1. 6σ Why DOG? • Gaussian pyramids are created faster 3 D spatial kernel • Gaussian can be used as a mean-shift kernel DOG filters at multiple scales Scale-space filter bank 2020 -11 -04 84
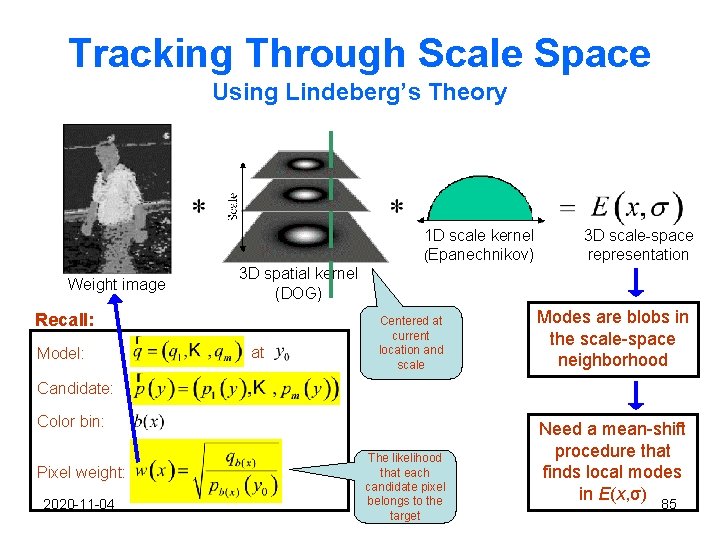
Tracking Through Scale Space Using Lindeberg’s Theory 1 D scale kernel (Epanechnikov) Weight image 3 D spatial kernel (DOG) Recall: Model: 3 D scale-space representation at Centered at current location and scale Modes are blobs in the scale-space neighborhood Candidate: Color bin: Pixel weight: 2020 -11 -04 The likelihood that each candidate pixel belongs to the target Need a mean-shift procedure that finds local modes in E(x, σ) 85
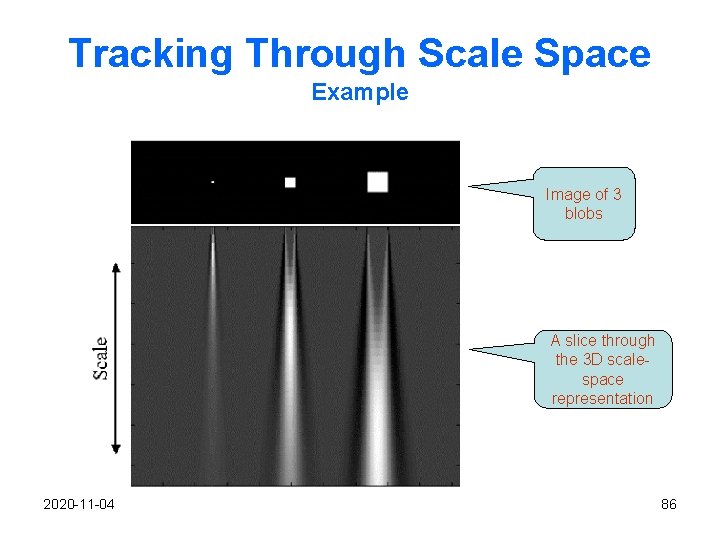
Tracking Through Scale Space Example Image of 3 blobs A slice through the 3 D scalespace representation 2020 -11 -04 86
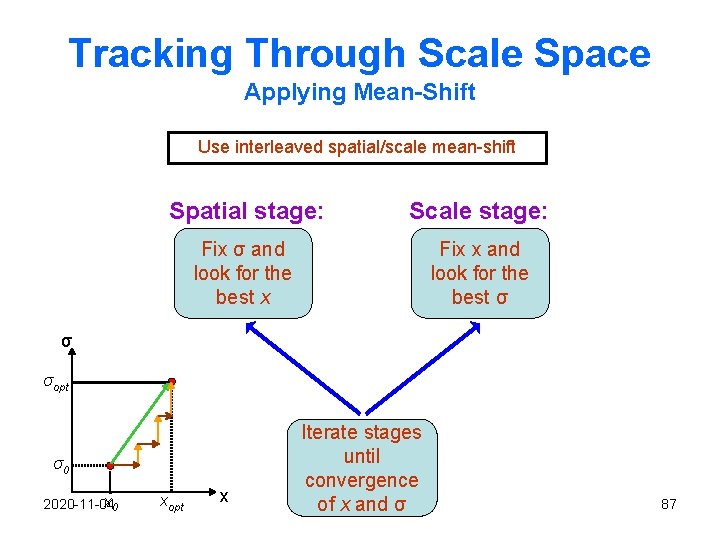
Tracking Through Scale Space Applying Mean-Shift Use interleaved spatial/scale mean-shift Spatial stage: Scale stage: Fix σ and look for the best x Fix x and look for the best σ σ σopt σ0 x 0 2020 -11 -04 xopt x Iterate stages until convergence of x and σ 87
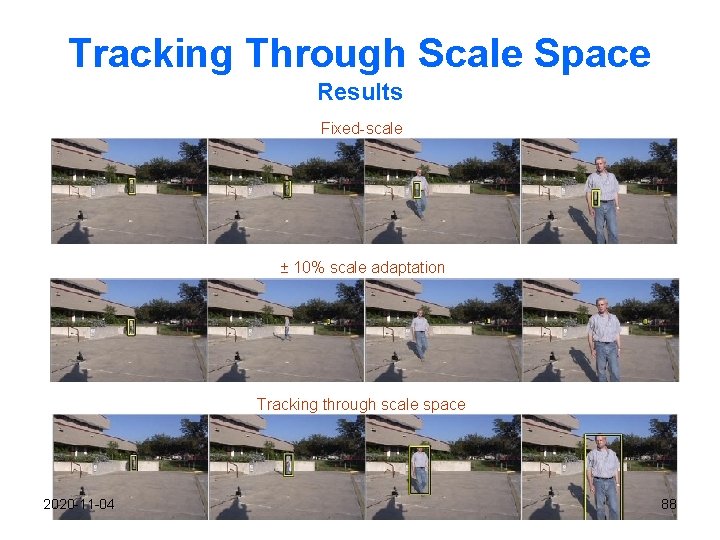
Tracking Through Scale Space Results Fixed-scale ± 10% scale adaptation Tracking through scale space 2020 -11 -04 88

2020 -11 -04 89
- Slides: 84