Mean from a Frequency Table Calculating the Mean

Mean from a Frequency Table Calculating the Mean: If there are large amounts of data, it is easier if it is displayed in a frequency table. Example 1. The number of goals scored by a team in 20 games are given below : 3, 2, 4, 2, 2, 3, 2, 2, 0, 5, 1, 1, 2, 3, 0, 2, 1, 4, 1, 0 Goals x Frequency, f f. x 0 3 0 1 4 4 2 7 14 3 3 9 4 2 8 5 1 5 ∑f= 20 Mode ∑fx= 40 Mean = ∑fx ∑f = 40 20 =2

Median from a Frequency Table Calculating the median If there are large amounts of data, it is easier if it is displayed in a frequency table. Example 1. The number of goals scored by a team in 20 games are given below : 3, 2, 4, 2, 2, 3, 2, 2, 0, 5, 1, 1, 2, 3, 0, 2, 1, 4, 1, 0 (20)/2 Goals x Frequency, f C. F. 0 3 3 = 10 1 4 7 2 7 14 (20)/2 + 1 = 11 3 3 17 4 2 19 5 1 20 ∑f= 20 Mode The 10 th value is 2 The 11 th value is 2 ∴ MEDIAN = ( 2+2 ) / 2 = 4/2 = 2

Grouped Data Large quantities of data can be much more easily viewed and managed if placed in groups in a frequency table. Grouped data does not enable exact values for the mean, median and mode to be calculated. Alternate methods of analyising the data have to be employed. Example 1. During 3 hours at Heathrow airport 55 aircraft arrived late. The number of minutes they were late is shown in the grouped frequency table below. Data is grouped into 6 class intervals of width 10. minutes late frequency 0 -9 27 10 - 19 10 20 - 29 7 30 - 39 5 40 - 49 4 50 - 59 2

Grouped Data Estimating the Mean: An estimate for the mean can be obtained by assuming that each of the raw data values takes the midpoint value of the interval in which it has been placed. Example 1. During 3 hours at Heathrow airport 55 aircraft arrived late. The number of minutes they were late is shown in the grouped frequency table below. minutes Late Frequency, f midpoint(c. c. ) F × c. c. 0 -9 27 4. 5 10 - 19 10 14. 5 20 - 29 7 30 - 39 5 24. 5 34. 5 40 - 49 4 44. 5 178 50 - 59 2 54. 5 109 121. 5 145 171. 5 172. 5 Mean estimate = 897. 5/55 ≈ 16. 32 minutes

Grouped Data The Modal Class The modal class is simply the class interval of highest frequency. Example 1. During 3 hours at Heathrow airport 55 aircraft arrived late. The number of minutes they were late is shown in the grouped frequency table below. minutes late frequency 0 -9 27 10 - 19 10 20 - 29 7 30 - 39 5 40 - 49 4 50 - 59 2 Modal class = 0 - 9
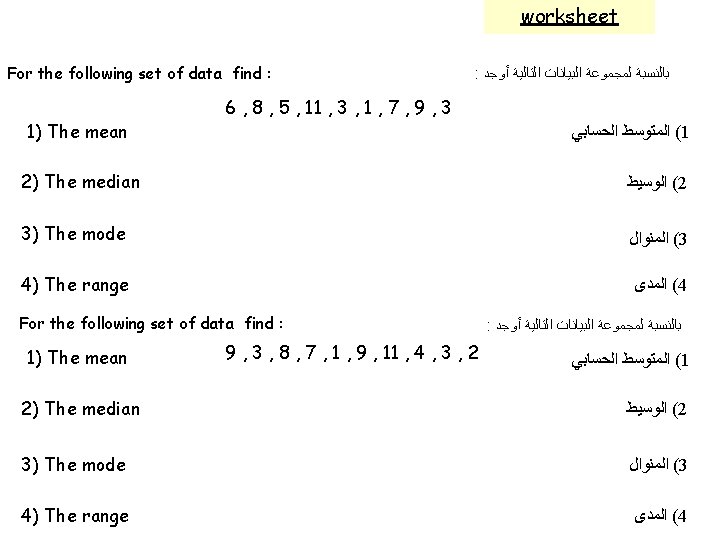
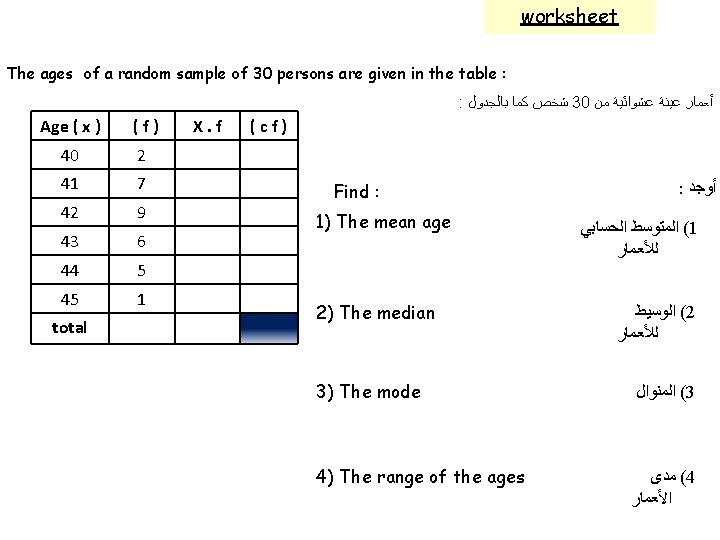

worksheet The following frequency distribution represents the lengths of 20 persons ﺷﺨﺺ 20 ﺍﻟﺘﻮﺯﻳﻊ ﺍﻟﺘﻜﺮﺍﺭﻱ ﻳﻤﺜﻞ ﺃﻄﻮﺍﻝ intervals (f) 150 - 154 2 155 - 159 8 160 - 164 5 165 - 169 4 170 - 179 1 c. c. × f Find : : ﺃﻮﺟﺪ 1) The mean of the lengths ( ﺍﻟﻤﺘﻮﺳﻂ ﺍﻟﺤﺴﺎﺑﻲ 1 ﻟﻸﻄﻮﺍﻝ total 2) The model class and estimate the mode 3) The range of the lengths ( ﺍﻛﺘﺐ ﺍﻟﻔﺌﺔ ﺍﻟﻤﻨﻮﺍﻟﻴﺔ ﻭﻗﺪﺭ ﺍﻟﻤﻨﻮﺍﻝ 2 ( ﺃﻮﺟﺪ ﻣﺪﻯ 3 ﺍﻷﻄﻮﺍﻝ

worksheet The grades of 25 students are given below : : ﻃﺎﻟﺐ ﻛﻤﺎ ﻳﻠﻲ 25 ﺩﺭﺟﺎﺕ 42 , 63 , 47 , 77 , 46 , 71 , 68 , 83 , 91 , 55 , 67 , 66 , 63 , 57 , 50 , 69 , 73 , 82, 77 , 58 , 66 , 79 , 88 , 97 , 86 1) Put the grades in a frequency table with intervals 2) Draw the cumulative frequency polygon 3) Use the graph to estimate the median Intervals ﺍﻟﻔﺌﺎﺕ total (f) (cf) ( ﺿﻊ ﺍﻟﺪﺭﺟﺎﺕ ﻓﻲ ﺟﺪﻭﻝ ﺗﻜﺮﺍﺭﻱ ﺫﻭ ﻓﺌﺎﺕ 1 ( ﺍﺭﺳﻢ ﺍﻟﻤﻀﻠﻊ ﺍﻟﺘﻜﺮﺍﺭﻱ ﺍﻟﺘﺮﺍﻛﻤﻲ 2 ( ﺍﺳﺘﺨﺪﻡ ﺍﻟﺮﺳﻢ ﻟﺘﻘﺪﺭ ﻗﻴﻤﺔ ﺍﻟﻮﺳﻴﻂ 3

Grouped Data The Median Class Interval is the class interval containing the median. Example 1. During 3 hours at Heathrow airport 55 aircraft arrived late. The number of minutes they were late is shown in the grouped frequency table below. minutes late frequency 0 -9 27 10 - 19 10 20 - 29 7 30 - 39 5 40 - 49 4 50 - 59 2 (55+1)/2 = 28 The 28 th data value is in the 10 - 19 class

Grouped Data Example 2. A group of University students took part in a sponsored race. The number of laps completed is given in the table below. Use the information to: (a) Calculate an estimate for the mean number of laps. (b) Determine the modal class. (c) Determine the class interval containing the median. Data is grouped into 8 class intervals of width 4. number of laps frequency (x) 1 -5 2 6 – 10 9 11 – 15 15 16 – 20 20 21 – 25 17 26 – 30 25 31 – 35 2 36 - 40 1

Grouped Data Example 2. A group of University students took part in a sponsored race. The number of laps completed is given in the table below. Use the information to: (a) Calculate an estimate for the mean number of laps. (b) Determine the modal class. (c) Determine the class interval containing the median. number of laps frequency 1 -5 2 6 – 10 9 11 – 15 15 16 – 20 20 21 – 25 17 26 – 30 25 31 – 35 2 36 - 40 1 midpoint(c. c) 3 8 13 18 23 28 33 38 c. c. X f 6 72 195 360 391 700 66 38 Mean estimate = 1828/91 = 20. 1 laps

Grouped Data Example 2. A group of University students took part in a sponsored race. The number of laps completed is given in the table below. Use the information to: (a) Calculate an estimate for the mean number of laps. (b) Determine the modal class. (c) Determine the class interval containing the median. number of laps frequency (x) 1 -5 2 6 – 10 9 11 – 15 15 16 – 20 20 21 – 25 17 26 – 30 25 31 – 35 2 36 - 40 1 Modal Class 26 - 30

Grouped Data Example 2. A group of University students took part in a sponsored race. The number of laps completed is given in the table below. Use the information to: (a) Calculate an estimate for the mean number of laps. (b) Determine the modal class. (c) Determine the class interval containing the median. number of laps frequency (x) c. F. 1 -5 2 2 6 – 10 9 11 11 – 15 15 26 16 – 20 20 46 21 – 25 17 63 26 – 30 25 88 31 – 35 2 90 36 - 40 1 91 The 46 th data value is in the 16 – 20 class , median ≈ 18 (91+1)/2 = 46
- Slides: 14