Mean and Fluctuating Quantities Ocean Surface 3 D


 2. Calculate")

 f")


- Slides: 35
Mean and Fluctuating Quantities Ocean Surface 3 D Turbulence Current Meter Mean Flow Fluctuating Flow One Dimensional Measurement time
Three Types of Averages Ensemble Time Space Ergodic Hypothesis: Replace ensemble average by either a space or time average
Concept of Correlation Function Auto Correlation Function Cross Correlation Function
Concept of Spatial Homogeneity and Temporal Stationarity Time or Space Correlation Function R
Homogeneous/Stationary I D Correlation Function
Velocity Cross Correlation Function Auto Covariance Function
1 r x r=0 Time or Space Axis
Concept of Structure Function Microscale Integral scale
Taylor’s Microscale Temporal case Spatial case
How to Calculate Correlation Functions from Data x, t L, T
Concept of Spectrum Temporal Spectrum
Spatial Spectra Terminology
Normalized Correlation Function and Spectra Integral Scale = Area under curve You can show that: r x
3 D + Time Spectra
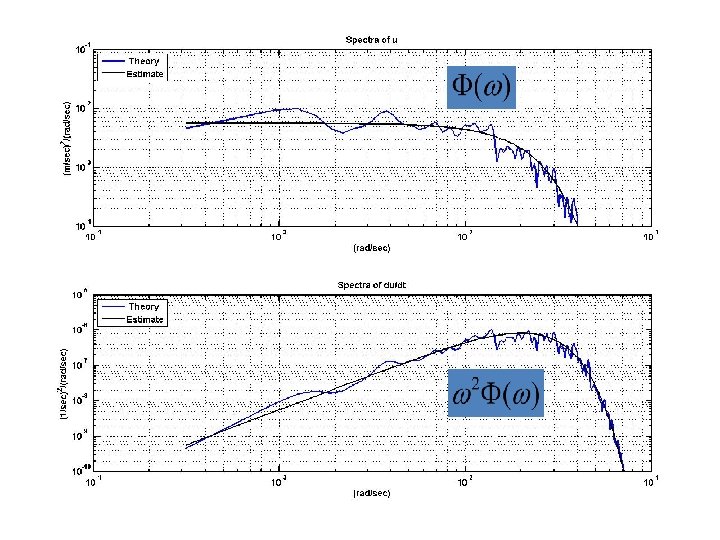
Gradient Spectra
Spatial Spectra Gradient Spectra
Use of the Log-Log plot Linear Plot Log-Log Plot p=-2 100 p=-2 20 10 p=2 0 1 2 20 10
Spectra Area under curve Interpret k as eddy of size Gradient Spectra Area under curve
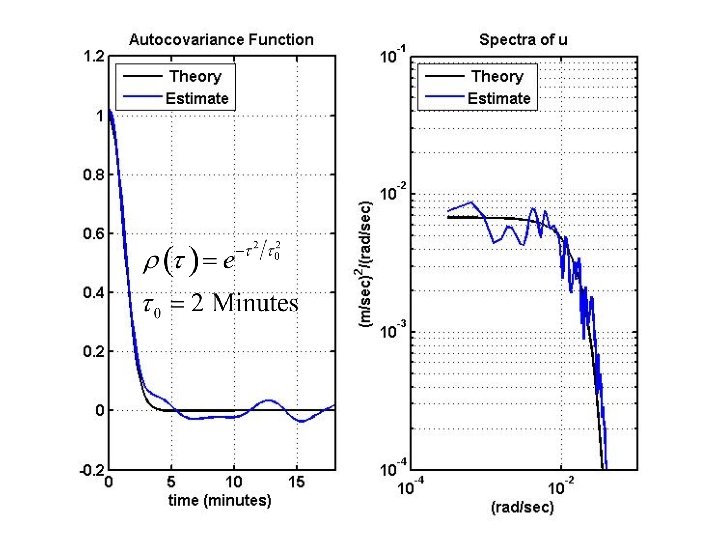
is the area under w Consider Model Correlation Function
From F we create a simulation of and
Calculation of Spectra = Decomposition of Variance into contributions by sines/cosines L
Calculation of Spectra of u’ Dx L 1. Choose Sampling Dx (digitizing) 2. Calculate f the DFT (Discrete Fourier Transform) of sections of u’ 3. Estimate Spectra by where 1 & 2 3 n
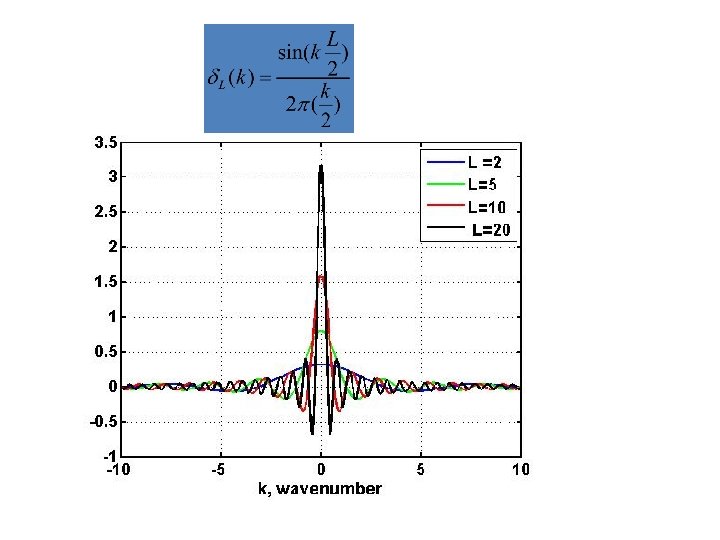
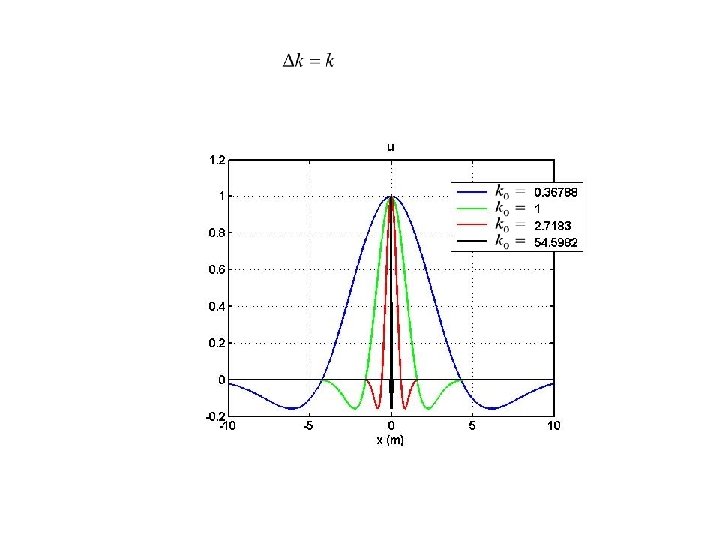
The Uncertainty Principle
Developing the Concept of an Eddy Real(u) f
The Eddy
Q
k. Q
k. Q