
ME 612 Metal Forming and Theory of Plasticity
- Slides: 18
ME 612 Metal Forming and Theory of Plasticity 3. Work Hardening Models Assoc. Prof. Dr. Ahmet Zafer Şenalp e mail: azsenalp@gmail. com Mechanical Engineering Department Gebze Technical University
3. Work Hardening Models In this section work hardening models that are applicable to different materials and metal forming operations are covered. For correct model selection material experiment results and specifications of metal forming operation should be considered. Dr. Ahmet Zafer Şenalp ME 612 Mechanical Engineering Department, GTU 2
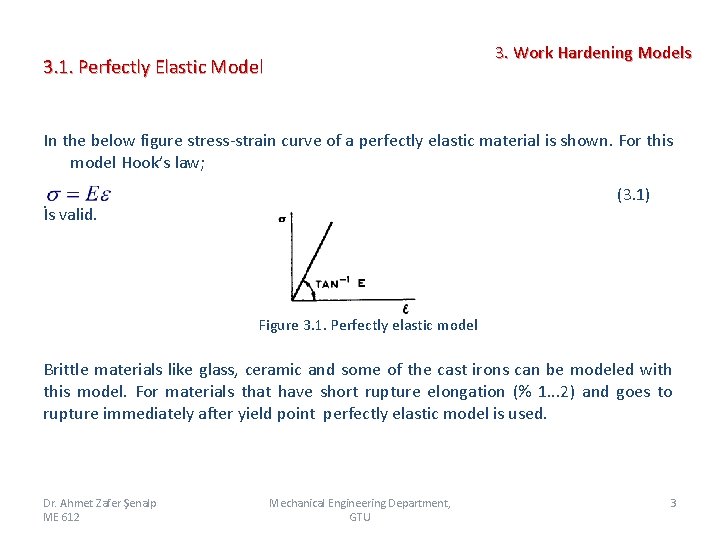
3. Work Hardening Models 3. 1. Perfectly Elastic Model In the below figure stress strain curve of a perfectly elastic material is shown. For this model Hook’s law; (3. 1) İs valid. Figure 3. 1. Perfectly elastic model Brittle materials like glass, ceramic and some of the cast irons can be modeled with this model. For materials that have short rupture elongation (% 1. . . 2) and goes to rupture immediately after yield point perfectly elastic model is used. Dr. Ahmet Zafer Şenalp ME 612 Mechanical Engineering Department, GTU 3
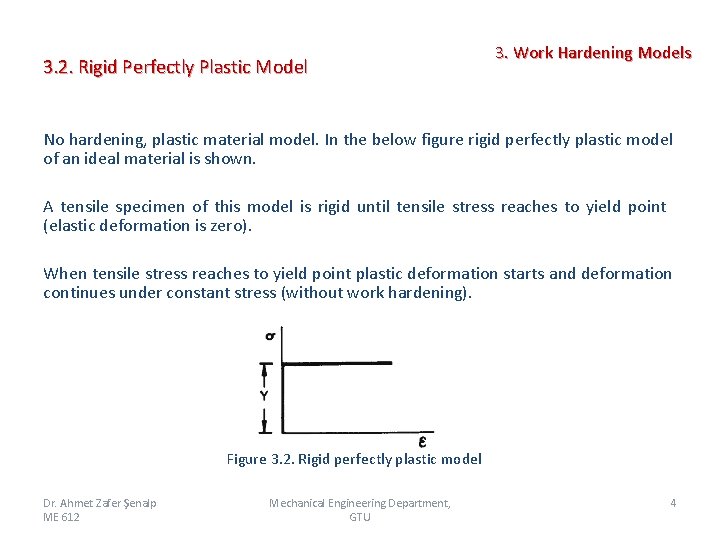
3. 2. Rigid Perfectly Plastic Model 3. Work Hardening Models No hardening, plastic material model. In the below figure rigid perfectly plastic model of an ideal material is shown. A tensile specimen of this model is rigid until tensile stress reaches to yield point (elastic deformation is zero). When tensile stress reaches to yield point plastic deformation starts and deformation continues under constant stress (without work hardening). Figure 3. 2. Rigid perfectly plastic model Dr. Ahmet Zafer Şenalp ME 612 Mechanical Engineering Department, GTU 4
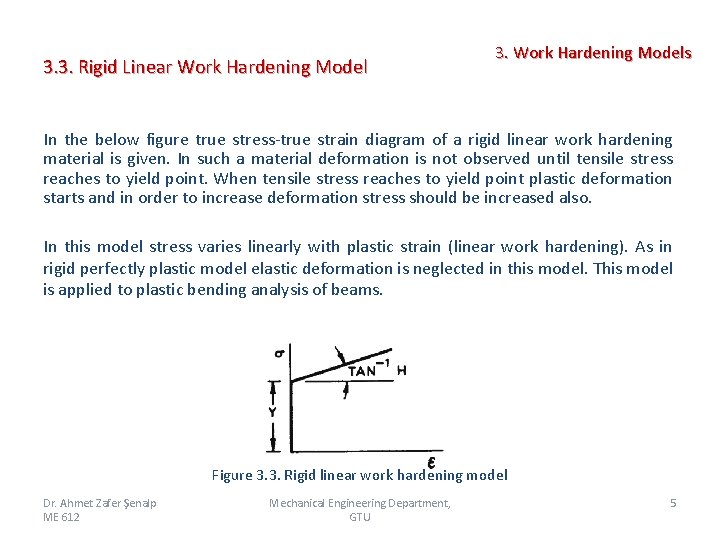
3. 3. Rigid Linear Work Hardening Model 3. Work Hardening Models In the below figure true stress true strain diagram of a rigid linear work hardening material is given. In such a material deformation is not observed until tensile stress reaches to yield point. When tensile stress reaches to yield point plastic deformation starts and in order to increase deformation stress should be increased also. In this model stress varies linearly with plastic strain (linear work hardening). As in rigid perfectly plastic model elastic deformation is neglected in this model. This model is applied to plastic bending analysis of beams. Figure 3. 3. Rigid linear work hardening model Dr. Ahmet Zafer Şenalp ME 612 Mechanical Engineering Department, GTU 5
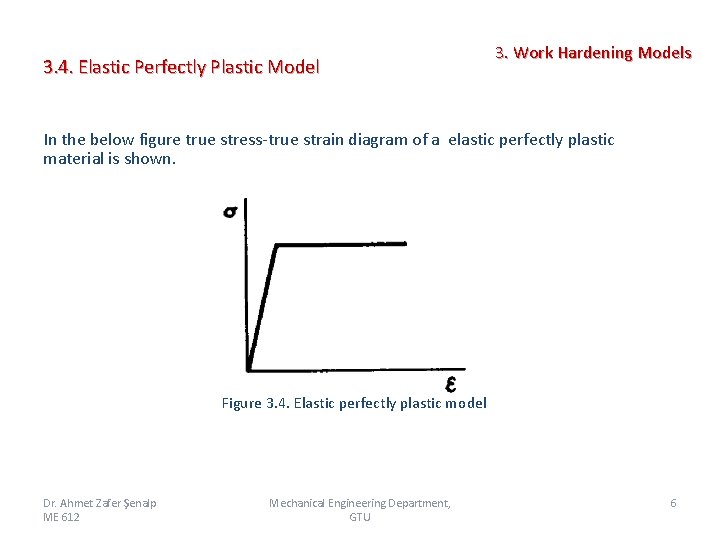
3. 4. Elastic Perfectly Plastic Model 3. Work Hardening Models In the below figure true stress true strain diagram of a elastic perfectly plastic material is shown. Figure 3. 4. Elastic perfectly plastic model Dr. Ahmet Zafer Şenalp ME 612 Mechanical Engineering Department, GTU 6
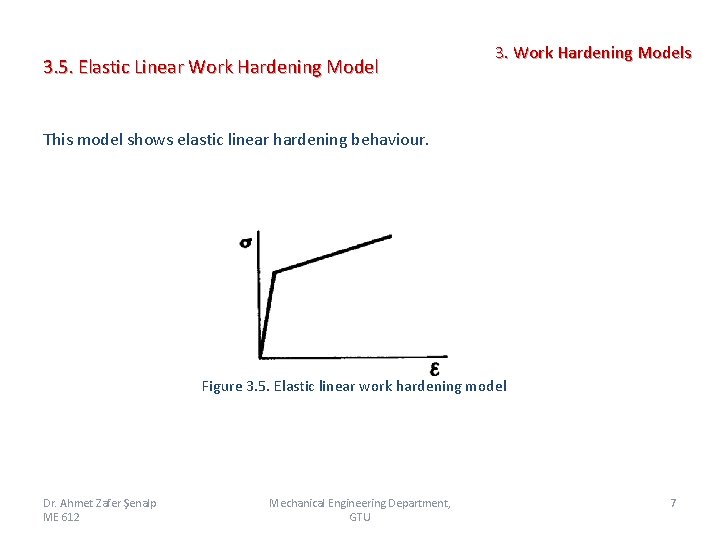
3. 5. Elastic Linear Work Hardening Model 3. Work Hardening Models This model shows elastic linear hardening behaviour. Figure 3. 5. Elastic linear work hardening model Dr. Ahmet Zafer Şenalp ME 612 Mechanical Engineering Department, GTU 7
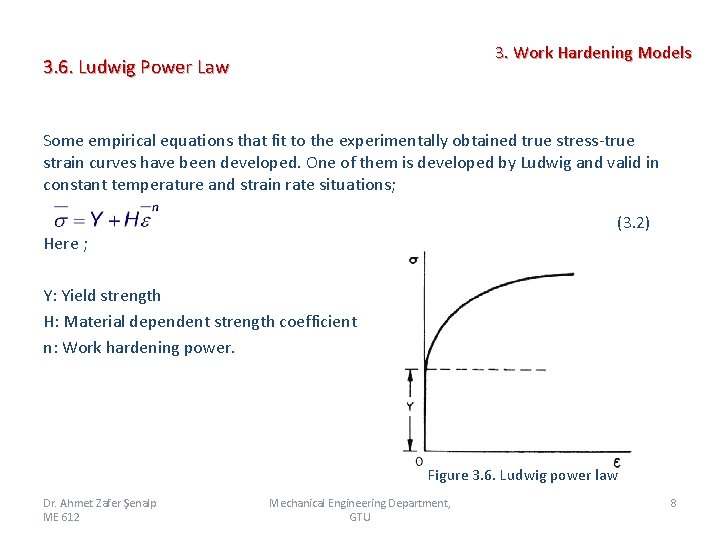
3. Work Hardening Models 3. 6. Ludwig Power Law Some empirical equations that fit to the experimentally obtained true stress true strain curves have been developed. One of them is developed by Ludwig and valid in constant temperature and strain rate situations; (3. 2) Here ; Y: Yield strength H: Material dependent strength coefficient n: Work hardening power. Figure 3. 6. Ludwig power law Dr. Ahmet Zafer Şenalp ME 612 Mechanical Engineering Department, GTU 8
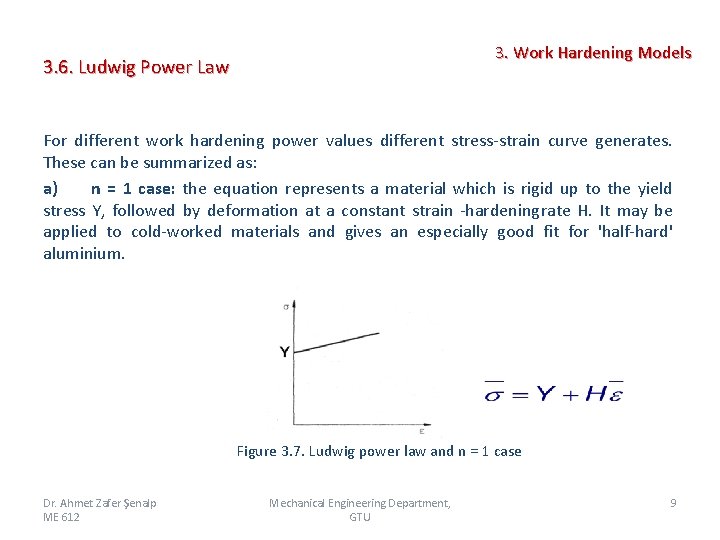
3. Work Hardening Models 3. 6. Ludwig Power Law For different work hardening power values different stress strain curve generates. These can be summarized as: a) n = 1 case: the equation represents a material which is rigid up to the yield stress Y, followed by deformation at a constant strain hardening rate H. It may be applied to cold worked materials and gives an especially good fit for 'half hard' aluminium. Figure 3. 7. Ludwig power law and n = 1 case Dr. Ahmet Zafer Şenalp ME 612 Mechanical Engineering Department, GTU 9
3. Work Hardening Models 3. 6. Ludwig Power Law b) n < 1 case: In this case elastic component of the strain is neglected. After yield point material work hardens however due to plastic deformation there is no linear relation between stress and strain (work hardening is not linear). Dr. Ahmet Zafer Şenalp ME 612 Mechanical Engineering Department, GTU 10
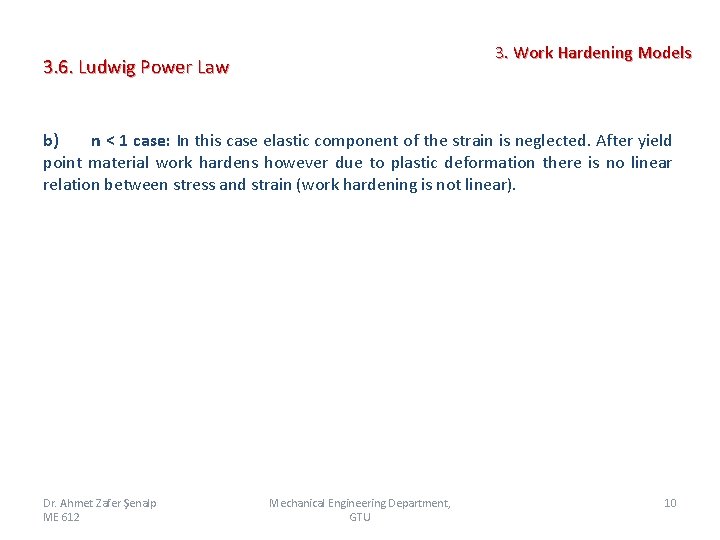
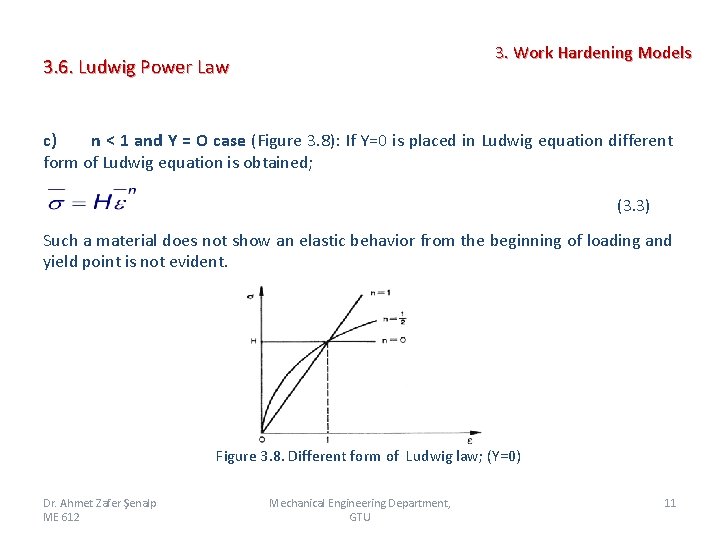
3. Work Hardening Models 3. 6. Ludwig Power Law c) n < 1 and Y = O case (Figure 3. 8): If Y=0 is placed in Ludwig equation different form of Ludwig equation is obtained; (3. 3) Such a material does not show an elastic behavior from the beginning of loading and yield point is not evident. Figure 3. 8. Different form of Ludwig law; (Y=0) Dr. Ahmet Zafer Şenalp ME 612 Mechanical Engineering Department, GTU 11
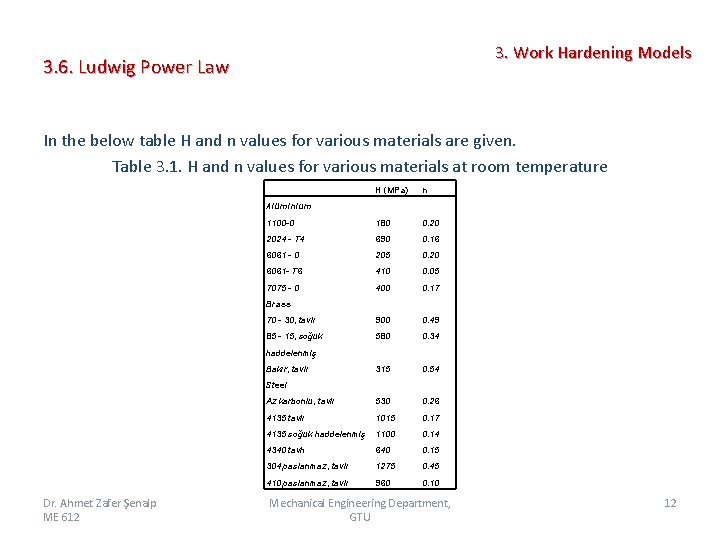
3. Work Hardening Models 3. 6. Ludwig Power Law In the below table H and n values for various materials are given. Table 3. 1. H and n values for various materials at room temperature H (MPa) n 1100 -0 180 0. 20 2024 - T 4 690 0. 16 6061 - 0 205 0. 20 6061 - T 6 410 0. 05 7075 - 0 400 0. 17 70 - 30, tavlı 900 0. 49 85 - 15, soğuk 580 0. 34 315 0. 54 Az karbonlu, tavlı 530 0. 26 4135 tavlı 1015 0. 17 4135 soğuk haddelenmiş 1100 0. 14 4340 tavh 640 0. 15 304 paslanmaz, tavlı 1275 0. 45 410 paslanmaz, tavlı 960 0. 10 Alüminium Brass haddelenmiş Bakır, tavlı Steel Dr. Ahmet Zafer Şenalp ME 612 Mechanical Engineering Department, GTU 12
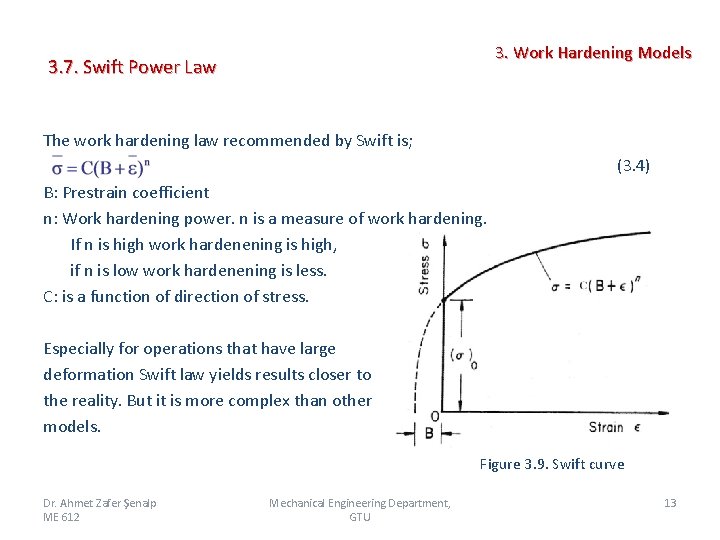
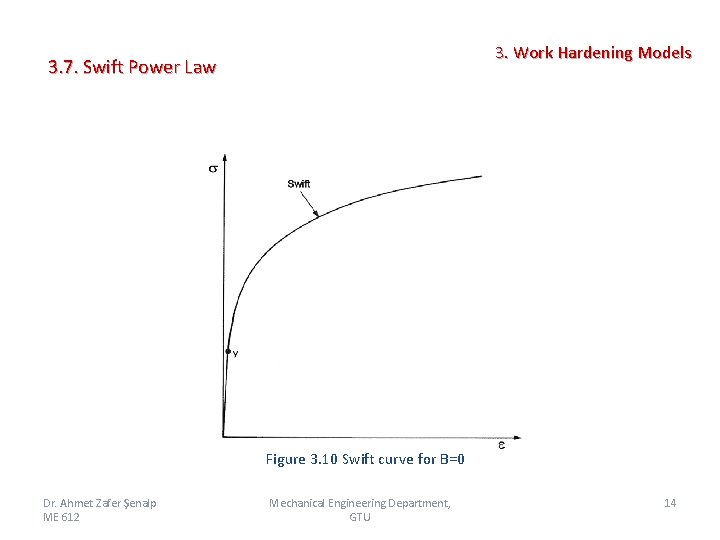
3. Work Hardening Models 3. 7. Swift Power Law The work hardening law recommended by Swift is; (3. 4) B: Prestrain coefficient n: Work hardening power. n is a measure of work hardening. If n is high work hardenening is high, if n is low work hardenening is less. C: is a function of direction of stress. Especially for operations that have large deformation Swift law yields results closer to the reality. But it is more complex than other models. Figure 3. 9. Swift curve Dr. Ahmet Zafer Şenalp ME 612 Mechanical Engineering Department, GTU 13
3. Work Hardening Models 3. 7. Swift Power Law Figure 3. 10 Swift curve for B=0 Dr. Ahmet Zafer Şenalp ME 612 Mechanical Engineering Department, GTU 14
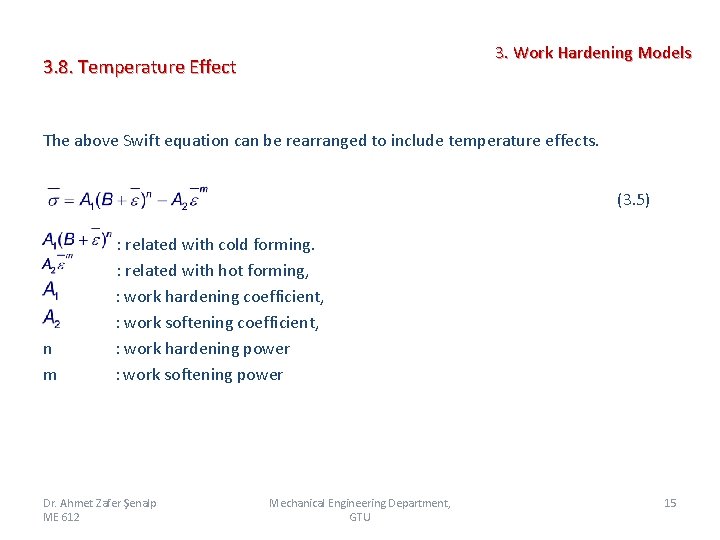
3. Work Hardening Models 3. 8. Temperature Effect The above Swift equation can be rearranged to include temperature effects. (3. 5) n m : related with cold forming. : related with hot forming, : work hardening coefficient, : work softening coefficient, : work hardening power : work softening power Dr. Ahmet Zafer Şenalp ME 612 Mechanical Engineering Department, GTU 15
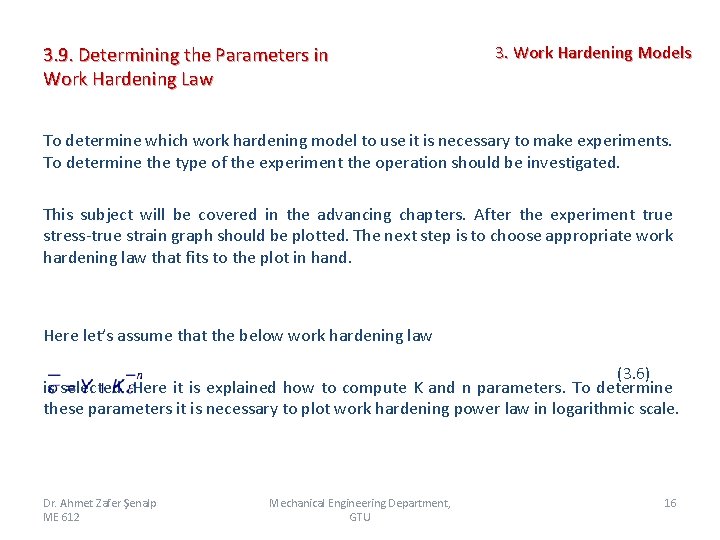
3. 9. Determining the Parameters in Work Hardening Law 3. Work Hardening Models To determine which work hardening model to use it is necessary to make experiments. To determine the type of the experiment the operation should be investigated. This subject will be covered in the advancing chapters. After the experiment true stress true strain graph should be plotted. The next step is to choose appropriate work hardening law that fits to the plot in hand. Here let’s assume that the below work hardening law (3. 6) is selected. Here it is explained how to compute K and n parameters. To determine these parameters it is necessary to plot work hardening power law in logarithmic scale. Dr. Ahmet Zafer Şenalp ME 612 Mechanical Engineering Department, GTU 16
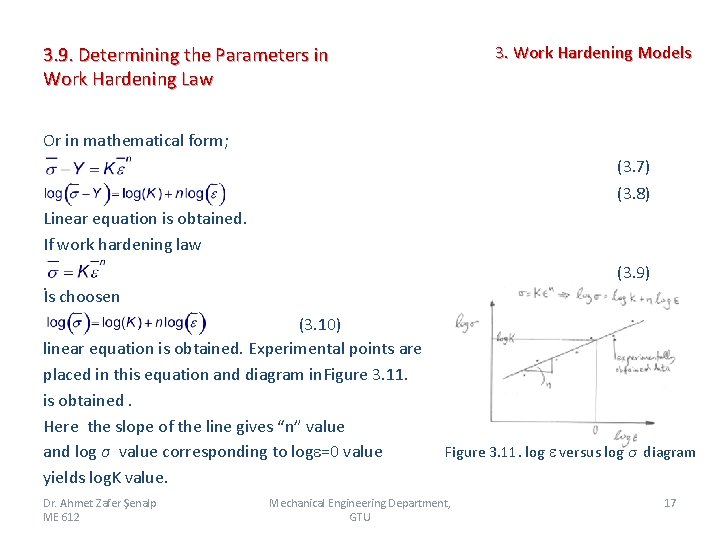
3. Work Hardening Models 3. 9. Determining the Parameters in Work Hardening Law Or in mathematical form; (3. 7) (3. 8) Linear equation is obtained. If work hardening law (3. 9) İs choosen (3. 10) linear equation is obtained. Experimental points are placed in this equation and diagram in. Figure 3. 11. is obtained. Here the slope of the line gives “n” value and log σ value corresponding to log =0 value yields log. K value. Dr. Ahmet Zafer Şenalp ME 612 Figure 3. 11. log versus log σ diagram Mechanical Engineering Department, GTU 17
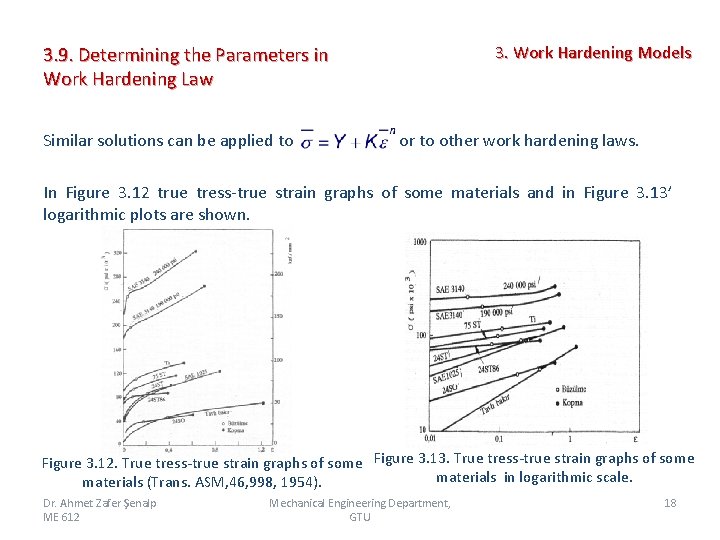
3. Work Hardening Models 3. 9. Determining the Parameters in Work Hardening Law Similar solutions can be applied to or to other work hardening laws. In Figure 3. 12 true tress true strain graphs of some materials and in Figure 3. 13’ logarithmic plots are shown. Figure 3. 12. True tress true strain graphs of some Figure 3. 13. True tress true strain graphs of some materials in logarithmic scale. materials (Trans. ASM, 46, 998, 1954). Dr. Ahmet Zafer Şenalp ME 612 Mechanical Engineering Department, GTU 18