MDE ACCOUNTABILITY INDEX SYSTEM Emily Mc Evoy Assessment

MDE ACCOUNTABILITY INDEX SYSTEM Emily Mc. Evoy Assessment Consultant Macomb ISD Updated after MI School Data Release

Major Accountability Changes • Unification of tasks previously accomplished by separate systems • • Scorecard Top-to-Bottom (TTB) Gap Ranking English Learner (EL) accountability (i. e. , NCLB Title III AMAOs) • Partial points based on the degree to which targets are met • Common statewide targets • Only building-level accountability • Frequency of federal designations • Addition of School Quality/ Student Success indicator • 1% cap moves to participation
 will be run using the")
Accountability Timelines • 2016 -17 accountability (Winter/Early Spring 2018) will be run using the new system and will include required federal designations. • 2017 -18 accountability (Fall 2018) • All public schools will receive a 2017 -18 accountability school index • TSI schools will be identified using 2017 - 18 • CSI and ATS will not be identified again until 2019 -20

Index System: Long Term Goals and Targets • Index values are tied to performance against long term goals • Percent of goal (target) met • Long term goals are ambitious and aligned to Top 10 in 10 • Goals to increase performance such that the statewide average moves up to the value of the current 75 th percentile by the end of 2024 -25 • Goals are “anchored” at these values through 2024 -25 • Expectations are the same for all students • Participation requirement (target) remains at 95%

Index System: Long Term Goal Values Component Proficiency – ELA Proficiency – Math Growth – ELA Growth – Math Graduation – 4 -year Graduation – 5 -year Graduation – 6 -year EL Progress Baseline Value (2016 -17) 49. 14% 37. 55% 49. 99% 43. 49% 79. 79% 81. 99% 81. 25% 46. 41% Long-term Goal (2024 -25) 60. 00% 47. 55% 57. 92% 49. 90% 50. 70% 94. 44% 96. 49% 97. 00% 59. 26% Handout
 are calculated by combining component indices")
Index System: Components • Overall indices (0 -100) are calculated by combining component indices using the following weights: • • 29% 34% 10% 14% 2% 1% • Weights are redistributed proportionally if a school is missing a component Proficiency • Proficiency and Growth use Growth Math and ELA only Graduation Rate English Learner (EL) Progress • Each component also has a School Quality/Student Success index value from 0 -100 Participation 3% Assessment Participation EL Participation Handout

Sample Adjusted Weights

Index System: Subgroups • For the index, the minimum subgroup n-size for all components is: • 10 or more students to be included in index displays • 30 or more students to be included in index calculations • Subgroups with less than 10 students will not have information displayed nor will they be included in the index calculation. • Subgroups are weighted equally in calculating component index values • Aligned with Top 10 in 10 goals of ensuring equity in the Michigan’s education system • Bottom 30% is for reporting only – not included in index calculations

Index System: Percent Meeting Adequate Growth • Describes the percent of students on a path to become proficient, or to maintain proficiency, within a specific timeframe • Measured by the percent of students that either: • Have a growth score meeting or exceeding their growth target • Were previously not-proficient but moved to proficiency Handout

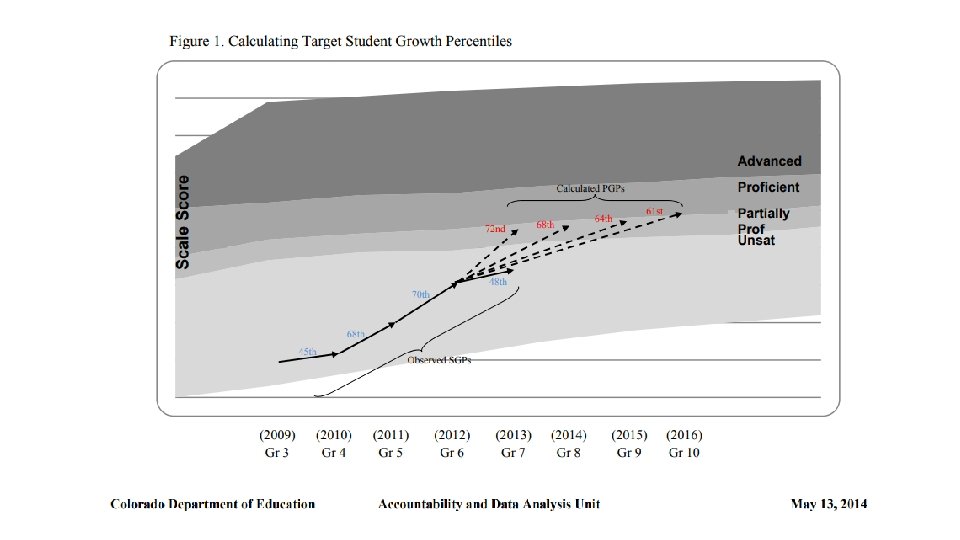
Index System: Growth Scores • Michigan’s growth score measure is the Student Growth Percentile (SGP) • Indicates what percent of similar students had lower growth than that student • SGPs describe a student’s learning over time compared to other students with similar prior achievement scores (scale scores). • Growth Scores (SGPs) can range from 1 -99 • Average growth score (SGP) is 50 Handout

Index System: Growth Targets • Michigan’s growth target measure is the Adequate Growth Percentile (AGP) • AGPs describe how much growth a student needs to consistently attain to be on a path to reach, or maintain, proficiency within a set timeframe. • Indicates what growth score (SGP) a student needs to reach to count as met adequate growth • Growth Targets (AGPs) can range from 1 -99

Index System: Growth Target Timeframes • Describe the amount of time the growth target (AGP) model is expecting the student to take to grow to proficiency • Set based on the average time previous students with similar scores took to reach proficiency • Currently vary between 1 -3 years • Maximum of 3 years is due to limitations of data and not a policy determination

MI School Data – Example

MI School Data – Example Make sure to check overall index value for each student groups 100 Sum of the Column

MI School Data – Example Proficiency and Growth are calculated the same!

MI School Data – Example Bottom 30% for reporting ONLY! It is NOT used in index calculations. Straight Average of the Column excluding Bottom 30%

MI School Data – Example 2 81. 88

MI School Data – Example 173 FAY 172 FAY Enrolled Weighted Avg. of # of FAY Enrolled

MI School Data – Example If columns match then 95% of that Student Group was tested.

MI School Data – Example #Met Growth / # FAY Tested Part. Adj. Growth / Target

MI School Data – Example What is the difference between “Building Overall” and “All Students”?

MI School Data – Example “Building Overall” is the average between “All Students” and any student group who has 30 or more FAY enrolled Average to get “Building Overall”

MI School Data – Example “Building Overall” is the average between “All Students” and any student group who has 30 or more FAY enrolled Average to get “Building Overall”

MI School Data – Example

MI School Data – Example High School Example

MI School Data – Example

MI School Data – Example Weighted Average based on # of Students Enrolled in each subject area Straight Average of the Column

MI School Data – Example

MI School Data – Example

MI School Data – Example

MI School Data – Example 4 -Year Cohort = 50% 5 -Year Cohort = 30% 6 -Year Cohort = 20%
- Slides: 32